


It's not just facts and figures that rule the financial markets - emotions have just as strong an impact. Fear, euphoria, uncertainty or greed influence the behavior of investors worldwide on a daily basis. Phases of extreme euphoria or panic often create excellent entry opportunities for anti-cyclical investors.
In this article you will learn how to use the Sentiment analysis know the most important tools, methods and practical strategies. Ideally suited for Trading beginnersto interpret market sentiment professionally and incorporate it profitably into your investment decisions.

The most important in a nutshell
- Sentiment analysis measures market sentiment and identifies emotional exaggerations.
- It is ideal for identifying potential turning points.
- It is particularly effective in combination with technical and fundamental analysis.
- Extreme sentiment values often offer opportunities for anti-cyclical trading.
What is sentiment analysis and why is it so powerful?
The financial markets have long been driven by more than just fundamental data and company figures. Emotions play a central role. Fear, euphoria, uncertainty or greed. All of these influence the actions of market participants.
This is precisely where the Sentiment analysis It analyzes the prevailing market sentiment and allows conclusions to be drawn about possible price trends.


If many investors are anxious and sell, this can be a buy signal and vice versa. Sentiment analysis is therefore regarded as a contra-indicator that can recognize turning points in the market at an early stage.
What does sentiment mean?
Sentiment describes the collective emotional assessment of market participants. A bullish sentiment means optimism, a bearish sentiment pessimism.
Advantages and limitations of sentiment analysis
Like every analytical tool, sentiment analysis has its strengths and weaknesses. If you are looking more closely at the subject, you should be aware of both aspects. This is the only way to integrate the method into your investment strategy in a meaningful way.
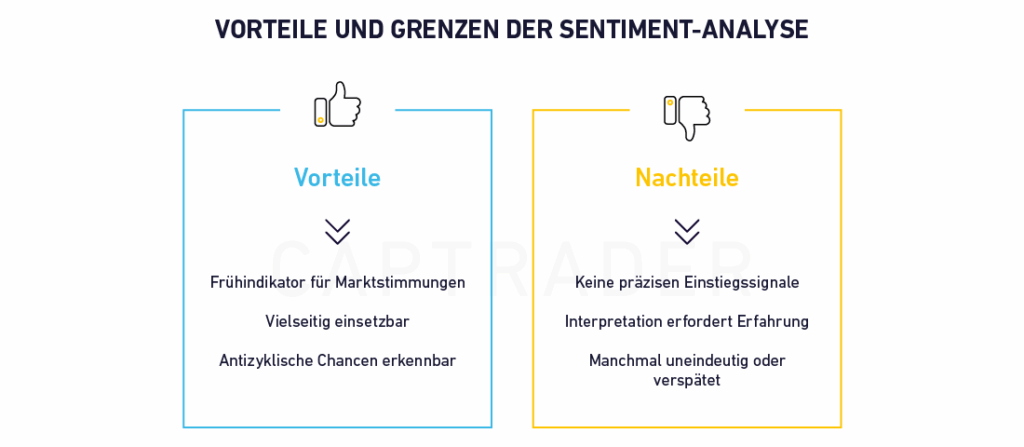
A major advantage of sentiment analysis is its ability to make emotional exaggerations visible. While traditional technical indicators often react to past price patterns, sentiment can provide real-time insights into how the majority of market participants think and feel.
Particularly at turning points, i.e. in phases of extreme fear or euphoria, sentiment analysis often shows signals before the price actually turns.
Another plus point is their Versatility. You can view sentiment data on individual shares, entire Indexes, Raw materials or even Cryptocurrencies apply. Combined with other tools, such as fundamental valuation or technical chart analysis, the method becomes particularly powerful.
On the other hand, you should not underestimate the limitations. Sentiment data is difficult to quantify, sometimes incomplete and often contradictory. Not every extreme value immediately leads to a trend reversal. Markets can remain irrational for longer than you remain solvent.
In addition, sentiment indicators do not provide specific entry points, but rather serve as a barometer of sentiment. They show you the general emotional climate.
You still have to decide for yourself when to put up an umbrella or pack sunscreen.
How does sentiment analysis work on the stock market?
To use sentiment analysis correctly, you should first understand the basic principle: Behind every price movement are emotions such as greed, fear or hope. This is exactly where Stock market psychology on. It makes it clear that the market is a mirror of human behavior.
Typical psychological patterns:
- Price rise → euphoria: Investors become greedy because they expect further profits.
- Price decline → fear: Panic selling leads to many people getting out at the worst possible time.
A well-known quote from Warren Buffett sums up this dynamic:
"Be fearful when others are greedy and greedy when others are fearful."
This gives rise to a central idea:
The masses often act irrationally in extreme situations. And this is exactly where sentiment indicators come in. They help you to vThe aim is to measure the prevailing mood on the market in order to make more informed and objective decisions.
The Core idea of sentiment analysis:
- Extreme moods often indicate a trend reversal
- When there is excessive optimism (everyone is bullish), the market is often "sold out"
- When pessimism is strong (everyone is bearish), selling interest is usually exhausted
- When there is excessive optimism (everyone is bullish), the market is often "sold out"
Example: Financial crisis 2008
- Before the crash: overoptimism and carelessness
- After the slump: deep pessimism, but also Great entry opportunities for courageous investors
Important:
Sentiment indicators are not classic timing instruments. Rather, they give you a feeling for whether the market is currently overbought or oversold. In combination with technical or fundamental analysis this creates a particularly strong basis for your investment strategy.
The most important sentiment indicators at a glance
Now that you understand the basic principle, let's look at the specific tools. There are a variety of sentiment indicators that you can use depending on your trading style and market phase. They can be roughly divided into two categories: classic and modern indicators.
Classic indicators
One particularly established indicator is the so-called Put-call ratio. This measures the ratio of put options (puts) to call options (calls). A high value indicates pessimism. Many investors are hedging against falling prices. A low value indicates optimism. The put-call ratio is particularly suitable as a contra-indicator.
Extreme values often signal an exaggeration. And thus an imminent trend reversal.
Another important indicator is the data from the Commitment of Traders (COT) Report. This weekly overview shows how various market participants are positioned in the futures market. Particularly interesting: Commercials usually act anti-cyclically.
If market participants are betting massively on falling prices, it is worthwhile for you to take a closer look.
Also important are the so-called Volatility indicessuch as the well-known VIX ("fear index"), which measures the expected fluctuation range of the S&P 500. If the VIX rises sharply, there is nervousness in the market. In combination with other signals, this can be an indication of panic and thus a possible bottom.
| Classic sentiment indicators | Brief description |
| Put-call ratio | Ratio of put options to call options: Measures pessimism/optimism |
| COT Report | Positioning of major market participants in the futures market |
| Volatility indices (VIX, VDAX) | Measure the expected range of fluctuation: Indicators of anxiety/nervousness |
Survey-based indicators
In addition to quantitative indicators, there are also so-called survey-based sentiment indicators.
These record how investors subjectively assess the current market situation, i.e. the famous "soft data". Even if this data is based on opinions, in combination with other analyses it provides you with valuable indications of potential market movements.
Typical characteristics of survey-based indicators:
- Subjective, but informativeThe mood of market participants often reveals more than hard figures.
- Useful in context: In combination with technical or fundamental data, a more complete picture emerges.
A particularly well-known example is the AAII Sentiment Survey (American Association of Individual Investors):
- Weekly survey of US private investors since 1987
- Assessment of the stock market over a six-month horizon: bullish, neutral or bearish
- Interpretation: An above-average proportion of optimists can be a warning signal for an overbought market situation
There are also comparable surveys in Europe:
- Sentix Sentiment Index
- Over 5,000 participants - including many institutional investors
- Covers various asset classes: Equities, bonds, commodities, currencies
- Particularly revealing: Deviations between short-term and medium-term expectations (This difference may indicate increasing uncertainty or trend reversals)
Another interesting sentiment indicator comes from the Frankfurt Stock Exchange:
- Survey of institutional and private investors - broken down by group
- analysis of the difference:
- Indications of potential imbalances
- Early indicators for possible Counter-movements in the market
These indicators do not help you to time the exact turning point - but they do give you a sense of when the masses are thinking too one-sidedly. And it is precisely then that it often pays to be particularly attentive.

Modern methods: sentiment analysis using artificial intelligence
In today's digitalized world, sentiment analysis has evolved significantly. In addition to traditional and survey-based indicators, the analysis of large amounts of data, so-called "big data", now plays a central role.
With the help of artificial intelligence (AI), millions of data points from social networks, news portals and financial forums can be analyzed in real time.
Particularly popular is the so-called Social Listening. Specialized algorithms analyze how often certain terms or stock names are mentioned in social media such as X (formerly Twitter), Reddit or specialized stock market forums.
Not only the frequency, but also the tone of voice (positive, neutral, negative) is evaluated. This real-time analysis can provide very early indications of new trends or changes in sentiment.
A typical example: If a certain stock, such as Tesla or Nvidia, is suddenly mentioned very often in a positive light, this could indicate an impending price rally. Or overheating if there is already too much euphoria.
In addition, Google search trends, blog articles or YouTube comments can also be part of the sentiment analysis. Thanks to advanced Natural Language Processing (NLP) technologies, today's systems are able to differentiate between irony, sarcasm and genuine opinions. This is a decisive step forward for valid analyses.
Application in practice: How to use sentiment analysis for your trading
Theory is one thing, but how do you successfully apply the knowledge gained in practice? Sentiment analysis is a powerful tool if you use it correctly.
The anti-cyclical approach, where you trade against the current, is particularly exciting. In other words, you buy when sentiment is low and sell when euphoria prevails. One of many Day trading tips for both experienced and inexperienced investors.
Sentiment for anti-cyclical investing
Many investors make the mistake of using emotions such as fear or greed as a yardstick for their decisions. But it is precisely these emotional impulses that often lead to costly mistakes. This is where sentiment analysis comes into play.
If you recognize that the mass of investors are overly optimistic or pessimistic, you can act against the trend and often achieve better results. It is best to document your observations in a Trading Journalso that you can better understand your decisions later.
A practical example: After a long-lasting bear market, the Fear & Greed Index at an extremely low level, while at the same time the media are reporting panic selling. Sentiment is at rock bottom. Now could be the time to selectively enter the market.
It is important that you Do not use the sentiment indicator as the sole basis for decision-makingbut as part of a larger analysis process.
If other indicators (e.g. technical support, good fundamental data) coincide with the sentiment signal, this significantly increases the probability of a successful decision.


Combination with technical and fundamental analysis
Sentiment analysis provides valuable information, but it only unfolds its full potential in combination with other analysis methods. Particularly effective is the Interaction with the technical analysis and the fundamental Evaluation of companies.
When several independent signals combine to form a uniform picture, the quality of your decision increases considerably.
A practical example: Let's assume that a certain share price has fallen sharply in recent weeks. At the same time, the Fear & Greed Index indicates an extreme phase of fear. The Technical analysis provides a buy signal. For example, a double low or a breakout above the moving average.
If these factors are also consistent with a positive fundamental analysis, for example in the case of Growth shares with strong sales growth or undervalued Value shares, This creates a particularly promising entry opportunity.
Fundamental analysis helps you to assess the quality of a company. Key figures such as the price/earnings ratio (P/E ratio), equity ratio or margins provide objective indications of economic strength.
If these are combined with an extremely negative sentiment, this can indicate a downward exaggeration. And thus signal an anticyclical buying opportunity.

Strategies for different time horizons
The application of sentiment analysis depends heavily on the time horizon you are pursuing as an investor. While short-term traders are primarily looking for quick turning points and volatile market phases, long-term investors tend to pursue strategic entry and exit points in the major market cycle.
However, both groups can benefit equally from sentiment analysis. In different ways in each case.
For Daytrader and Swingtrader short-term changes in sentiment are particularly relevant. For example, social media signals, current Google trends or strongly fluctuating volatility indices are suitable here.
If there is an abrupt change in investor sentiment within a few hours or days, this may indicate an imminent change in direction. Or a short-term excess of fear or greed.
Long-term investors, on the other hand, pay more attention to fundamental changes in collective sentiment. Over months or even years, market cycles can be identified in which either euphoria or deepest despair prevail.
For example, those who bought in 2020 after the coronavirus crash, when panic and uncertainty dominated the market, were able to achieve considerable returns in retrospect.
It is important that you align your strategy consistently with your time horizon. A long-term investor should not be driven crazy by short-term mood swings. Just as a short-term trader should not rely on sentiment trends lasting several months. The correct assessment of which signal is relevant for your strategy makes all the difference.
The Fear & Greed Index as a popular sentiment analysis
When it comes to assessing the current market sentiment on the US equity market, the Fear & Greed Index from CNN one of the most popular instruments. And not without reason.
The index brings together seven different sub-indicators to reflect sentiment on a scale from 0 (extreme fear) to 100 (extreme greed). A value of 50 stands for a balanced market sentiment.
For investors, the index offers a compact, intuitive overview of the current psychological climate on the stock market. The Fear & Greed Index is particularly effective as a counter-indicator in phases of strong exaggeration (be it in the direction of euphoria or panic).
Values above 75 often indicate excessive optimism, while values below 25 indicate strong uncertainty and fear. And thus offer potentially favorable entry opportunities.
A look into the past: Corona crash as a prime example
An impressive example of the informative value of the Fear & Greed Index is provided by the March 2020. In the midst of the corona crash, the index fell to below 10 pointswhich was a historic low at the time.
Uncertainty was omnipresent, with the media reporting on drastic price losses and economic shockwaves. And yet, those who were brave enough to invest anti-cyclically at this time were able to benefit from an impressive market recovery in the months that followed.
The index signaled: The panic is at its maximum. The bottom may have been reached.
This phase underlines the fact that the Fear & Greed Index should not be seen as the sole trigger, but as a valuable barometer of sentiment. Especially in combination with technical or fundamental analyses, it can help investors to make rational decisions in irrational markets.


The 7 sub-indicators of the Fear & Greed Index
Each component of the index highlights a different facet of investor behavior and is assigned its own score. The total value of the index is calculated from the average of these seven individual values.
| Indikator | What is measured? |
| Market momentum | Performance of the S&P 500 compared with the 125-day average |
| Strength of share prices | Percentage of shares at 52-week highs |
| Marktbreite | Ratio of rising to falling stocks on the NYSE |
| Put-call ratio | Ratio of put options to call options (hedging vs. speculation) |
| Volatility Index (VIX) | Amount of the expected fluctuation - the higher, the greater the market anxiety |
| Demand for safe investments | Risk aversion measured by demand for US government bonds and gold |
| Junk bond demand | Risk appetite measured by the spread between high-yield bonds and safe bonds |
CapTrader can do that:
We provide you with various platforms for trading free of charge. These include, for example, the powerful Trader Workstation, the CapTrader Desktop, the best trading app, the TraderFox Tradingdesk, which allows direct integration of TraderFox signals and much more.
Conclusion: Will you use sentiment analysis?
Sentiment analysis is more than just a trend. It is a powerful tool that helps you to understand the psychology behind market events.
In a world where emotions such as fear and greed often outweigh fundamentals, analyzing market sentiment gives you valuable clues as to when it's time to invest boldly or tread carefully.
Whether as an early indicator of potential turning points or as a complementary filter to technical and fundamental analysis, sentiment data brings a new, deeper perspective to your investment strategy.
The true value of this tool is particularly evident in extreme market phases: when the majority of investors are acting irrationally, this is often precisely when you can identify the best opportunities with the help of sentiment analysis.
Of course, it is no substitute for a well-founded overall analysis, but it can make your decisions more objective, more confident and more successful in the long term. Don't use it in isolation, but as an emotional early warning system that helps you to swim against the tide when it's worth it.
Now it's up to you. Will you use sentiment analysis to monitor market sentiment in the future?
