Your Broker for worldwide trading

DGI sample portfolio: The report on the first quarter of 2025

One worrying political headline follows the next. One of the best-known financial market proverbs about the short legs of political stock markets may have always been true in essence from a long-term perspective. In this review of the DGI model portfolio, I provide a transparent insight into the performance of the individual stocks in the portfolio in the first quarter of 2025, calculate the total return and take a look at the performers and laggards in the portfolio.

Facts and figures for Q1 2025

Let's start by looking at the overall portfolio level before I turn my attention to the individual stocks in the next chapter. The DGI model portfolio was filled with a starting capital of 100.000 Euro. As of 31.03.2025, approx. 62,600 Euro invested.

The next chart shows the positive development of the dividend ladder. Since the portfolio was launched, the companies have paid me a total of around 1,650 Euro to my cash account.
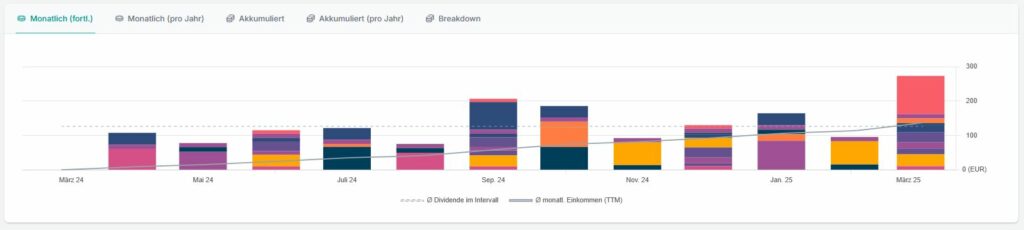
Bar chart with monthly data divided into color-coded categories from May 23 to 25, with a trend line indicating a general increase.
Dividend performance since inception (source: parqet)

Taking all investments into account, I expect a Liquidity reserve from 39,000 euros into the second quarter of 2025. Unrealized gains amount to slightly more 500 Euro. Here is a brief summary of all relevant depot components:

Start-up capital 22.03.2024100.000,00
Invested capital62.633,71
Unrealized capital gains513,93
Terminal value 31.03.202563.147,64
Free start-up capital at the end of Q1 202537.366,29
Dividends received1.646,83
Total liquidity reserve 31.03.202539.015,12

The personal dividend yield beträgt aktuell 2.6 percent. As a reminder of the calculation method: only the dividends actually received are divided by the total capital invested. If I adjust this effect with the dividend payments of the past twelve months (i.e. an annualized view of all values regardless of the time of purchase), I arrive at a personal net distribution yield of 2.8 percent.

In the 1st quarter of 2025, the portfolio recorded a return gain of 0.3 percent. Here I consider the Total Returni.e. (un)realized capital gains and dividends received are added together.
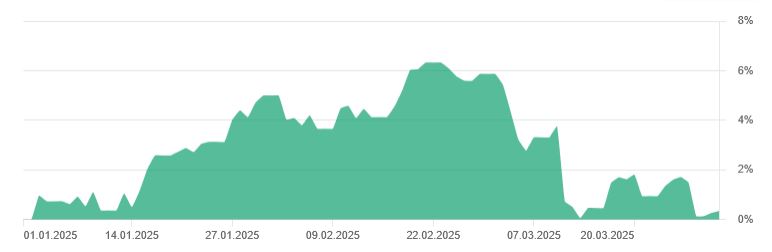
A line chart shows the data fluctuations from January to March 2025, with a peak at the end of February and a decline until mid-March. The Y-axis ranges from 0 % to 8 %.
Performance in the 1st quarter of 2025 (source: parqet)

At first glance, the result may admittedly seem disappointing. If you compare the quarterly return with the performance of the US benchmark index S&P 500 or FTSE All-World Index, the defensive nature of the DGI model portfolio becomes clear. Furthermore, the short period of time since the portfolio was launched at the end of March 2024 does not yet provide any significant insight into the performance of the portfolio for this review. The individual stocks in the portfolio should be able to develop over the long term of ten years. We will therefore move on to the next flight level and the individual stocks.
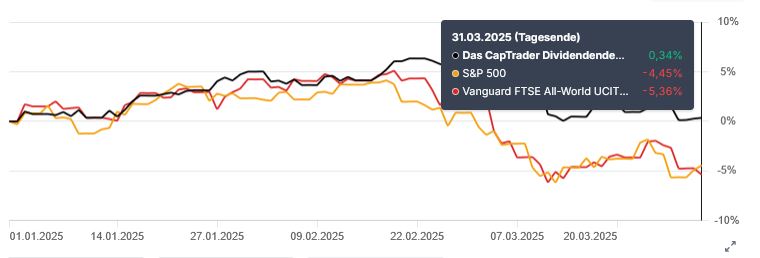
Line chart showing the performance of three indices from January to March 2025. The CapTrader dividend strategy rises slightly, while the S&P 500 and Vanguard FTSE All-World UCITS fall.
The performance in Q1 2025 compared to the S&P500 & FTSE All-World (source: parqet)

Deep-dive single stocks

At the end of March, a total of 23 Assets in the custody accountwhereby these are exclusively individual values. The following First purchases 2025 in chronological order.

Purchase dateCompany (Ticker)Total investment in €Quantity
09.01.2025Roper Technologies (ROP)1.977,844
06.02.2025Comcast (CMCSA)1.634,5450

Roper Technologies is a US conglomerate that has increasingly transformed itself into a technology company specializing in industrial applications in recent years. Roper Technologies develops software solutions for various industries, including healthcare, education and public administration. This software helps companies to manage their daily operations in process control and optimization as well as upstream data analysis.

As a replacement for the Canadian telco BCE, I went with Comcast a leading global media and technology company. The US group offers a wide range of services, including cable TV, Internet and telephone/mobile services via the Xfinity brand. Comcast is the largest provider of Internet services for private households in the USA and is one of the largest cable TV companies in the world. The company divides its business model into different segments: Cable Services, Media & Entertainment and Communications. Comcast owns NBCUniversal, which produces and operates movies, television programs and theme parks. Its well-known brands include NBC, Telemundo and Universal Pictures.

To complete the list, here is the list with a total of two additional purchases in the first quartersorted by date of purchase:

Purchase dateCompany (Ticker)Total investment in €Quantity
06.01.2025PepsiCo (PEP)1.405,9110
31.03.2025Microsoft (MSFT)692,982

Below you will find the "admirable" Top performer and "unfortunate" Stragglers since the start of the DGI model portfolio, calculated in euros as the currency basis:
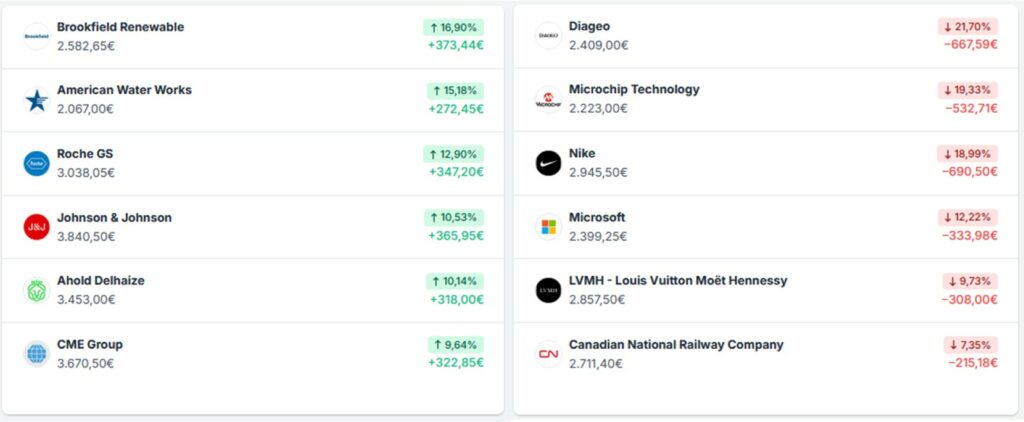
A list of company names with their financial figures. Some values are green and indicate positive changes, others are red and indicate negative changes.
Performers & laggards in the 1st quarter of 2025 (source: parqet)

Diversification & Allocation

In my investment strategy, the Portfolio diversification a proven way to adequately manage the unsystematic risks and is therefore, in addition to the position size, an integral part of my Risk management represent. Let us now take a closer look at the status of diversification according to different characteristics such as sectors, countries or company sizes.

With regard to the fundamental question of whether the current tax rate should be used as the Market value or the value of the original invested capital I have meanwhile opted for the market value. I justify this because of the small discrepancy in the final result between the two reference figures. I will continue to keep an eye on the rule that no company should account for more than five percent of the invested capital, but this does not yet play a significant role at this early stage of portfolio construction.

Let's start by looking at the composition of the portfolio on the basis of the Individual valuesthe situation is as follows.
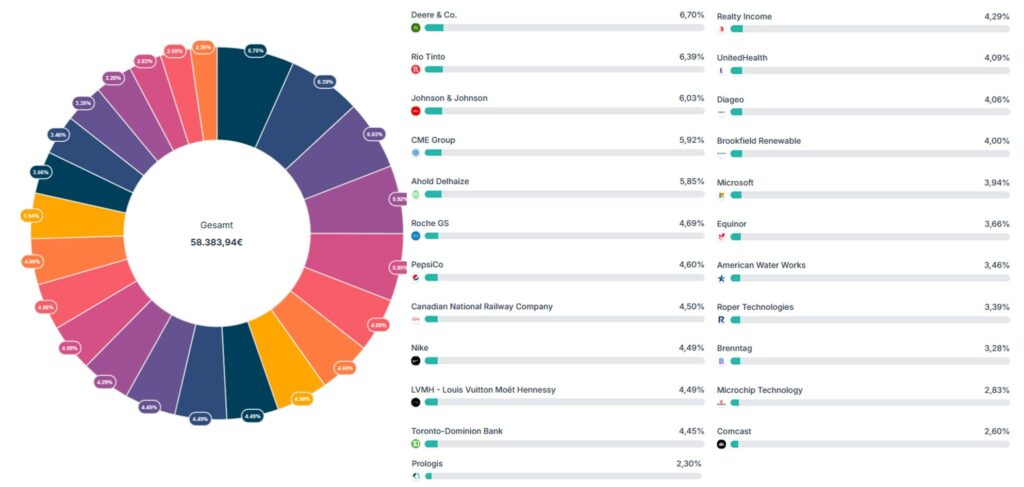
Pie chart with financial data, where the segments are labeled with company names and different percentages, as well as a detailed list of companies with the corresponding financial figures and percentages.
Position sizes of all individual stocks from the DGI model portfolio measured by market value (source: parqet)

Based on the "Global Industry Classification Standard" I invest in the eleven sectors along the various value chains of the different industries that are important in our economy. It therefore makes sense to examine the actual status compared to the target status. I am still in the middle of setting up the DGI model depot. Stubbornly sticking to the Target allocationwhich I show in the next graphic, does not seem necessary for the time being:
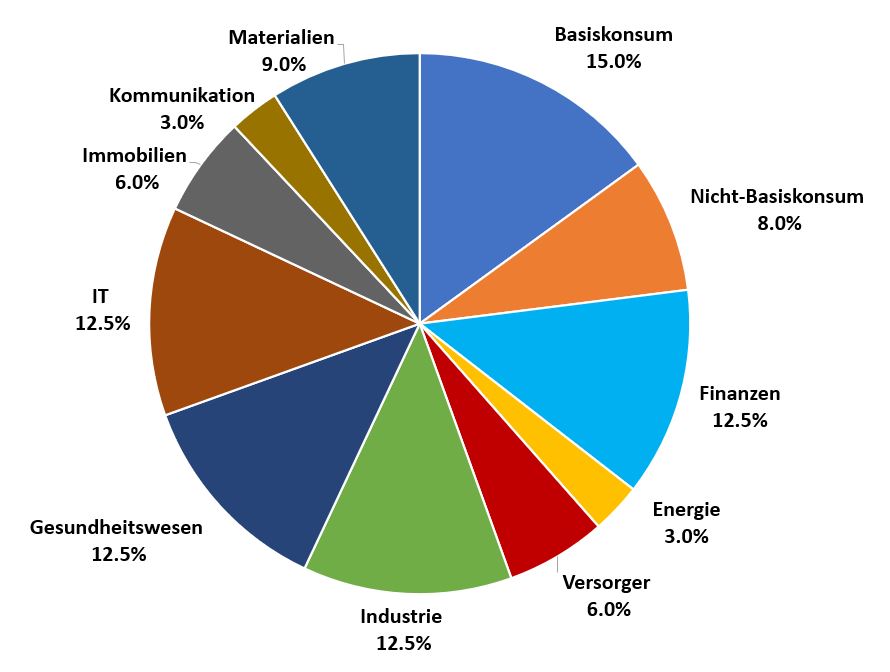
Pie chart with different sectors: Fundamentals 15 %, Non-Fundamentals 8 %, Finance 12.5 %, IT 12.5 %, Industry 12.5 %, Health 12.5 %, Materials 9 %, Real Estate 6 %, Utilities 6 %, Communications 3 %, Energy 3 %.
The target allocation at sector level for the DGI model portfolio (source: own illustration)

Finally, the following results Situation picture on sector distribution:

A colorful ring chart shows the investment distribution by sector with a total value of €58,383.94. Healthcare leads with 14.82 %, followed by consumer goods with 14.51 %.
The sector distribution in the DGI sample portfolio (source: parqet)

The Geographical spread I believe that investing across different countries and currency areas is an essential part of risk management. There are no fixed limits as to how much I want to invest in which country. My thoughts on this are quite simple: just because an organization has its corporate headquarters in country A, this does not automatically mean that this group only generates its sales from operating activities in its home country. But now we come to the Country allocation:
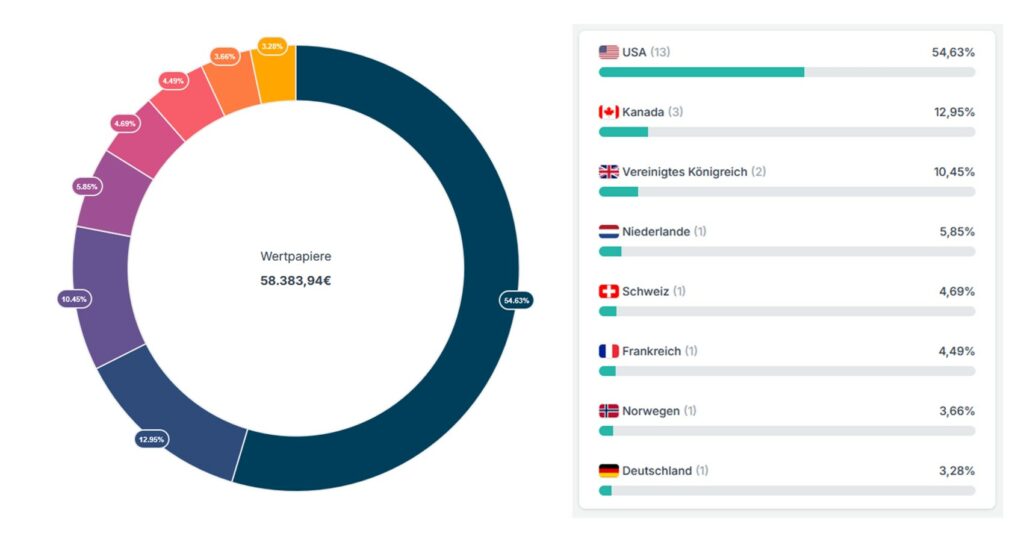
A ring chart shows the distribution of investments by country. The USA leads with 54.63 %, followed by Canada with 13.89 % and the UK with 10.45 %. The total value amounts to 58,383.94 euros.
The country distribution (source: parqet)

Outlook

Admittedly, this quarterly report is somewhat unfortunate, as the price volatility in the first few days of April and the negative impact on the DGI model portfolio cannot be ignored. This raises the immediate question of how to deal with the current imbalance on the stock market, triggered by the US trade tariffs coming into force and the announcement of counter-tariffs by various countries.

The stock market heat map shows the performance of different sectors. Large companies such as MSFT, AAPL, TSLA and NVDA are highlighted, with red indicating losses and green indicating gains.
Performance in the eleven sectors of the S&P 500 in the year to date (source: finviz)

Personally, I am skeptical that this confused situation could be fully priced in on the stock markets today, tomorrow or in the next few days. The long-term and complex consequences of stronger protectionism and new trade barriers on the global flow of goods, the multinationally integrated value/production chains based on the principles of rules-based free trade as well as the hardly assessable further macroeconomic developments in the individual national economies are all major clouds of uncertainty on the short to medium-term investment horizon, which could have a massive impact on future prices on the stock markets.

Bar chart showing the highest tariff rates in China, followed by Vietnam, Thailand and other countries. Data from Morgan Stanley.
The impact of US tariffs on China, Vietnam & Co. (Source: Bloomberg)

What does this mean for me as an investor? First of all, take a cool-headed look at your own rules and regulations and revisit the risk management set out therein. In addition to broad diversification across individual sectors, different currency areas and company sizes, money management also comes into play. An investment in the stock market is not just about analyzing companies and picking stocks. By investing in tranches, I manage my risk by means of position sizes until the time of full expansion - in contrast to a one-off investment, where each purchase can create (artificial pressure) for market timing.

The multiples have now come back noticeably from their sustained highs. Even last year, I could not complain about a flood of buy signals. This is hardly surprising when you consider the high valuation level of the S&P 500 over a long-term period of ten years.

In fact, the past quarter was the worst quarter since 2022, as the majority of market participants "suddenly" realized that the risk/return ratio was not exactly in the best shape given the political uncertainties.
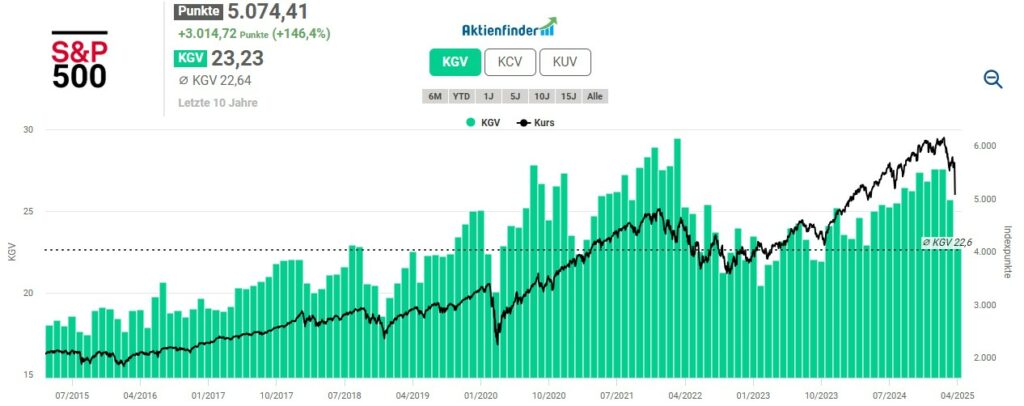
Line and bar chart with S&P 500 data from 2014 to 2024, with green bars for P/E values and a black line for price, indicating fluctuating trends in the stock index over time.
The valuation and price performance of the S&P 500 over the last ten years (source: Aktienfinder)

The tariffs now announced by US President Donald Trump are causing stock markets to question everything, including whether the ambitious valuations are still justified in an environment of stubborn inflation, increasing growth fears, geopolitical risks, falling consumer sentiment and massive debt-based economic stimulus programs.

Since bottoming out in the wake of the financial crisis in 2009, the S&P 500 has seen a total of 30 corrections of more than 5%. Ten of these were greater than 10 percent, four exceeded 20 percent and one was more than 30 percent. The future will not look exactly like the past. The point is: as a long-term investor in equities, a sharp decline remains a question of when, not if.
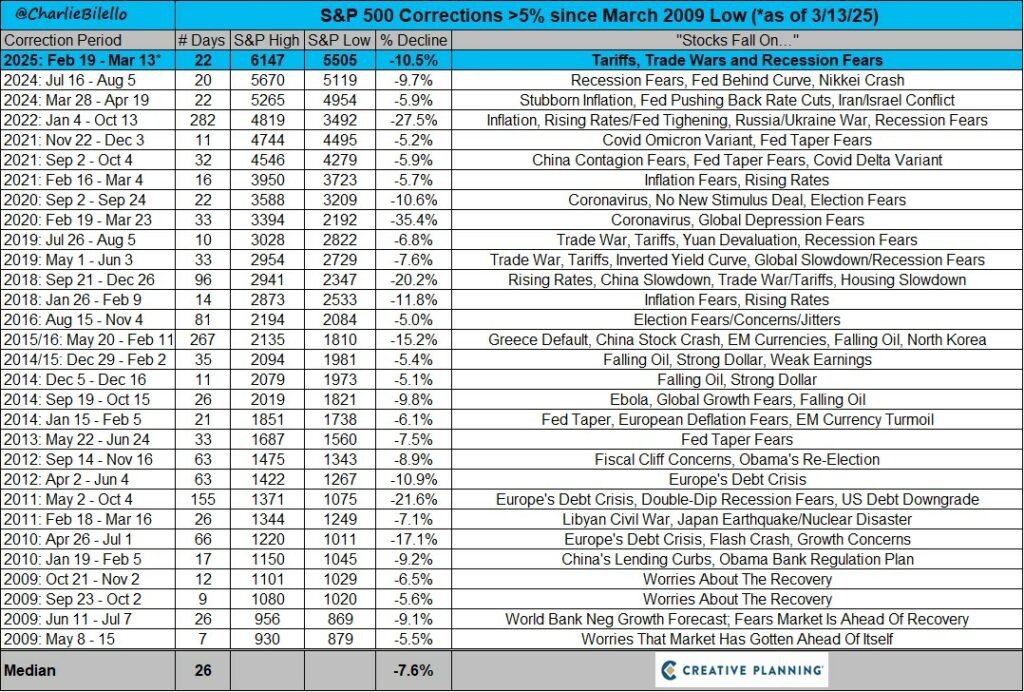
Table with corrections of the S&P 500 of over 5 % since March 2009 with date, duration, index values and reasons such as recession fears, trade wars and inflation.
Price corrections in the S&P 500 since 2009 (Source: Charlie Bilello)

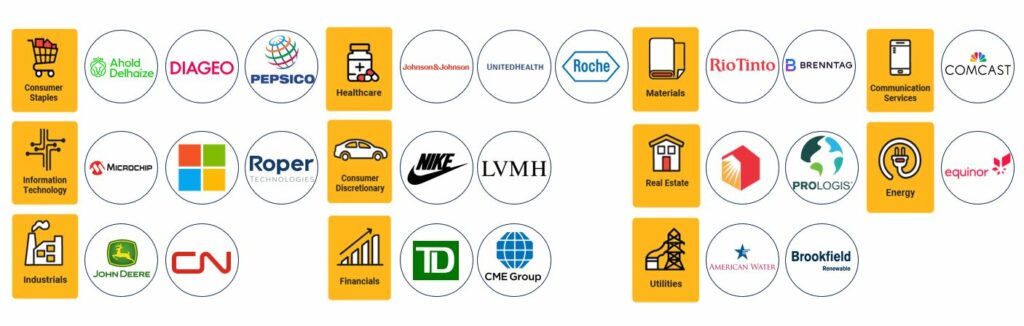
With 23 companies now in the portfolio, I am approaching the target of a maximum of 30 companies. Broken down into the eleven sectors, this results in the following distribution of companies, although this composition is not set in stone and changes may have to be made. The same question applies to all companies: at what price am I ultimately prepared to become active on the stock market?
Logos of various companies, organized by industry, including consumer goods, healthcare, materials, communication services and more, are displayed in labeled circles and squares.
Overview of individual stocks in the DGI model portfolio (source: own presentation)

The current situation does not change my credo. I am sticking to a strategic investment plan, an unwavering conviction to continue investing in companies on a regular basis and not to lose sight of the long-term perspective. The average annual return of equities as an asset class remains the trump card for sustainable wealth creation, despite the various economic crises of the last hundred years or so.
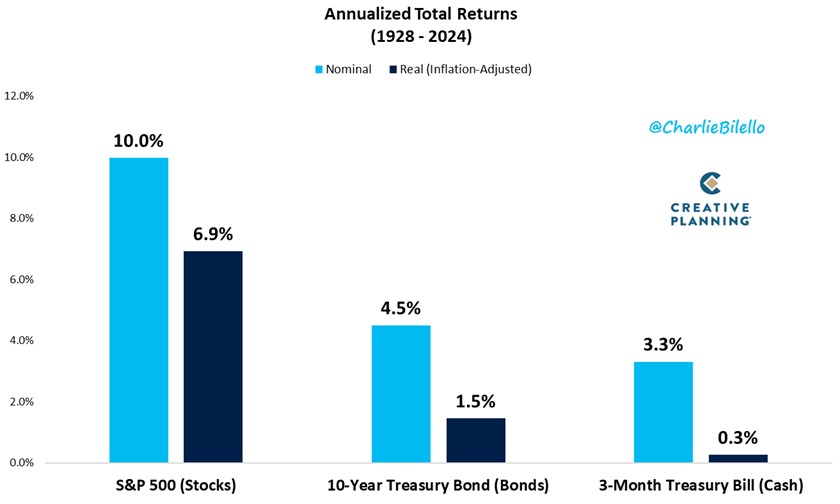
Bar chart comparing annualized total returns (1928-2024): S&P 500 (10.0 % nominal, 6.9 % real), 10-year government bonds (4.8 % nominal, 1.5 % real), 3-month government bonds (3.3 % nominal, 0.3 % real).
The average annual return of the S&P 500 since 1928 (source: Charlie Bilello)

In these turbulent times, private investors are probably doing themselves a favor by keeping their focus on the essentials despite the volatile share price performance and the accompanying "stock market noise". It is clear that the adjustment process to new economic conditions that has now been initiated will take time. Investors with an investment horizon of at least ten years or even longer need not get caught up in the hectic pace of the moment, but should keep the "big picture" in view. Investments in the stock market should be seen as an entrepreneurial investment with a long-term return opportunity. No more and no less. In the short term, the market may be overvalued or undervalued. In the long term, the market follows the real economy and the real value of a company.

"In the short run, the market is a voting machine but in the long run, it is a weighing machine." Benjamin Graham


THE NEXT WEBINARS WITH CLEMENS FAUSTENHAMMER AT CAPTRADER

Ein professionelles Porträt eines lächelnden Mannes namens Clemens Faustenhammer in dunkler Jacke und blauem Hemd vor unscharfem Hintergrund.
Clemens Faustenhammer

The private investor from Austria Clemens Faustenhammer with a focus on dividend growth stocks and total return, lives with his family near Vienna. As a graduate in business administration with a strong passion for economic history, he has held various management positions in the financial sector for over a decade. The stock market plays an important role both professionally and privately. He has been investing in the capital market since 2005, with a particular focus on individual stocks for the past ten years.

View all posts
Mandatory information and disclaimer

This is a marketing communication within the meaning of Section 63 (6) of the German Securities Trading Act and does not contain investment strategy recommendations, investment recommendations or financial analyses in accordance with Section 85 of the German Securities Trading Act and Article 20 of the Market Abuse Regulation. It therefore does not fulfill the legal requirements to guarantee the objectivity of investment strategy recommendations/investment recommendations/financial analyses. CapTrader GmbH or its employees are therefore not legally prohibited from trading or providing services in the securities products mentioned therein prior to publication of the information.

Past performance, simulations or forecasts are not a reliable indicator of future performance. Mandatory information and limitation of liability for CapTrader and any third-party content providers can be found at https://www.captrader.com/marketingmitteilung/angaben
Please note that investing in financial instruments involves high risks and take note of our disclaimer and the mandatory legal information at the locations indicated.

  1. Mandatory information

Responsible: CapTrader GmbH, Elberfelder Straße 2, 40213 Düsseldorf; Commercial Register Number: HRB 86537 Düsseldorf Local Court; VAT ID DE323771603; Managing Directors Andreas Weiß, Christian Weiß, Michael Heyder; Tel: +49 211-740786-00, Fax: +49 211-740786-90.

Zuständige Aufsichtsbehörde: Bundesanstalt für Finanzdienstleistungsaufsicht, Graurheindorfer Straße 108, D – 53117 Bonn und Marie-Curie-Str. 24-28 D – 60439 Frankfurt am Main, Tel: 0228 4108 – 0 Fax: 0228 4108 1550 E-Mail: poststelle@bafin.de; Institutsnummer 10156708

Conflicts of interest CapTrader in marketing communications: CapTrader GmbH confirms that it does not hold any positions in the mentioned financial instruments beyond the positions mentioned in the marketing communication itself, if applicable. There are also no other conflicts of interest within the meaning of CapTrader GmbH's Financial Analysis and Marketing Communication Policy.

Conflicts of interest and mandatory disclosures by the third-party content provider for marketing communications with financial instrument recommendations: See under https://www.captrader.com/marketingmitteilung/angaben  to creators of third-party content

The copyright to the marketing communication is reserved. Reprinting and distribution is only permitted with our consent.

  1. Disclaimer

By accepting the content, the recipient accepts the binding nature of the limitation of liability.

a) Disclaimer for third-party content

CapTrader GmbH offers authors - such as editors, guest commentators, agencies and companies - the opportunity to publish comments, analyses, news and company announcements. Their opinions do not necessarily reflect the opinions and views of CapTrader GmbH and its employees. CapTrader GmbH assumes neither liability nor guarantee for this content. This applies in particular to incomplete or incorrectly reproduced reports, incorrect price information and editorial errors. Liability claims relating to material or immaterial damage caused by the use or non-use of the published information or by the use of incorrect or incomplete information are fundamentally excluded.

b) Exclusion of liability for CapTrader's own content

CapTrader has taken its own information in this marketing communication from sources believed to be reliable, but has not verified all such information itself. Accordingly, CapTrader makes no warranties or representations as to the accuracy, completeness or correctness of the information or opinions contained herein. Subsequent changes cannot be taken into account. The marketing communication does not constitute an offer or solicitation to buy shares of the issuer and is in no way a substitute for advice appropriate to the investor and the property. We cannot verify whether the information in the marketing communication is in line with your personal investment strategies and objectives. We recommend that you consult an investment advisor for advice that is appropriate to the investor and the property. The marketing communication cannot and should not replace a securities prospectus and/or expert investment advice required for an investment. It can therefore never be the sole basis for an investment decision. By accepting the marketing communication, the recipient accepts the binding nature of the above limitation of liability.

CapTrader provides the information despite careful procurement and provision only without guarantee for the correctness / completeness, timeliness or accuracy and availability of the stock exchange and economic information, prices, rates, indices, general market data, valuations, assessments and other accessible content held and displayed for retrieval. This also applies to third-party content. Historical observations and forecasts are not a reliable indicator of future developments. The facts presented in particular in connection with product information are for illustrative purposes only and do not permit any statements to be made about future profits or losses. Any conditions stated are to be understood as non-binding indications and are dependent on market developments on the day of conclusion.

CapTrader accepts no liability for any direct or indirect damage caused by and/or related to the distribution and/or use of this marketing communication.

The information, opinions and statements correspond to the status at the time of preparation of the marketing communication. They may be outdated due to future developments without the publication being changed.

CapTrader is not obliged to update, amend or supplement the information in this marketing communication if a circumstance mentioned in this publication or a statement, estimate or forecast contained therein changes or becomes inaccurate. The presentation of the performance of financial instruments over previous periods does not provide a reliable indication of their future performance. No guarantee can therefore be given for the future price, value or income of any financial instrument mentioned in this publication.

Despite careful control of the content, we assume no liability for the content of external links. The operators of the linked pages are solely responsible for their content.

Distribution: This publication may only be distributed in accordance with the laws of the respective countries, and persons in possession of this publication should inform themselves about the applicable local regulations. The information contained herein is not intended for natural or legal persons who, due to their place of residence or business, are subject to a foreign legal system that imposes restrictions on the distribution of such information. The contents are therefore exclusively in German. In particular, this publication contains neither an offer nor an invitation to purchase securities to citizens of the USA, Great Britain and Australia.

Taxes: The tax treatment of financial instruments depends on the personal circumstances of the respective investor and may be subject to future changes, which may also have a retroactive effect.

Historical observations and forecasts are not a reliable indicator of future developments. The facts presented in particular in connection with product information are for illustrative purposes only and do not permit any statements to be made about future profits or losses. Any conditions stated are to be understood as non-binding indications and are dependent on market developments on the day of conclusion.

CapTrader accepts no liability for direct or indirect damage caused by and/or in connection with the distribution and/or use.

The information, opinions and statements correspond to the status at the time of preparation of the marketing communication. They may be outdated due to future developments without the publication being changed.

CapTrader is not obliged to update, amend or supplement the information if a circumstance mentioned in this publication or a statement, estimate or forecast contained therein changes or becomes inaccurate. The presentation of the performance of financial instruments over previous periods does not provide a reliable indication of their future performance. No guarantee can therefore be given for the future price, value or income of any financial instrument mentioned in this publication.

Despite careful control of the content, we assume no liability for the content of external links. The operators of the linked pages are solely responsible for their content.

Distribution: This publication may only be distributed in accordance with the laws of the respective countries, and persons in possession of this publication should inform themselves about the applicable local regulations. The information contained herein is not intended for natural or legal persons who, due to their place of residence or business, are subject to a foreign legal system that imposes restrictions on the distribution of such information. The contents are therefore exclusively in German. In particular, this publication contains neither an offer nor an invitation to purchase securities to citizens of the USA, Great Britain and Australia.

Taxes: The tax treatment of financial instruments depends on the personal circumstances of the respective investor and may be subject to future changes, which may also have a retroactive effect.

Email:

info@captrader.com

Send e-mail

Phone:

Hotline (Germany)
0800-8723370

Hotline (International)
00800-08723370

Further contact options