


One worrying political headline follows the next. One of the best-known financial market proverbs about the short legs of political stock markets may have always been true in essence from a long-term perspective. In this review of the DGI model portfolio, I provide a transparent insight into the performance of the individual stocks in the portfolio in the first quarter of 2025, calculate the total return and take a look at the performers and laggards in the portfolio.
Facts and figures for Q1 2025
Let's start by looking at the overall portfolio level before I turn my attention to the individual stocks in the next chapter. The DGI model portfolio was filled with a starting capital of 100.000 Euro. As of 31.03.2025, approx. 62,600 Euro invested.
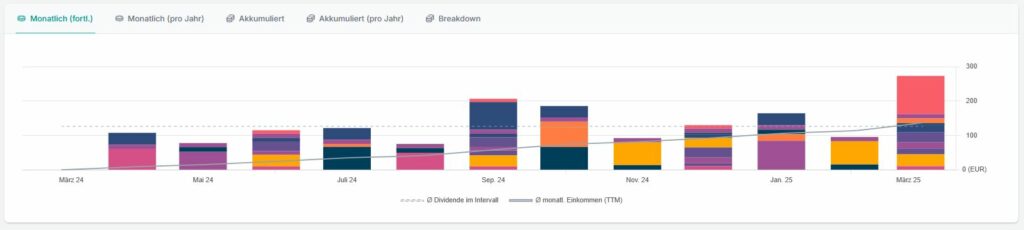
The next chart shows the positive development of the dividend ladder. Since the portfolio was launched, the companies have paid me a total of around 1,650 Euro to my cash account.
Taking all investments into account, I expect a Liquidity reserve from 39,000 euros into the second quarter of 2025. Unrealized gains amount to slightly more 500 Euro. Here is a brief summary of all relevant depot components:
| Start-up capital 22.03.2024 | 100.000,00 |
| Invested capital | 62.633,71 |
| Unrealized capital gains | 513,93 |
| Terminal value 31.03.2025 | 63.147,64 |
| Free start-up capital at the end of Q1 2025 | 37.366,29 |
| Dividends received | 1.646,83 |
| Total liquidity reserve 31.03.2025 | 39.015,12 |
The personal dividend yield beträgt aktuell 2.6 percent. As a reminder of the calculation method: only the dividends actually received are divided by the total capital invested. If I adjust this effect with the dividend payments of the past twelve months (i.e. an annualized view of all values regardless of the time of purchase), I arrive at a personal net distribution yield of 2.8 percent.
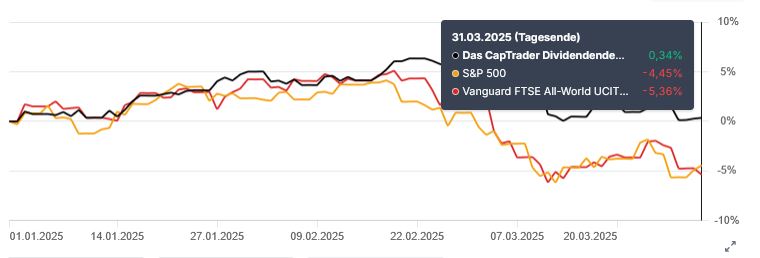
In the 1st quarter of 2025, the portfolio recorded a return gain of 0.3 percent. Here I consider the Total Returni.e. (un)realized capital gains and dividends received are added together.
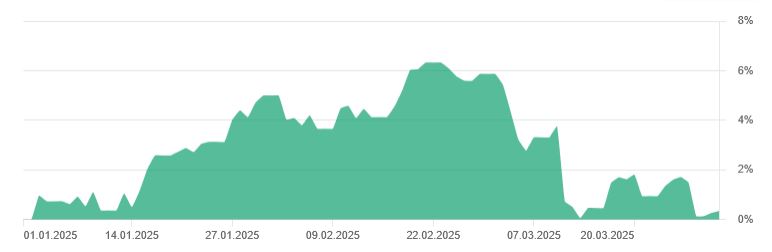
At first glance, the result may admittedly seem disappointing. If you compare the quarterly return with the performance of the US benchmark index S&P 500 or FTSE All-World Index, the defensive nature of the DGI model portfolio becomes clear. Furthermore, the short period of time since the portfolio was launched at the end of March 2024 does not yet provide any significant insight into the performance of the portfolio for this review. The individual stocks in the portfolio should be able to develop over the long term of ten years. We will therefore move on to the next flight level and the individual stocks.
Deep-dive single stocks
At the end of March, a total of 23 Assets in the custody accountwhereby these are exclusively individual values. The following First purchases 2025 in chronological order.
| Purchase date | Company (Ticker) | Total investment in € | Quantity |
|---|---|---|---|
| 09.01.2025 | Roper Technologies (ROP) | 1.977,84 | 4 |
| 06.02.2025 | Comcast (CMCSA) | 1.634,54 | 50 |
Roper Technologies is a US conglomerate that has increasingly transformed itself into a technology company specializing in industrial applications in recent years. Roper Technologies develops software solutions for various industries, including healthcare, education and public administration. This software helps companies to manage their daily operations in process control and optimization as well as upstream data analysis.
As a replacement for the Canadian telco BCE, I went with Comcast a leading global media and technology company. The US group offers a wide range of services, including cable TV, Internet and telephone/mobile services via the Xfinity brand. Comcast is the largest provider of Internet services for private households in the USA and is one of the largest cable TV companies in the world. The company divides its business model into different segments: Cable Services, Media & Entertainment and Communications. Comcast owns NBCUniversal, which produces and operates movies, television programs and theme parks. Its well-known brands include NBC, Telemundo and Universal Pictures.
To complete the list, here is the list with a total of two additional purchases in the first quartersorted by date of purchase:
| Purchase date | Company (Ticker) | Total investment in € | Quantity |
|---|---|---|---|
| 06.01.2025 | PepsiCo (PEP) | 1.405,91 | 10 |
| 31.03.2025 | Microsoft (MSFT) | 692,98 | 2 |
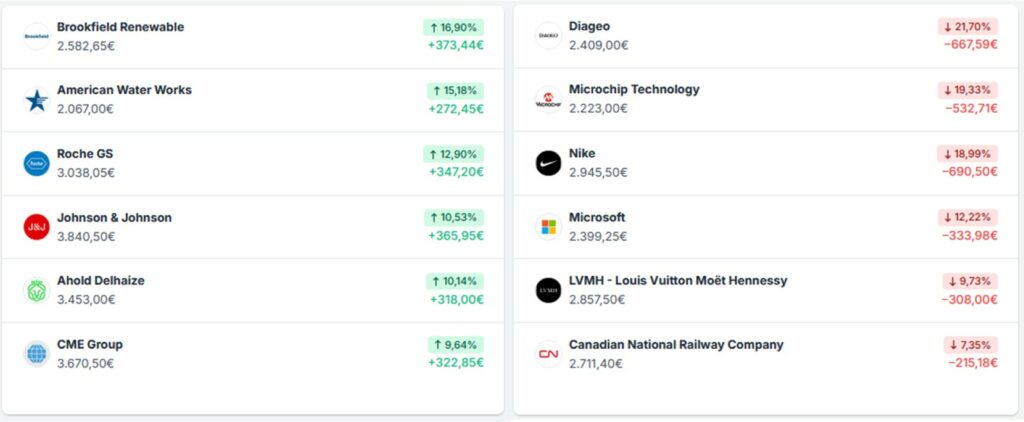
Below you will find the "admirable" Top performer and "unfortunate" Stragglers since the start of the DGI model portfolio, calculated in euros as the currency basis:
Diversification & Allocation
In my investment strategy, the Portfolio diversification a proven way to adequately manage the unsystematic risks and is therefore, in addition to the position size, an integral part of my Risk management represent. Let us now take a closer look at the status of diversification according to different characteristics such as sectors, countries or company sizes.
With regard to the fundamental question of whether the current tax rate should be used as the Market value or the value of the original invested capital I have meanwhile opted for the market value. I justify this because of the small discrepancy in the final result between the two reference figures. I will continue to keep an eye on the rule that no company should account for more than five percent of the invested capital, but this does not yet play a significant role at this early stage of portfolio construction.
Let's start by looking at the composition of the portfolio on the basis of the Individual valuesthe situation is as follows.
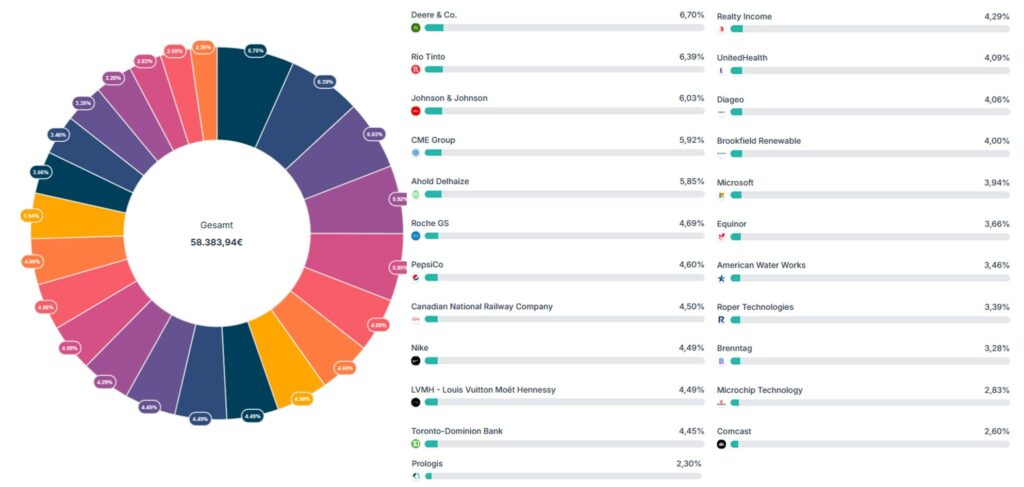
Based on the "Global Industry Classification Standard" I invest in the eleven sectors along the various value chains of the different industries that are important in our economy. It therefore makes sense to examine the actual status compared to the target status. I am still in the middle of setting up the DGI model depot. Stubbornly sticking to the Target allocationwhich I show in the next graphic, does not seem necessary for the time being:
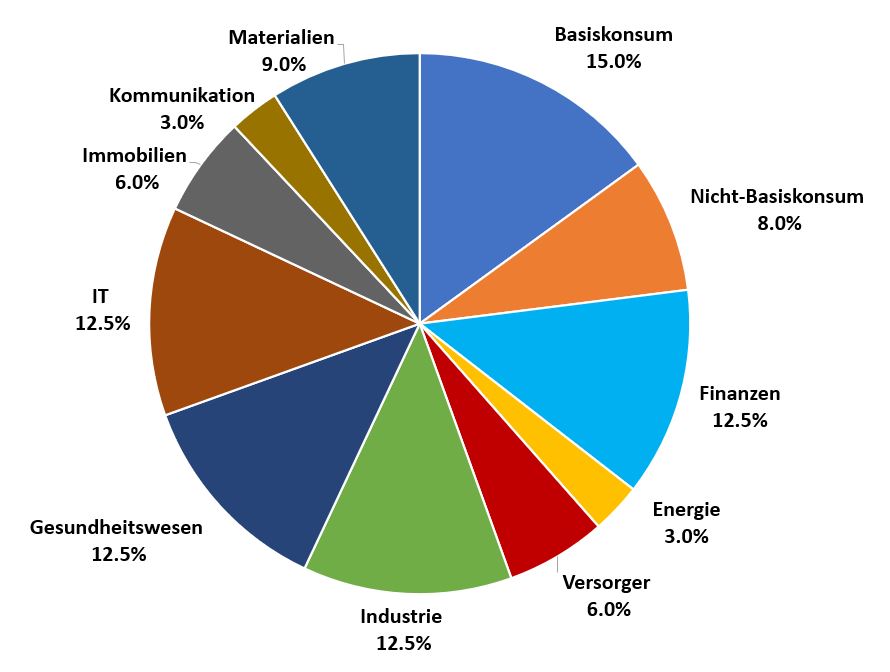
Finally, the following results Situation picture on sector distribution:

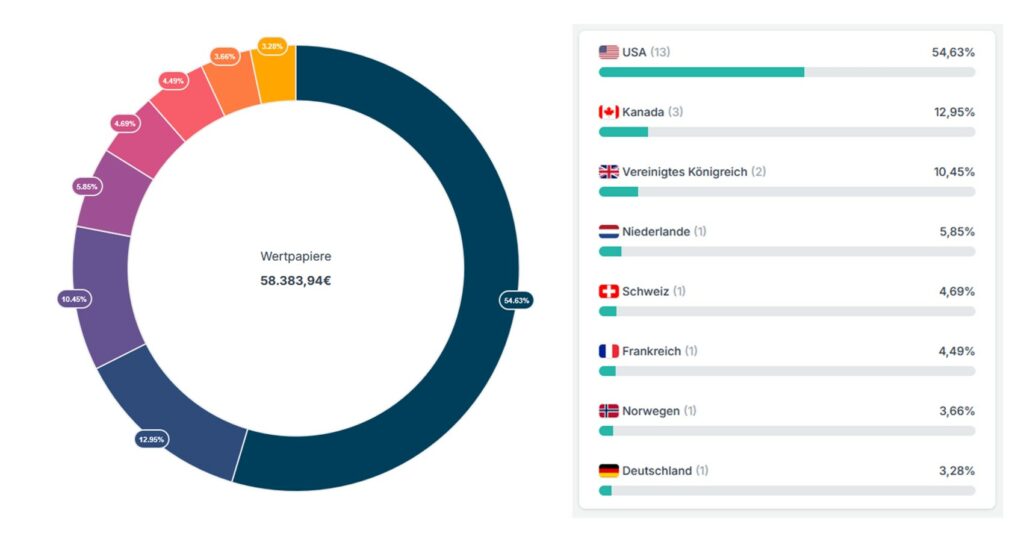
The Geographical spread I believe that investing across different countries and currency areas is an essential part of risk management. There are no fixed limits as to how much I want to invest in which country. My thoughts on this are quite simple: just because an organization has its corporate headquarters in country A, this does not automatically mean that this group only generates its sales from operating activities in its home country. But now we come to the Country allocation:
Outlook
Admittedly, this quarterly report is somewhat unfortunate, as the price volatility in the first few days of April and the negative impact on the DGI model portfolio cannot be ignored. This raises the immediate question of how to deal with the current imbalance on the stock market, triggered by the US trade tariffs coming into force and the announcement of counter-tariffs by various countries.

Personally, I am skeptical that this confused situation could be fully priced in on the stock markets today, tomorrow or in the next few days. The long-term and complex consequences of stronger protectionism and new trade barriers on the global flow of goods, the multinationally integrated value/production chains based on the principles of rules-based free trade as well as the hardly assessable further macroeconomic developments in the individual national economies are all major clouds of uncertainty on the short to medium-term investment horizon, which could have a massive impact on future prices on the stock markets.

What does this mean for me as an investor? First of all, take a cool-headed look at your own rules and regulations and revisit the risk management set out therein. In addition to broad diversification across individual sectors, different currency areas and company sizes, money management also comes into play. An investment in the stock market is not just about analyzing companies and picking stocks. By investing in tranches, I manage my risk by means of position sizes until the time of full expansion - in contrast to a one-off investment, where each purchase can create (artificial pressure) for market timing.
The multiples have now come back noticeably from their sustained highs. Even last year, I could not complain about a flood of buy signals. This is hardly surprising when you consider the high valuation level of the S&P 500 over a long-term period of ten years.
In fact, the past quarter was the worst quarter since 2022, as the majority of market participants "suddenly" realized that the risk/return ratio was not exactly in the best shape given the political uncertainties.
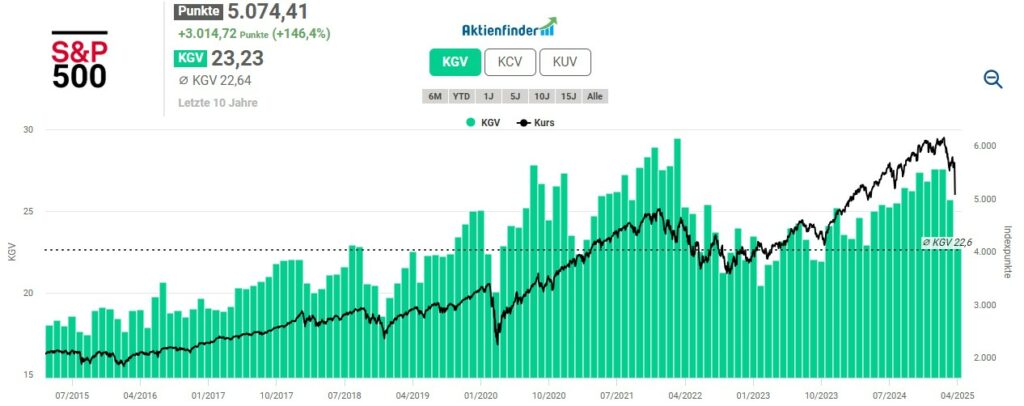
The tariffs now announced by US President Donald Trump are causing stock markets to question everything, including whether the ambitious valuations are still justified in an environment of stubborn inflation, increasing growth fears, geopolitical risks, falling consumer sentiment and massive debt-based economic stimulus programs.
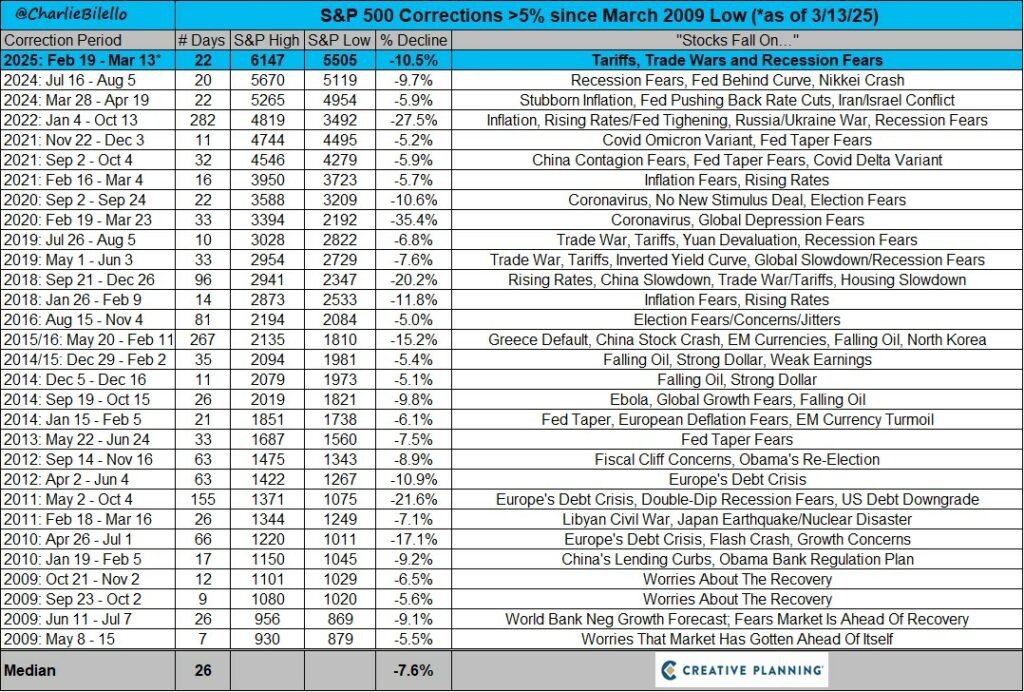
Since bottoming out in the wake of the financial crisis in 2009, the S&P 500 has seen a total of 30 corrections of more than 5%. Ten of these were greater than 10 percent, four exceeded 20 percent and one was more than 30 percent. The future will not look exactly like the past. The point is: as a long-term investor in equities, a sharp decline remains a question of when, not if.
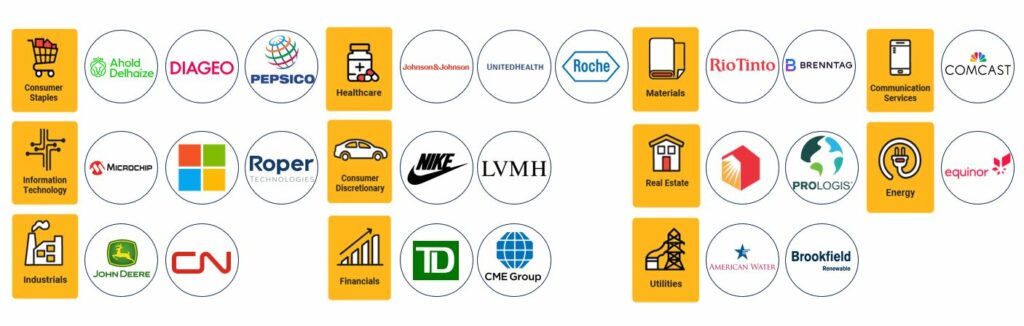
With 23 companies now in the portfolio, I am approaching the target of a maximum of 30 companies. Broken down into the eleven sectors, this results in the following distribution of companies, although this composition is not set in stone and changes may have to be made. The same question applies to all companies: at what price am I ultimately prepared to become active on the stock market?
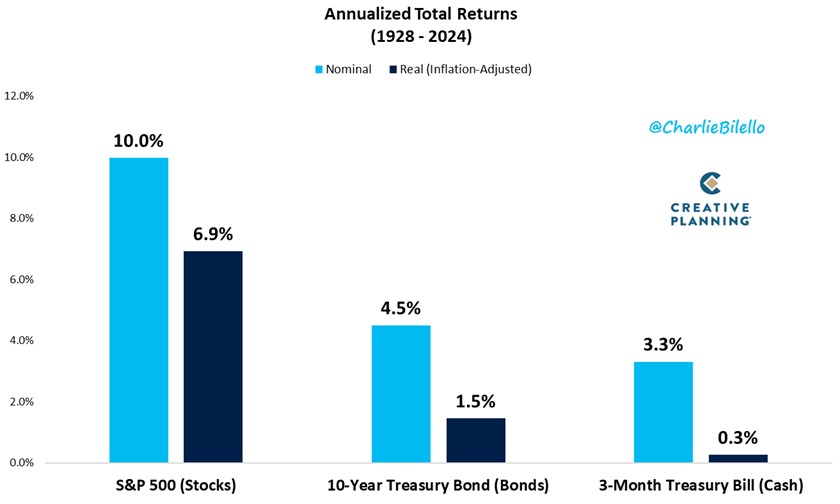
The current situation does not change my credo. I am sticking to a strategic investment plan, an unwavering conviction to continue investing in companies on a regular basis and not to lose sight of the long-term perspective. The average annual return of equities as an asset class remains the trump card for sustainable wealth creation, despite the various economic crises of the last hundred years or so.
In these turbulent times, private investors are probably doing themselves a favor by keeping their focus on the essentials despite the volatile share price performance and the accompanying "stock market noise". It is clear that the adjustment process to new economic conditions that has now been initiated will take time. Investors with an investment horizon of at least ten years or even longer need not get caught up in the hectic pace of the moment, but should keep the "big picture" in view. Investments in the stock market should be seen as an entrepreneurial investment with a long-term return opportunity. No more and no less. In the short term, the market may be overvalued or undervalued. In the long term, the market follows the real economy and the real value of a company.
"In the short run, the market is a voting machine but in the long run, it is a weighing machine." Benjamin Graham

