


In uncertain markets, many investors look for stocks that offer stability in addition to returns. Stocks that are supported by physical demand. Oil stocks seem predestined for this, as they combine global production, refining, and distribution, and often pay high, regular dividends.
At the same time, there are legitimate concerns: The energy transition, electromobility, and climate policy are changing the demand base. This article explores whether oil stocks will still make sense and be relevant in 2026.

The most important facts in brief:
- Oil stocks are shares of companies that explore, refine, and sell oil and gas, with integrated majors like Exxon, Chevron, Shell, or BP forming the classic „Big Oil“ titles.
- Your courses depend heavily on the oil price and benefit from stable demand.
- Global oil demand is unlikely to collapse by 2030, but is expected to stagnate or decline slowly.
What are oil stocks?
Oil stocks are company shares in the fossil fuel industry, meaning companies that make money from the extraction, transportation, processing, or services related to oil and gas. They are considered a classic energy sector and remain relevant despite the energy transition because large quantities of fuels, heating oil, and petrochemical precursors are still needed worldwide.
Oil stocks can be roughly divided into several segments of the value chain, each reacting differently to oil prices, demand, and politics.
- Producers (Upstream)This includes companies that search for oil and gas, develop fields, and extract crude oil or natural gas.
You are highly dependent on the oil price: When the price rises, profits typically increase, and stock prices often rise disproportionately as well. - Infrastructure / Pipelines (Midstream)These companies operate pipelines, terminals, and storage facilities, and handle the transportation and storage of oil and gas.
Your revenues are mostly based on long-term transportation and storage contracts, making cash flows often more stable and less directly dependent on oil prices. - Refineries (Downstream)Refining companies purchase crude oil and process it into products such as gasoline, diesel, or kerosene.
What's crucial for them is the so-called crack spread. That is, the margin between the price of crude oil and the prices of refined products, not the pure oil price. - Oil Tanker / ShippingThis group includes shipping companies that transport crude oil and refined products via tankers across the world's oceans.
You profit from freight rates that depend more on the supply and demand for transport capacity, routes, and geopolitics than on the oil price itself. - Oilfield ServicesOilfield service companies provide technology, equipment, and services such as drilling, fracking, maintenance, or seismic surveys for producers. Their business development primarily depends on how much producers invest (drilling activity, new projects), and therefore indirectly on oil prices and industry investment budgets.
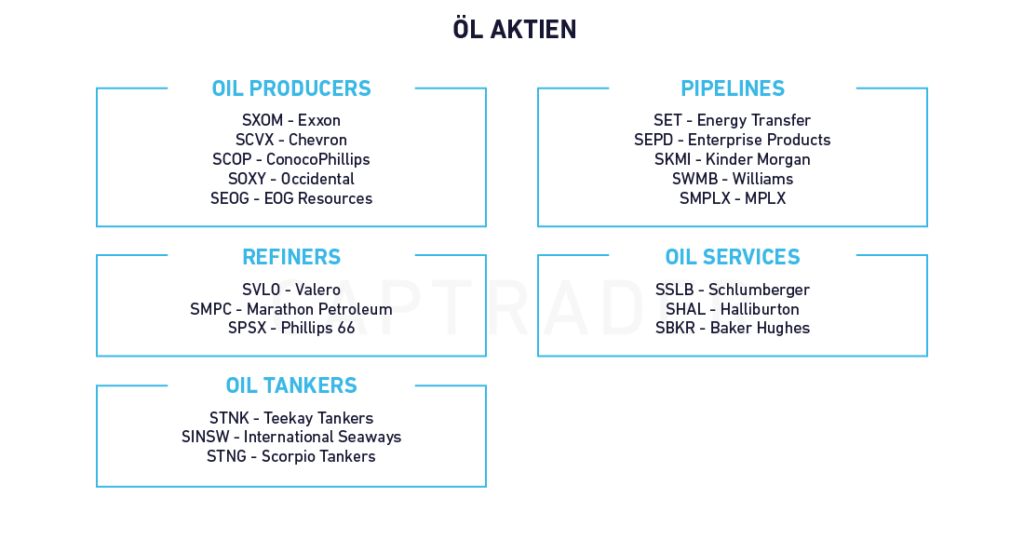
Integrated oil majors like Chevron or Shell are active in all three segments. This protects them from volatility. For example, a price drop affects upstream, but downstream benefits from cheaper raw materials.
For those who wish to familiarize themselves with stock market basics, our guide on Aktien für Anfänger an introduction.
Crude oil types: Brent and WTI
Crude oil is not all the same. Two benchmarks determine prices worldwide: Brent and West Texas Intermediate (WTI).
Both are high-quality "Light Sweet Crudes," but they differ in origin and market role. These differences directly influence oil stock performance.
West Texas Intermediate (WTI)
- It is produced in the U.S. Permian Basin and stored in Cushing, Oklahoma.
- Extremely light oil with 39.6° API and very low sulfur content (0.24 %).
- Particularly high gasoline yield and most important reference grade for the US oil market.
- account for around 30 % of global oil trading.
Good to know:
API is a unit of measurement from the American Petroleum Institute (API) that measures the density (lightness) of crude oil in comparison to water.
Brent Crude Oil
- North Sea crude (Brent, Forties, Oseberg, Ekofisk).
- Light oil with 38.3° API and moderate sulfur content (0.37 %), universally refinable.
- The most important global reference variety and dominates around 70 % of international trade (Europe, Asia, Africa).


The market potential of oil stocks
Oil stocks offer above-average market potential in 2026 despite moderate oil price forecasts, driven by stable dividend yields of 4 to 6 %, massive multi-billion dollar free cash flows, and extensive share buyback programs.
Even with an average Brent crude oil price of $58-$62/barrel, major oil companies like ExxonMobil, Chevron, and TotalEnergies generate annual free cash flows of $18-$40 billion, of which 40-60% typically flows directly to shareholders.
This is done either as a dividend or through buybacks, which stabilize the share price and increase earnings per share.
This potential arises from the vertical integration of the majors: they profit not only from rising oil prices (production) but also from falling prices (refining becomes cheaper). Established oil stocks are therefore equity stakes in companies with real assets, technology, and global diversification.
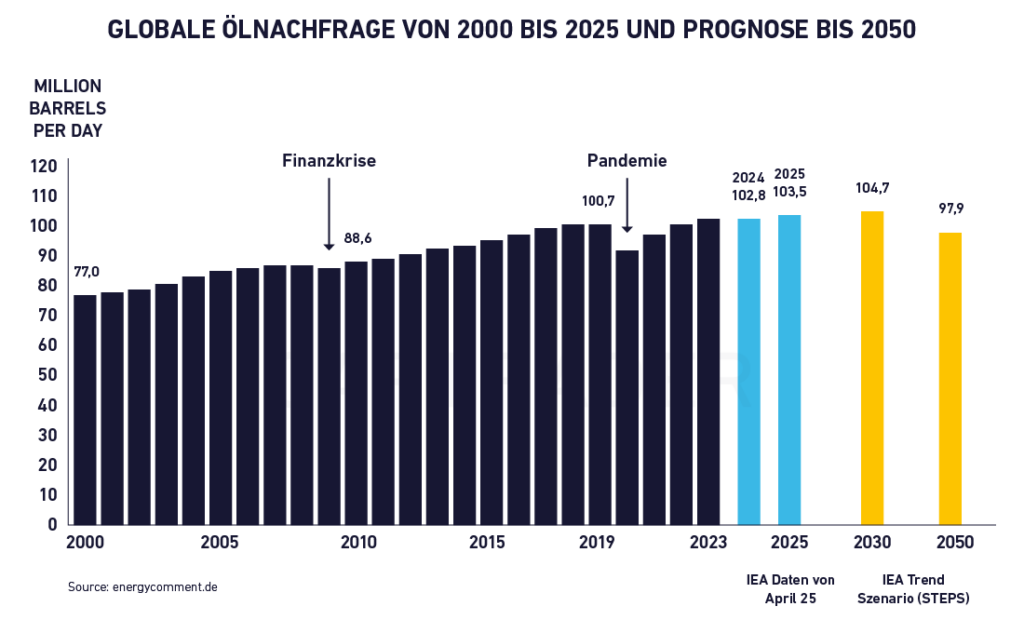
The graph shows the global oil demand from 2000 to 2025 in million barrels per day, including biofuels and synthetic oil, with downturns during the financial crisis and pandemic, as well as forecasts up to 2050.
Forecasted oil demand until 2030
Global demand for oil is not expected to plummet significantly after 2030.
Two recent Studies The International Energy Agency (IEA) and the data analysis firm Enverus provide a nuanced picture: some speak of a clear decrease, while others see more of a stagnation at a high level. What that means will become clearer below.
1. IEA: Fossil fuels are losing importance
The IEA assumes that global demand for fossil fuels will fall significantly by 2030, by about 15 %.
The reasoning: The energy transition is accelerating, primarily through the expansion of renewable energies and the shift to electric vehicles in transportation. The agency thus sees a clear end to the phase of strongly growing oil demand.
2. Enverus: Demand is stabilizing, but not disappearing
In contrast, Enverus sees no „crash“ scenario, but rather a plateauing of oil demand at a high level. Demand will no longer grow until 2030, but will only decline slowly. A sharp decrease, as forecast by the IEA, appears unrealistic.
Market data indicates that while oil will decline in importance, it will still play a major role even after 2030.
Those who want to trade stock market fluctuations intraday should first familiarize themselves intensively with suitable Day trading strategies and a consistent Money Management to deal with.
3. Why demand is likely to decrease or stagnate
Several factors suggest that global oil demand will no longer increase in the long term, but rather stagnate or decline.
- The strong Hike in der Automotive industryElectric vehicles are gradually replacing internal combustion engines and significantly reducing fuel demand in transportation.
- The Energy TransitionGovernments and companies are increasingly relying on renewable energies such as wind, solar, and green hydrogen.
- Climate protection policySubsidies and regulations promote clean energy sources and make fossil fuels unattractive in the medium to long term.
Despite these forces, the transition is not linear, as regional differences and technical challenges mean that oil will not simply disappear overnight.
4. Limits of the Energy Transition
At the same time, there are clear obstacles to a rapid, complete replacement of fossil fuels:
- Electromobility faces political hurdles such as tariffs, which primarily affect China and the export sector.
- The infrastructure for renewable energies (grids, storage, raw materials) is not yet sufficiently developed globally.
- Many countries and industries will still need a long time to switch to green alternatives.
Therefore, according to experts, it is unlikely that renewable energies will be able to cover the entire global energy demand by the end of the decade.
5. Bottleneck risks from oil infrastructure
Oil companies have neglected investments in exploration and infrastructure, which could lead to shortages as demand increases.
The industry invests only $600 billion to $700 billion annually, although $1 trillion is needed to maintain capacity. This is a deficit of $300 billion to $400 billion per year.
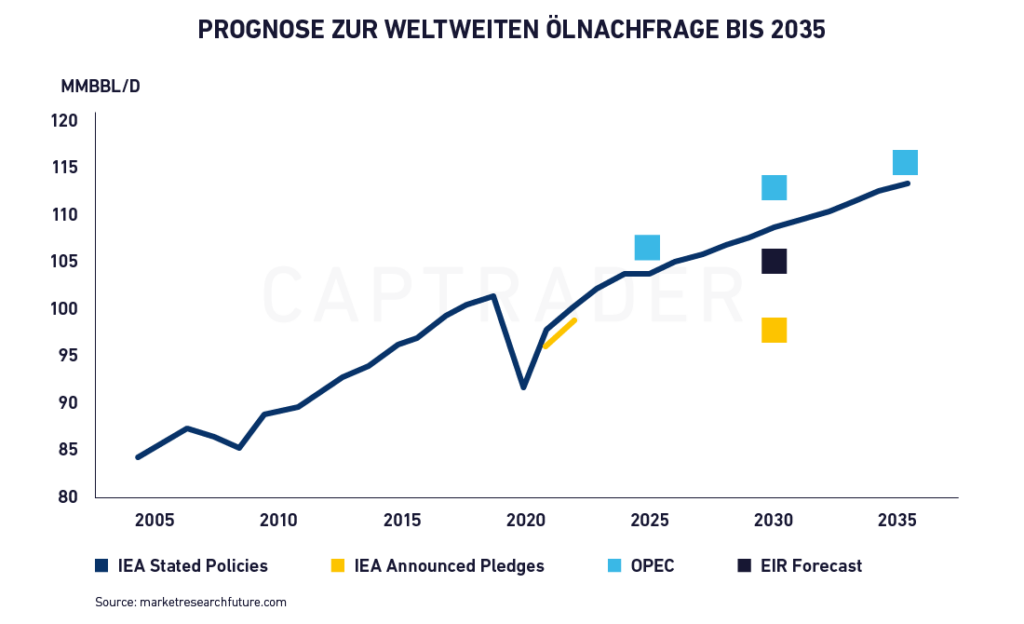
If demand rises to 105 to 110 million barrels/day by 2030, according to Experts Bottlenecks from 2026 to 2027, exacerbated by refinery and pipeline gaps.
Good to know:
There is very little chance of an „oil demand crash.“ Instead, demand will steadily increase in the future.
The four key factors influencing oil prices
Analysts expect oil prices to trend moderately in 2026, with developments stemming from several key market forces. These forces are partly contradictory, preventing the market from clearly leaning towards a strong rally or a dramatic slump.
1. Change in global demand
Global oil demand will grow only moderately in 2026. On the one hand, efficiency gains in the automotive sector, the expansion of electromobility, and structural changes in some industrialized countries are seen as dampening factors.
On the other hand, demand from sectors such as petrochemicals, aviation, and parts of industry remains an important pillar. Overall, a slow structural change is emerging, in which oil will remain in demand, but will no longer expand as strongly as in previous decades.
For investors, this means that companies with flexible refining and processing strategies, as well as integrated oil groups that both produce and process, may tend to be better positioned than pure producers.
2. High funding in North America
North America remains a key player in the global oil market. Production is at a high level, and technological advancements and efficiency gains have significantly reduced production costs.
Furthermore, the United States has expanded its role as a net exporter in recent years, further strengthening its regional importance. This ensures that additional supply volumes can reach the market more quickly and limit price increases.
This can be an advantage for investors in North American oil stocks, as lower costs and a broader export base support competitiveness. However, the sector remains heavily dependent on oil prices and regulatory frameworks.
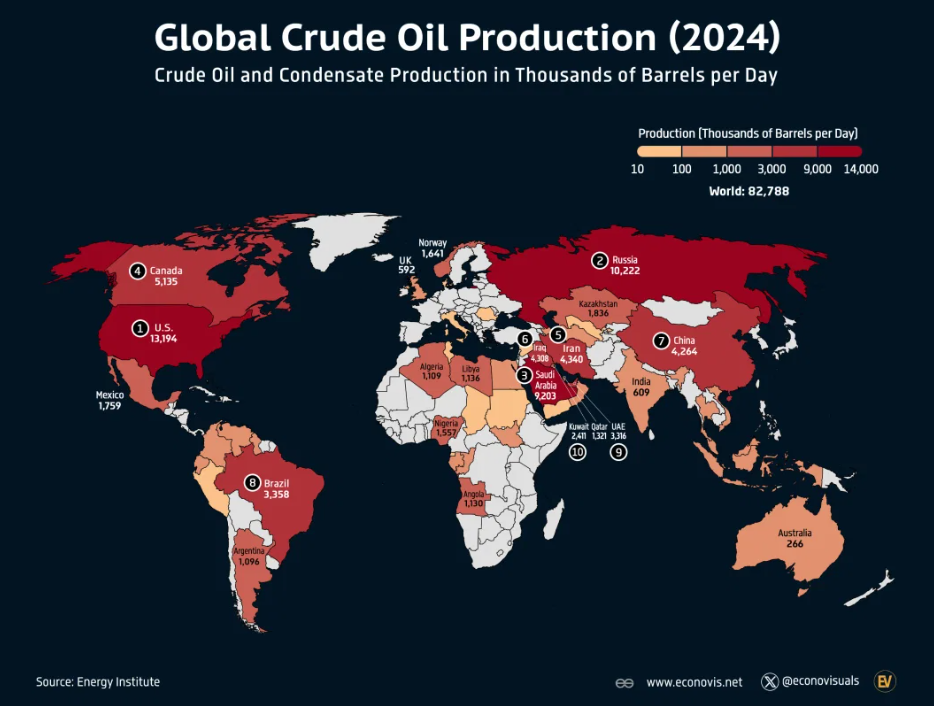
The graphic shows a world map of the major oil producers in 2024, color-coded by production volume (in thousand barrels per day) and highlighting the ten largest producing countries with their specific production figures.
3. Changed Influence of OPEC+
The OPEC+ group continues to rely on production adjustments to stabilize markets. OPEC+ is an alliance of OPEC countries with major oil producers like Russia and Saudi Arabia to jointly manage production levels and stabilize oil prices.
At the same time, it is losing market share proportionally as non-OPEC countries such as the USA, Canada, Brazil, and Guyana increase their production.
The strategy is to gradually lift supply cuts without flooding the markets with too much additional oil, thereby expecting some price support without a strong price recovery appearing likely.
For investors, this means that OPEC+ continues to play an important, but no longer dominant, role. Price dynamics are increasingly determined by an interplay of political decisions and global supply and demand factors.
4. Role of the U.S. Dollar
Since crude oil is primarily traded in US dollars, the dollar's performance directly impacts the cost for buyers using other currencies. A stronger dollar can dampen demand from other continents, while a weaker dollar can facilitate purchases.
Historically, a certain correlation between the dollar and oil prices can be observed, even if this relationship is not always linear.
For European investors, a stronger US dollar can mean that American oil stocks appear more attractive in euros, if the companies benefit from stable or rising oil prices.
These drivers can most likely ensure reliable revenue growth in the coming years. Short-term oriented investors try to exploit short-term trends with oil trading. Various [methods/tools etc.] are often used for this Swing trading strategies applied.


American oil stocks
The U.S. market offers a wide range of oil and gas stocks. From integrated majors to pure exploration and production companies, as well as service providers and pipeline operators. These stocks allow investors to invest very specifically in different parts of the value chain: from direct oil production to infrastructure and technical services.
Integrated Majors and Major Producers
| Company | ISIN | Business Model / Focus |
| ExxonMobil | US30231G1022 | Integrated oil and gas major, globally active, upstream, downstream, chemicals. |
| Chevron | US1667641005 | Integrated oil major with strong upstream and downstream business. |
| ConocoPhillips | US20825C1045 | Large independent US oil and gas producer (upstream focus). |
| Occidental Petroleum | US6745991058 | E&P company with a focus on US shale oil (Permian Basin). |
| EOG Resources | US26875P1012 | Leading US shale oil and gas producer, strong in Permian and Eagle Ford. |
Oilfield service stocks
| Company | ISIN | Business Model / Focus |
| Schlumberger | AN8068571086 | World's largest oilfield service group, drilling, measurement, and reservoir technology for producers like Exxon. |
| Halliburton | US4062161017 | US service providers for drilling, fracking, and well completion. |
| Baker Hughes | US05722G1004 | Technology and service providers (drilling technology, turbomachinery, oil and gas services). |
US Midstream Titles (Pipelines and Transport)
| Company | ISIN | Business Model / Focus |
| Kinder Morgan | US49456B1017 | One of the largest pipeline operators in North America, transporting oil and gas. |
| Enterprise Products Partners | US2937921078 | Midstream giant with pipelines, terminals, and storage capacity. |
| Energy Transfer | US29273V1008 | Broad pipeline and transportation group for oil, gas, and NGLs. |
| The Williams Companies | US9694571004 | Focus on natural gas, transportation, and infrastructure in the USA. |
The largest and best-known dividend stocks in the oil industry
The oil sector is dominated by integrated majors that cover the entire value chain: from exploration and production to refining and distribution. These high-dividend-yield oil stocks are particularly attractive to investors interested in regular payouts.
The following ranking of the top 10 oil stocks by market capitalization shows the global market leaders. All values were uniformly converted to US dollars. With high-dividend oil stocks, you can expect annual dividend yields between 4 and 6 %.
| Company | ISIN | Country | Market capitalization in US dollars | Dividend yield |
| Petrobras | US71654V4086 | Brazil | 97 | 14,28 % |
| Saudi Arabian Oil Company (Aramco) | SA14TG012N13 | Saudi-Arabien | 1.624 | 6,33 % |
| BP | GB0007980591 | UK | 98 | 6,16 % |
| TotalEnergies | FR0000120271 | France | 156 | 6,03 % |
| Equinor | NO0010096985 | Norway | 67 | 5,78 % |
| Chevron | US1667641005 | USA | 350 | 4,49 % |
| Shell | GB00BP6MXD84 | Netherlands/UK | 218 | 4,36 % |
| ExxonMobil | US30231G1022 | USA | 591 | 3,32 % |
| ConocoPhillips | US20825C1045 | USA | 129 | 3,15 % |
Before you select individual shares, you first need a securities account. How to set up a securities account step by step Open an account, you can find out in CapTrader's detailed guide.
One proven approach is the Core Satellite Strategy, where stable quality values form the core and high-growth stocks are added as satellites. Besides oil stocks, this strategy can also be applied in other sectors, such as Bank stocks, Tourism Stocks or Consumer Goods Shares be applied.
In the following section, we will introduce you to a selection of oil stocks in more detail.
ExxonMobil
Exxon Mobil Corporation is one of the world's largest companies in the petroleum industry and is engaged in the exploration and production of oil and natural gas.
In addition to manufacturing, the company is involved in the trading, transportation, and sale of crude oil, natural gas, petroleum products, petrochemicals, and other specialty products, producing and selling petrochemicals including olefins, polyolefins, aromatics, and various other petrochemicals.
| Tax year | Estimated sales (in US dollars) | Change compared to previous year |
| 2025 | 332.238 million | -4,96 % |
| 2026 | 324.023 million | -2,47 % |
| 2027 | 347.658 million | +7,29 % |
2. Chevron
The Chevron Corporation is a popular Blue chip share and is headquartered in San Ramon, California. The company was formerly known as ChevronTexaco Corporation and changed its name to Chevron Corporation in 2005.
Chevron, along with its subsidiaries, is engaged in the energy, chemicals, and petroleum business worldwide. The company operates in two segments: Upstream and Downstream. The Upstream segment is involved in the exploration, development, and production of crude oil and natural gas, as well as the processing, transportation, and storage of these raw materials.
The downstream segment deals with the refining of crude oil into petroleum products and the marketing of crude oil, refined products, and lubricants.
| Tax year | Estimated sales (in US dollars) | Change compared to previous year |
| 2025 | 189.031 million | -6,79 % |
| 2026 | 183.284 million | -3,04 % |
| 2027 | 192.173 million | +4,85 % |
Shell
Shell is a global energy and petrochemical company operating in the Integrated Gas, Upstream, Oil Products, and Chemicals segments. The company explores for and extracts crude oil, natural gas, and natural gas liquids, and markets and transports these.
Additionally, Shell operates the upstream and midstream infrastructure necessary for gas supply. The company markets and trades liquefied natural gas (LNG), electricity, and emission allowances, and markets and sells LNG as fuel for heavy-duty vehicles and ships.
| Tax year | Estimated sales (in US dollars) | Change compared to previous year |
| 2025 | 269.832 million | -5,09 % |
| 2026 | 265.264 million | -1,69 % |
| 2027 | 282.469 million | +6,49 % |
4. BP
The abbreviation “BP” stands for the former name British Petroleum and is a company active worldwide in the energy business. BP plc was founded in 1908 and is headquartered in London, United Kingdom.
In addition to oil production, the company is involved in the refining, delivery, and trading of oil products, as well as the sale of fuels to wholesale and retail customers. Furthermore, BP operates onshore and offshore wind farms, solar power plants, as well as gas stations and charging stations for electric vehicles.
| Tax year | Estimated sales (in US dollars) | Change compared to previous year |
| 2025 | 186.756 million | -1,28 % |
| 2026 | 171.417 million | -8,21 % |
| 2027 | 178.754 million | +4,28 % |
5 Saudi Arabian Oil Company (Saudi Aramco)
Saudi Aramco's IPO in December 2019 was the largest IPO of all time. The Saudi Arabian Oil Company, as the company is fully named, was founded in 1933 and is headquartered in Dhahran in the Kingdom of Saudi Arabia.
For private investors outside of Saudi Arabia, it's virtually impossible to trade Saudi Aramco shares. As one of the largest companies in the oil industry, however, Saudi Aramco could not be left out of this list.
| Tax year | Estimated sales (in US dollars) | Change compared to previous year |
| 2025 | 432.814 million | -9,91 % |
| 2026 | 406.566 million | -6,06 % |
| 2027 | 427.478 million | +5,14 % |
CapTrader can do that:
At CapTrader, the trading fees are extremely low: you can trade US shares from as little as $ 0.01 per share (order minimum $ 2.00) and German shares from as little as 0.1 % of the order volume (order minimum €2.00), options from €2.00, futures from €1.00, ETFs from €2.00 and much more!


Conclusion: Are oil stocks worth it in 2026?
In 2026, oil stocks are primarily a defensive, income-oriented position, not a classic growth investment. The major integrated oil companies benefit from moderate oil prices, stable refining and gas markets, and high cash flows, which translate into dividend yields of 3 to 6% and extensive share buybacks.
In the long term, the role of oil is limited, and therefore, high-dividend oil stocks are investing in new business models. Those who want to use oil stocks could employ them as a conscious, limited addition to a diversified portfolio, focus on solvent, vertically integrated companies, and actively include the energy transition in the risk/return assessment.
