


Looking back at the DGI sample portfolio, I provide a transparent overview of the development of individual values in the third quarter of 2026, determine the overall return and highlight the outperformers and underperformers. Additionally, I analyze the market environment and discuss the most recent changes in the portfolio.
Facts and figures for the 3rd quarter of 2026
At the beginning, I look at the total portfolio level before I dedicate myself to individual stocks in the next chapter. The DGI model portfolio was started with an initial capital of 100.000 Euro equipped. As of September 30, 2026, this includes approximately 85,500 euros, or over 85 percent of the total amount invested.
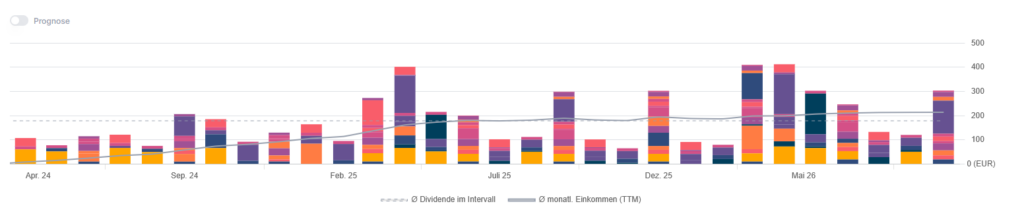
The following graph shows the long-term positive development of the dividend ladder. Since the portfolio was launched, the companies have transferred a total of over 5,500 euros to my cash account.
Taking all investments into account, I'm proceeding with a Liquidity reserve from around 22,500 euros in the fourth quarter. The unrealized gains amount to over 20,000 euros. All relevant depot components are summarized here in a table:
| Start-up capital 22.03.2024 | 100.000,00 |
| Invested capital | 85.354,16 |
| Unrealized capital gains | 20.272,87 |
| Realized profit (excluding losses) | 1.782,18 |
| Depository value 30.09.2026 | 105.627,03 |
| Free start-up capital 30.09.2026 | 14.645,84 |
| Dividends received | 5.551,71 |
| Realized profit from the exchange rate | 2.187,32 |
| Total liquidity reserve 30.09.2026 | 22.384,87 |
The current Personal dividend yield 3.1 percent. This result corresponds to a slight increase of 5 basis points compared to the last quarter. For your information, the calculation methodology: Only the dividends actually received in the last twelve months are divided by the total invested capital.
In the third quarter of 2026, the model portfolio recorded a value loss of 1.2 percent. Here I consider the Total Return, i.e., realized and unrealized profit from the share price and dividends received.
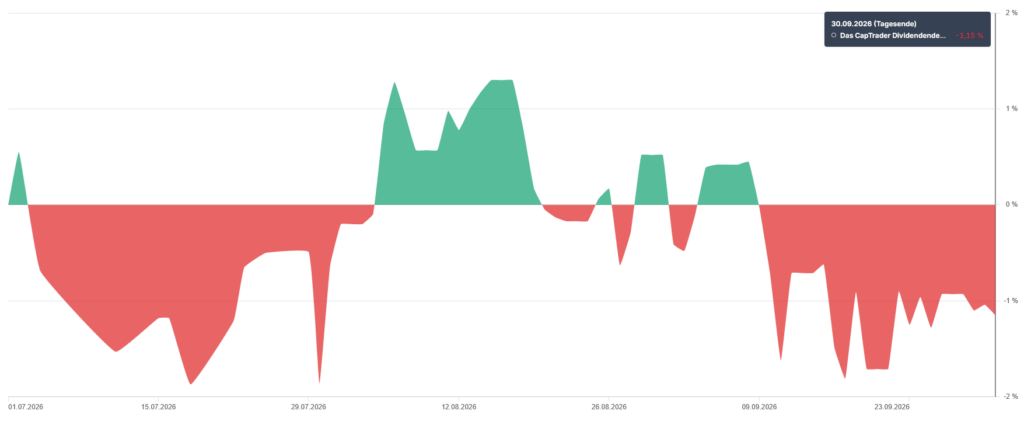
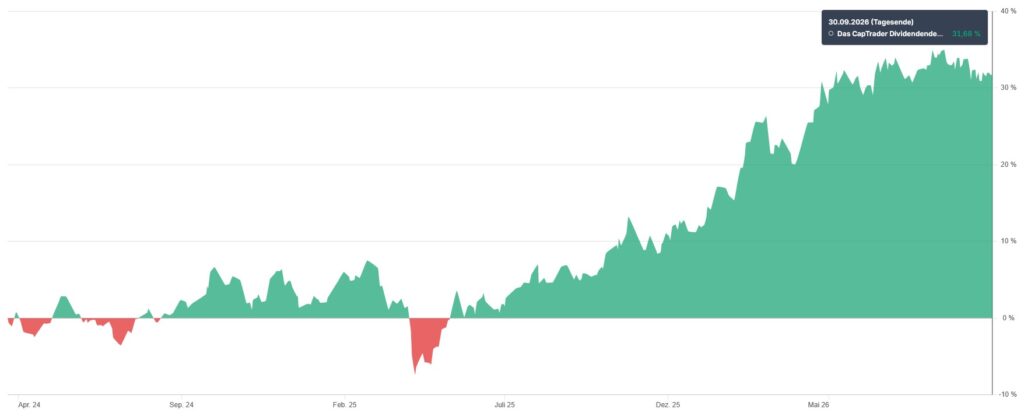
In my opinion, the relatively short period of observation – the start of the fund took place in March 2024 – does not provide too much insight into the performance of the portfolio for the sake of retrospective analysis. The goal is for the individual values to develop over an investment horizon of at least ten years. Therefore, we are moving on to the next chapter immediately and go directly to the individual values.
Deep-dive single stocks
Furthermore, there are a total of 27 assets in the sample repository, In which there are only individual values involved. In July I invested in Lam Research building a new position:
| Purchase date | Company (Ticker) | Total investment in € | Quantity |
|---|---|---|---|
| 29.07.2026 | Lam Research (LRCX) | 2.223,68 | 10 |
In return, I parted ways with Microchip Technology. The reasons for the exchange are explained further down. Of course, I plan to bring Lam Research up to a similar level.
| Sales | Company (Ticker) | Total revenue in € | Quantity |
|---|---|---|---|
| 07.08.2026 | Microchip Technology (MCHP) | 7.352,08 | 100 |
In the third quarter I three additional purchases made, which I list chronologically below:
| Purchase date | Company (Ticker) | Total investment in € | Quantity |
|---|---|---|---|
| 01.07.2026 | CME Group (CME) | 593,26 | 3 |
| 27.08.2026 | Ahold Delhaize (AD.AS) | 762,50 | 25 |
| 28.09.2026 | Brookfield Renewable (BEPC) | 615,58 | 25 |
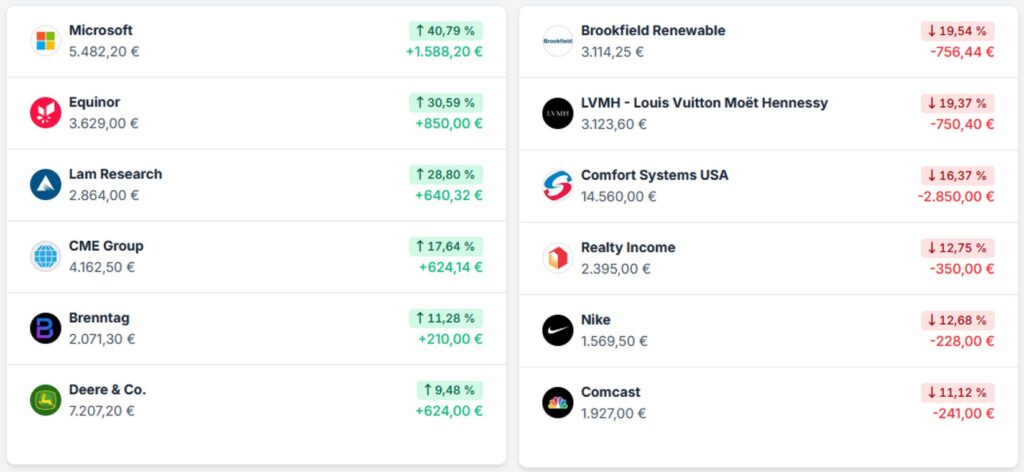
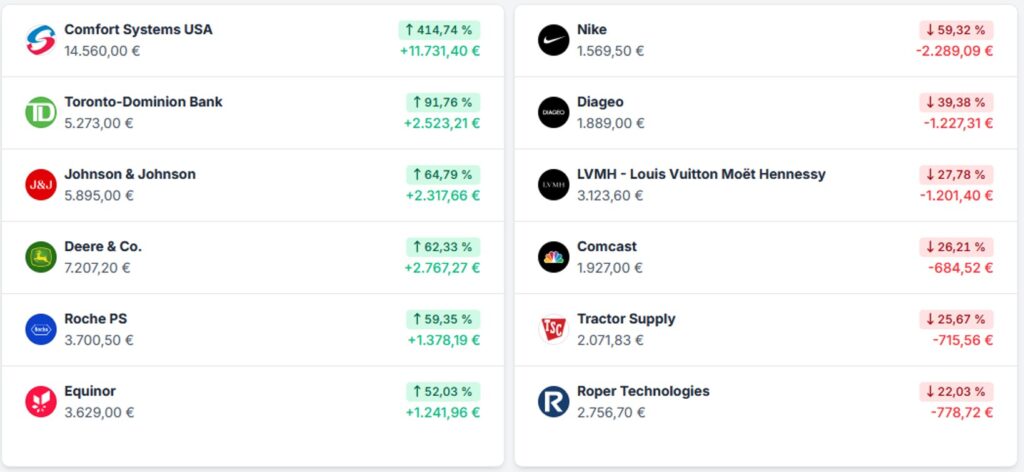
As in every quarterly report, you will find the „admirable“ below“ Top performer and "unfortunate" Stragglers in the third quarter of 2026 and since the launch of the DGI model deposit, calculated in euros as the currency basis:
Diversification & Allocation
In my investment strategy, the Portfolio diversification a tried-and-tested way to master the unsystematic risks in an adequate form, and alongside the control of the position size, it constitutes an integral part of my Risk management Now let us look at the status of diversification along various dimensions by individual values, sectors, and countries.
I pragmatically bypass the fundamental question of whether to use the current market value or the originally invested capital as the basis for calculation by showing both versions.
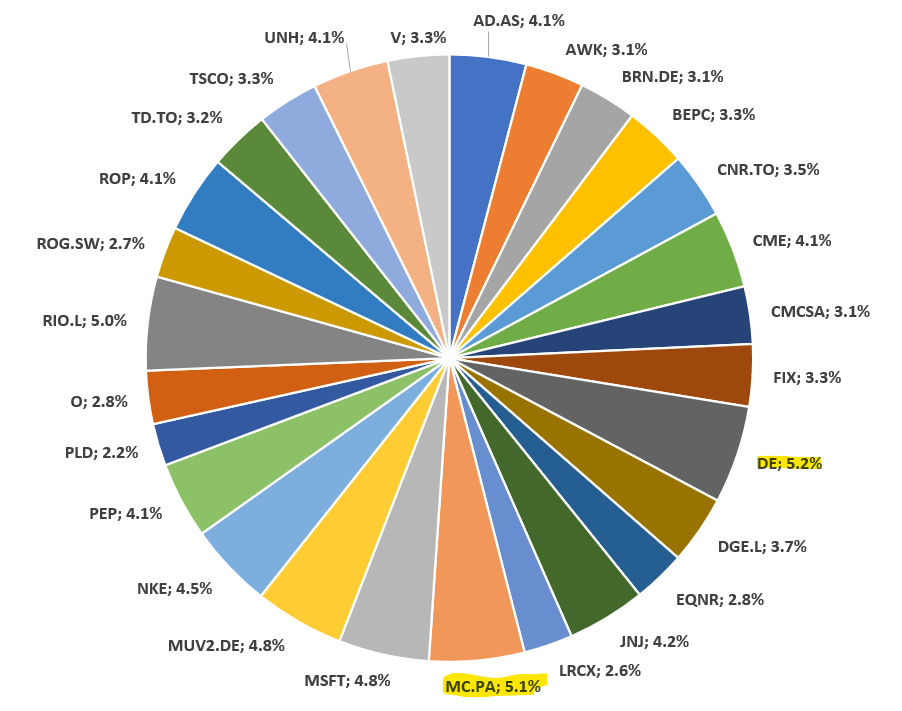
Let's first consider the composition of the portfolio based on the Individual values, Thus, the situation is as follows. I will continue to keep an eye on the rule that no company should account for more than five percent of the invested capital. At the current time, Deere and LVMH are „violating“ this own guideline; however, the overemphasis is marginal:
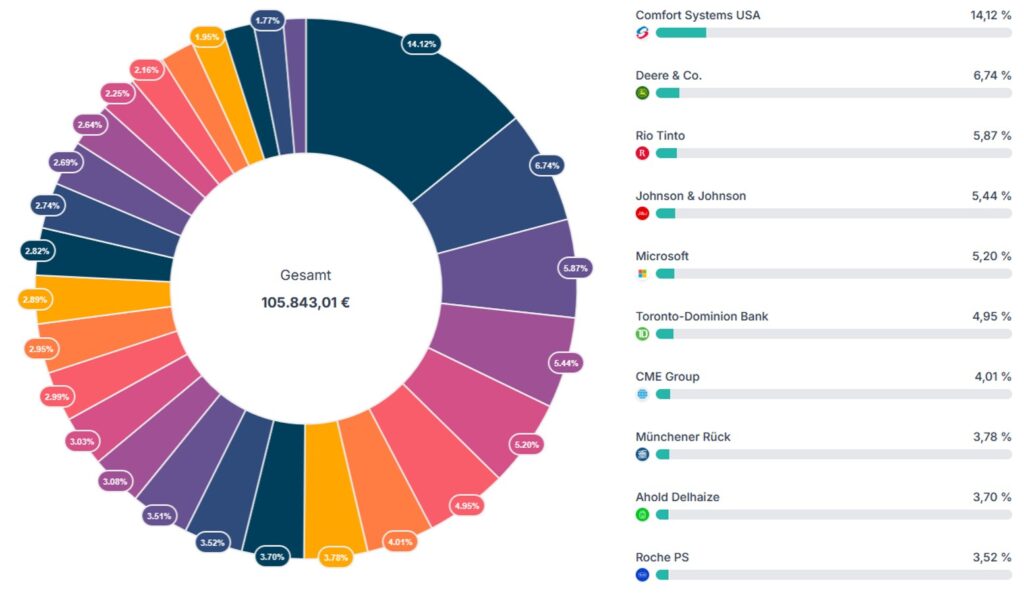
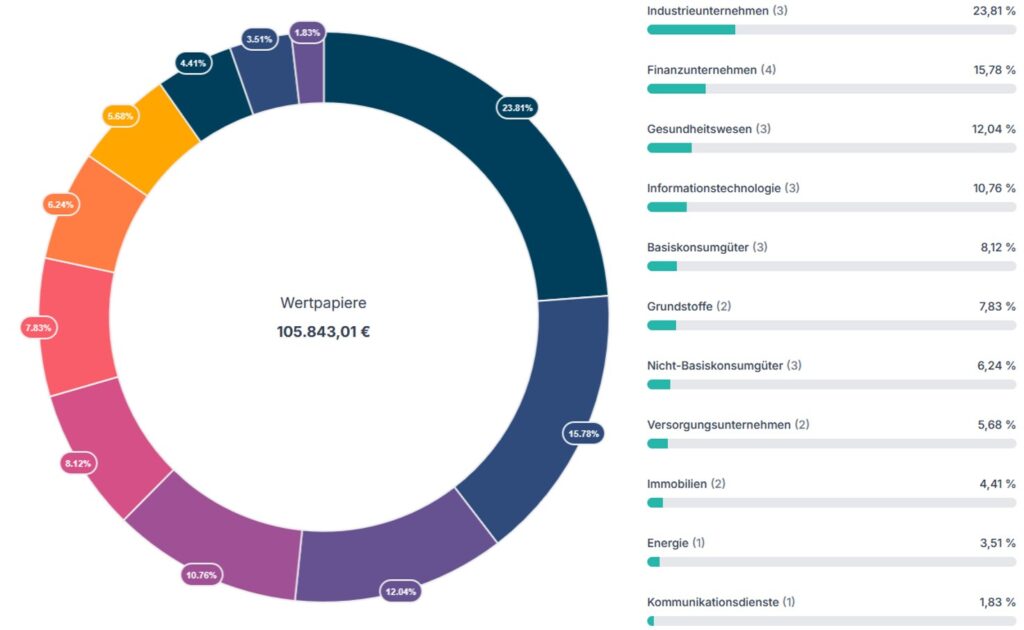
Now let’s look at the composition of the portfolio based on the current situation. Market value. At the top right of the chart are the top 10 companies.
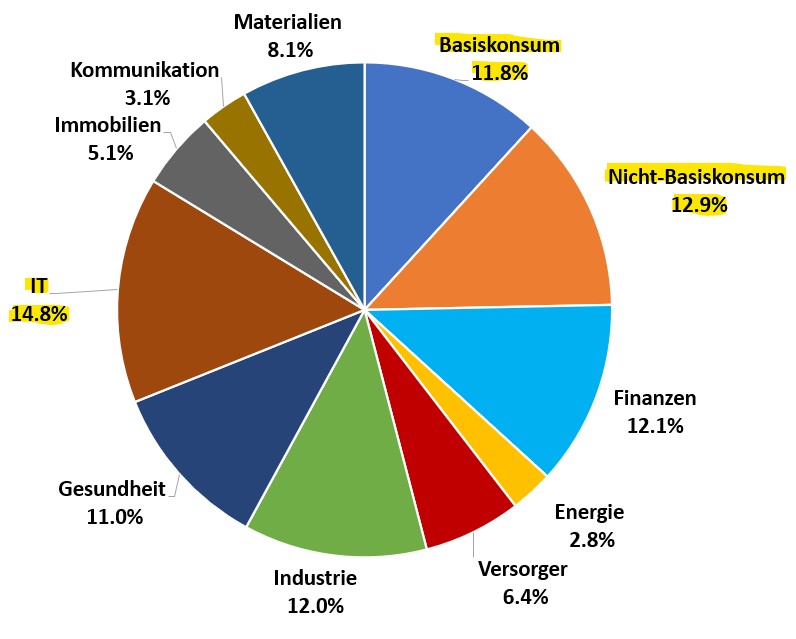
The basis for the sectoral classification is the „Global Industry Classification Standard“With its eleven sectors, which represent the most important value chains in our economies. Therefore, comparing the current and desired allocation is worthwhile. A firm adherence to the Target allocation, which I will illustrate in the next graph, does not seem necessary to me for the time being, as I am not yet fully invested:
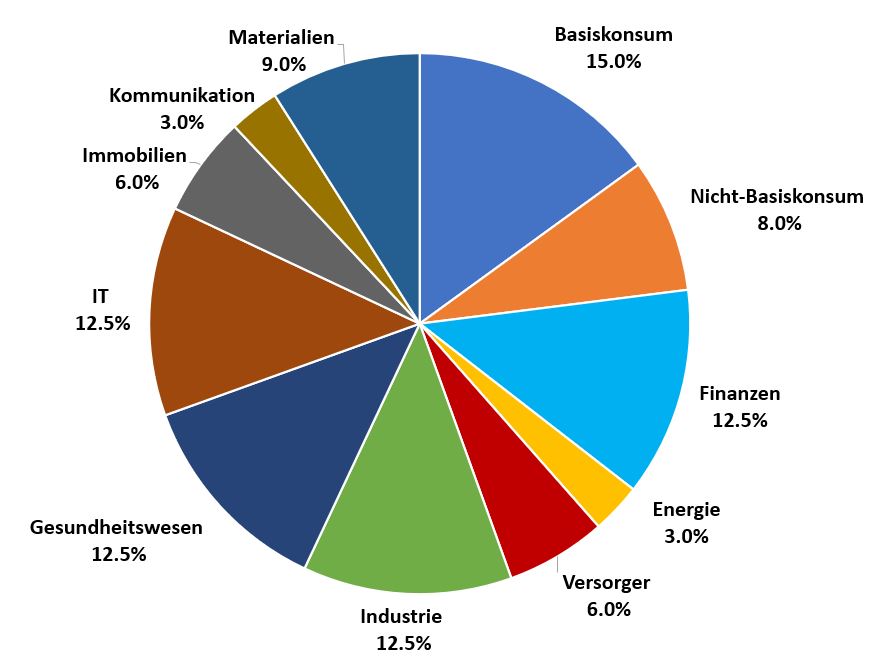
This results in the following Situation picture on sector distribution:
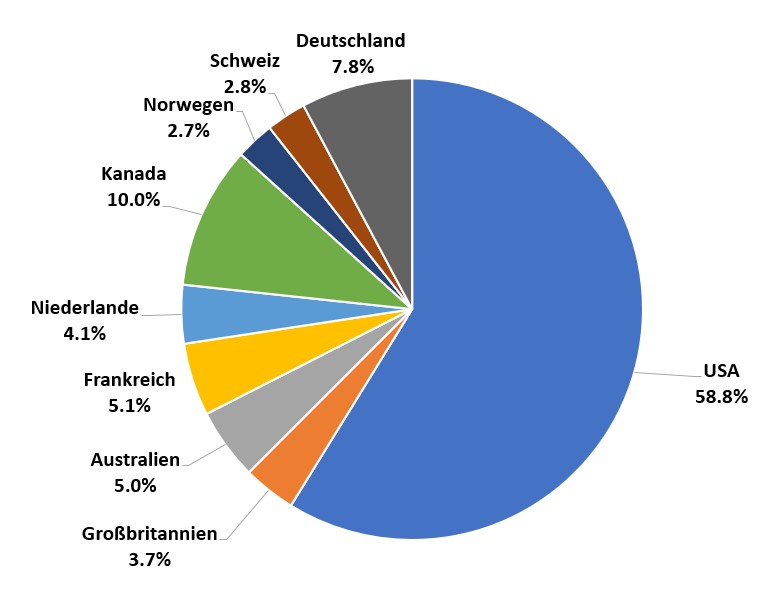
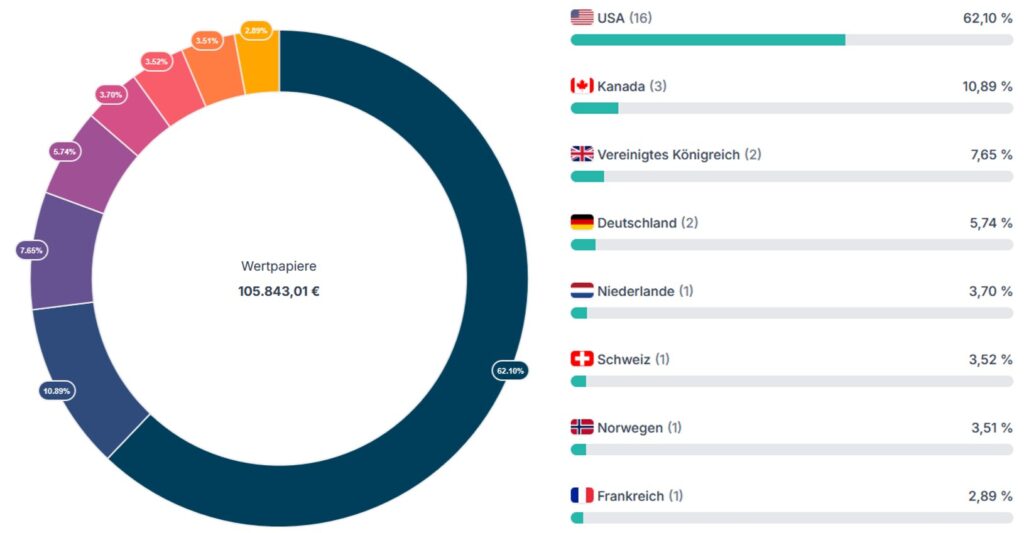
The Geographical dispersion I consider it an important component of risk management to invest across different countries and currency zones. There are no fixed limits on how much I want to invest in which country. My thoughts on this are quite simple: Just because a company like Microsoft has its corporate headquarters in the United States, it still does not generate its sales from its operational business activities exclusively in its home country. Now let’s move on to the Country allocation:
Since Parqet Rio Tinto is a British company, there is a difference in the representations between market value and the above chart.
Market environment and outlook
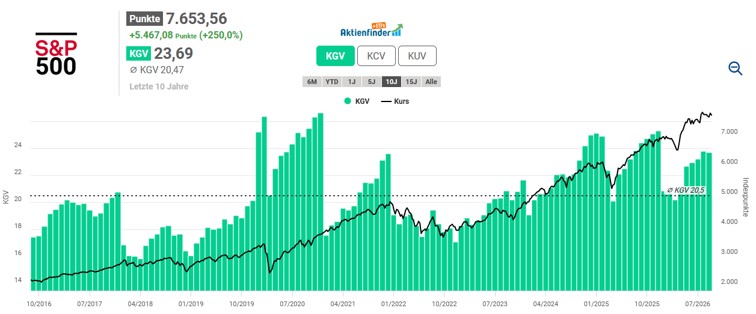
In each quarterly report, I look at the index level using the S&P 500 to get a first impression of the current valuation based on the price-earnings ratio (P/E ratio). I am aware of the legitimate objections to interpreting the P/E ratio at the index level with caution: distortions caused by outliers, disproportionate influence by heavyweights such as the big tech stocks, and changes in the index composition over the historical comparison. Never mind that. Currently, the P/E ratio is 23.7, more than three points higher than the ten-year average (20.5). This does not contradict Wilson’s finding: over the course of the year, the valuation level has indeed come back, but in historical comparison it remains high.
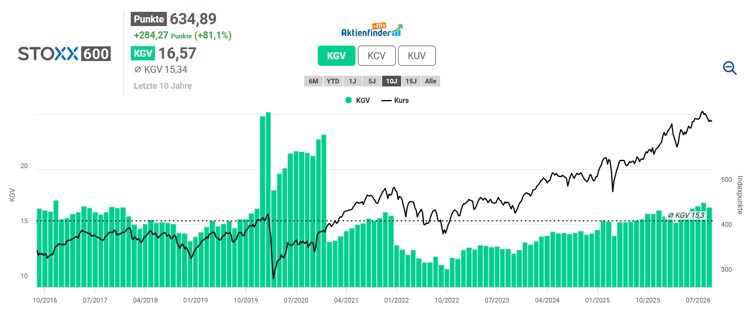
The STOXX Europe 600 measures the market situation in Europe. It includes 600 companies from 17 European countries across all size categories and, unlike the EURO STOXX 50, does not limit itself to the Eurozone. Important markets outside the Eurozone such as Denmark, Great Britain, Norway and Switzerland are also included. Over the past ten years, the STOXX Europe 600 has been valued at an average of 15.3, currently at 16.6, which is moderately above the long-term average.
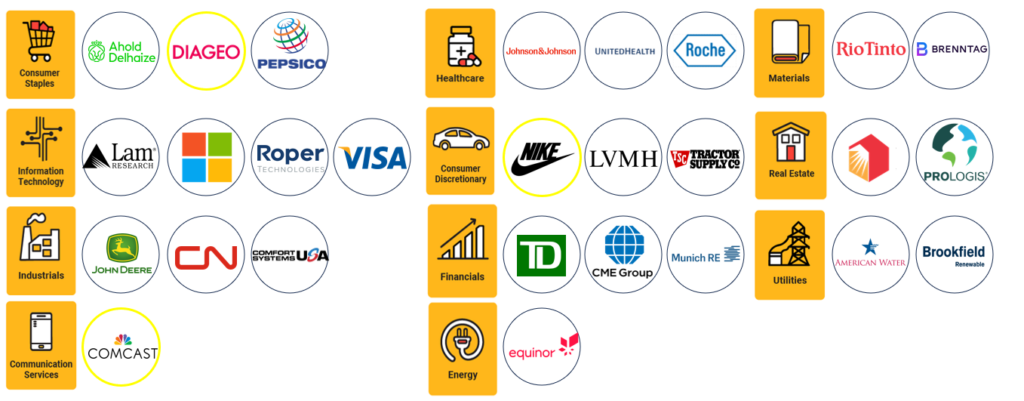
With unchanged 27 individual values, I see the fund sufficiently diversified across the relevant sectors. When broken down into the eleven sectors, the following distribution of companies emerges:
At first glance, the third quarter was a good one for stock investors. The S&P 500 has been up about 12 percent since the beginning of the year and is only slightly below its all-time high from mid-August. Solid quarterly results from Nvidia and other heavyweights supported US stock markets and kept sentiment elevated. However, the quarter was not calm. Interest rates, inflation fears, energy prices, and political decisions created latent nervousness that became visible especially in the bond market.
Once again, the difficult political and economic environment in the United States was the starting point. Investors increasingly doubted Washington’s fiscal policies and drove the yields on American government bonds to the highest levels since the financial crisis. The debt level has broken through a symbolically charged mark of 40 trillion USD. The Congressional Budget Office expects a further increase to around 46 trillion USD by 2030. Instead of responding with sound fiscal policy, the Trump administration is responding with ever more interventions in the markets.
Supporters point out that the US is still the strongest economic region in the world and that the dollar (yet) remains the only real global currency. As the center of the AI boom, they could afford to accumulate growing debt. Finance Minister Scott Bessent believes that they can grow out of the debt: If the economy grows faster than the new debt, the debt burden relative to gross domestic product will decline. Critics, however, consider deficits of this magnitude to be unsustainable even for the largest economy with the deepest capital markets, especially since they arise in times of full employment and solid growth.
What complicates matters is that US government bonds are competing with domestic ones. Alphabet, Apple, and Meta are flooding the bond markets in large numbers to fund their investments in AI data centers. Goldman Sachs estimates the investment needed to expand AI infrastructure at around one trillion USD. Investors have the choice between a Meta bond with around seven percent yield and a US government bond with a similar maturity of around five percent.
Europe was not spared either. Concerns about the government’s fiscal course in Paris put pressure on the bond market and brought a difficult week for the major French banks. Behind this lies a structural problem that affects many countries. High debt levels and deficits are accompanied by increasing social spending driven by demographic growth and higher defense budgets, all while growth is comparatively weak.
The stock indexes held up remarkably well, but on the surface things looked far less harmonious. Fewer and fewer companies are included in the index, while the majority is losing its footing. Mike Wilson, CIO and head of US equity strategy at Morgan Stanley, has described this imbalance. Since the Jackson Hole symposium in August, which sparked concerns about a more restrictive Fed, the proportion of S&P 500 stocks has fallen from around 75 percent above its 200-day moving average to below 50 percent.
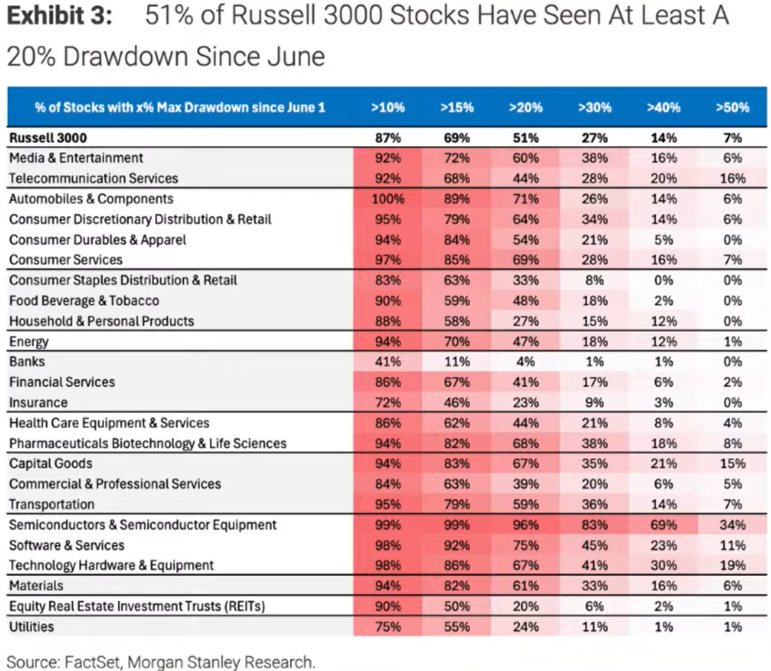
The extent of the correction is illustrated by an analysis by Morgan Stanley. Since the beginning of June, 87 percent of all stocks in the Russell 3000 have lost at least 10 percent. 51 percent have lost at least 20 percent, well over a quarter even more than 30 percent. The hardest hit were the cyclical winners. In semiconductors, 96 percent of the stocks fell by at least 20 percent, while for about a third the price has halved in the meantime. The correction affected software (75 percent) and technology hardware (67 percent) similarly broadly.
The sector balance fits the picture. Of the eleven sectors of the S&P 500, only two have outperformed the overall market since the beginning of the year: Energy with just under 38 percent and Technology with just over 35 percent. The fact that technology is doing so well, despite almost all semiconductor and three-quarters of software titles having lost significantly, shows how much the return is resting on a few heavyweights. Four sectors are even in the red: Financial stocks, communication services, utilities, and cyclical consumer goods. The latter, with just under minus 9 percent, rank last. The average sector is around 6 percent, which is only half the index return.
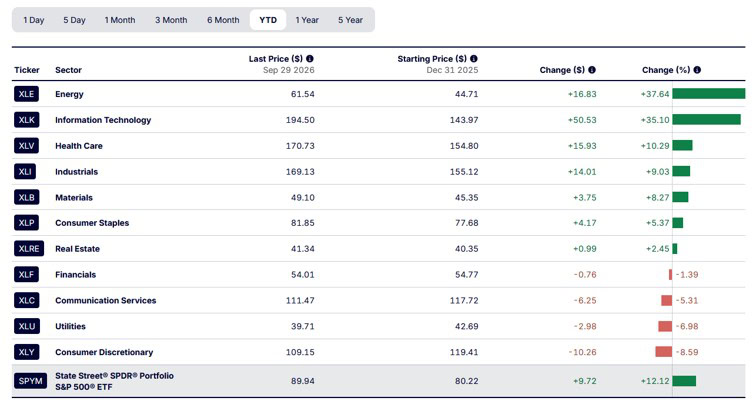
Wilson’s conclusion is simple: Such divergence cannot persist forever. Either the broader market moves higher, or the index gives in. He considers a 5 to 10 percent rebound possible and would even welcome it, because a final correction at the index level often marks the end of a month-long cleansing under the surface.
It is precisely in this discrepancy that the real opportunity lies. The market does not ignore the risks; rather, it has already priced them in to a large extent through depressed valuations, weak breadth, and a significant rotation of the leaders. At the same time, typical company earnings continue to grow at a mid-double-digit percentage rate, and the correction is already well advanced in many sectors. When the index is near record highs, but the vast majority of sectors lag behind, the more interesting buying opportunities lie rather off the winners of the year.
In the sample warehouse, I replaced Microchip Technology with Lam Research. Both companies are based in the semiconductor industry, but operate in very different areas. Microchip primarily develops and manufactures microcontrollers and analog chips for industrial and automotive customers. This focus is too one-sided for me, and the business is closely tied to the overall economic cycle. After a deep drop in sales, Microchip has since recovered, but the company continues to work on reducing its net debt. The quarterly dividend has remained unchanged at 45.5 cents since the beginning of 2025.
Lam Research, by contrast, supplies the equipment, spare parts, and services without which modern chips could not be manufactured at all; specifically, for etching and stripping ultra-thin layers of material. Among its customers are memory manufacturers as well as contract manufacturers and logic chip manufacturers. According to its own statements, nearly every advanced chip today is manufactured using technology from Lam. This benefits Lam by benefiting from the growth of the entire industry, regardless of which chip developer ultimately prevails. However, this business is cyclical, as it follows the investment budgets of the chip manufacturers. These are currently driven primarily by the structural expansion of AI infrastructure and less by the economy.
The operational quality is impressive. In addition to the asset business, revenue from customer service, which provides a large installed base for recurring revenue, also grew. At the same time, Lam is securing its technological lead: Over the next five years, more than 3 billion USD will be invested in a global network of research laboratories.
The balance sheet and capital allocation also convinced me. At the end of the fiscal year, Lam had liquid assets of around 5.6 billion USD, against long-term debt of about 3.7 billion USD. The company therefore has no net debt. In the long term, Lam wants to return at least 85 percent of free cash flow to shareholders. At the end of August, the quarterly dividend was increased by 27 percent, the twelfth increase in a row. The dividend yield of around 0.3 percent is significantly below the industry average and well below that of Microchip, which was last at around 2.5 percent. This is a step I deliberately accept. What is crucial is the ability to significantly increase the dividend over many years, driven by growing cash flows and a balance sheet without net debt.
On Monday, October 5, I am once again a guest at Live Webinar at CapTrader. Starting at 8 PM I will give an update on the DGI-Musterdepot and report on how the 3rd quarter of 2026 went for the portfolio. Here you can register for the free webinar.

