


Looking back at the DGI model portfolio, I provide a transparent insight into the development of the individual stocks in the portfolio in Q1 2026, determine the overall return, and highlight the performers and laggards within the portfolio. Additionally, I will discuss recent changes in the portfolio.
I will provide more details on this in the next Webinars on April 7 give. Click here to register for free.
Facts and Figures for Q1 2026
At the beginning, I look at the total portfolio level before I dedicate myself to individual stocks in the next chapter. The DGI model portfolio was started with an initial capital of 100.000 Euro equipped. As of March 31, 2026, approximately 83,500 Euros or over 80 percent of the total sum invested.
The following chart shows the long-term positive development of the dividend stair. Since the portfolio was launched, the companies invested in the depot have transferred a total of around 4,000 Euros to my cash account.

Taking all investments into account, I'm proceeding with a Liquidity reserve from around 20,500 Euros into the second quarter. The unrealized gains amount to over 14,000 Euros. All relevant depot components are summarized here in a table:
| Start-up capital 22.03.2024 | 100.000,00 |
| Invested capital | 83.428,62 |
| Unrealized capital gains | 14.259,43 |
| End Value 03/31/2026 | 97.688,05 |
| Free start-up capital 03/31/2026 | 16.571,38 |
| Dividends received | 4.021,49 |
| Total liquidity reserve 03/31/2026 | 20.592,87 |
The current personal dividend yield 2.9 percent. This result corresponds to a moderate decrease of 10 basis points compared to the last quarter. As a reminder of the calculation methodology: only the dividends actually received are divided by the total invested capital. In the second quarter, I expect payouts from annual dividend payers (Münchener Rück, Brenntag) and semi-annual dividend payers (Ahold Delhaize, Rio Tinto, Diageo, LVMH).
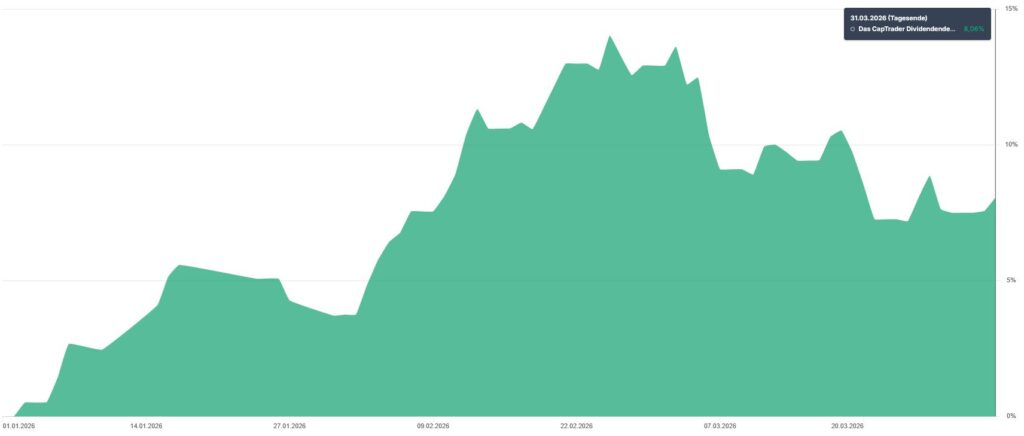
In the first quarter of 2026, the model portfolio recorded a value increase of 8.1 percent. Here I consider the Total Return, i.e. realized and unrealized capital gains and dividends received.
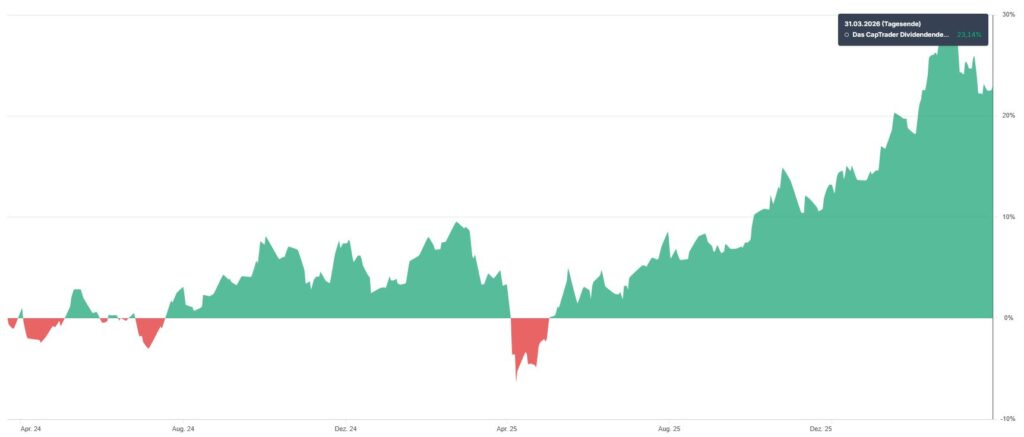
The short period under review - the portfolio was launched in March 2024 - does not yet represent a significant gain in knowledge for this review of the portfolio's performance. The aim is for the individual stocks in the portfolio to develop over the long term of at least ten years. We will therefore move straight on to the next chapter and the individual stocks.
Deep-dive single stocks
At the beginning of the year, there were a total of 27 Assets in the custody account, of which these are exclusively individual values. In the first quarter I have 6 subsequent purchases made, which I list chronologically below:
| Purchase date | Company (Ticker) | Total investment in € | Quantity |
|---|---|---|---|
| 06.01.2026 | PepsiCo (PEP) | 594,64 | 5 |
| 26.01.2026 | Munich Re (MUV2.DE) | 1.000,00 | 2 |
| 11.02.2026 | American Water Works (AWK) | 1.031,52 | 10 |
| 13.02.2026 | Roper Technologies (ROP) | 536,61 | 2 |
| 27.03.2026 | Microsoft (MSFT) | 922,40 | 3 |
| 27.03.2026 | Visa (V) | 511,00 | 2 |
In the November 2024 Comcast's management announced that NBCUniversal's portfolio of cable television channels will be spun off and taken public as a standalone company („SpinCo“). This new company will cover news, sports, and entertainment content (including USA Network, CNBC, MSNBC, Oxygen, E!, SYFY, Golf Channel, among others) and could potentially reach 70 million households in the U.S. Based on the last fiscal year, the divested segment generated revenue of approximately $7 billion. SpinCo, which will operate under the corporate name Versant operates, continuing the two-class share structure known from the parent company.
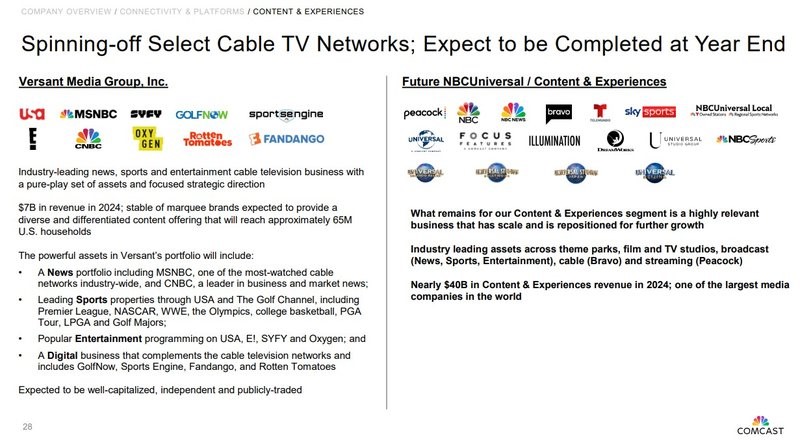
The transaction was completed at the end of 2025, and at the beginning of 2026, a total of three shares of Versant were credited to my account. In short: since the new company will not play a role in the DGI model portfolio and an increase to a significant stock size is out of the question, I sold them promptly and added the manageable proceeds to the cash reserve.
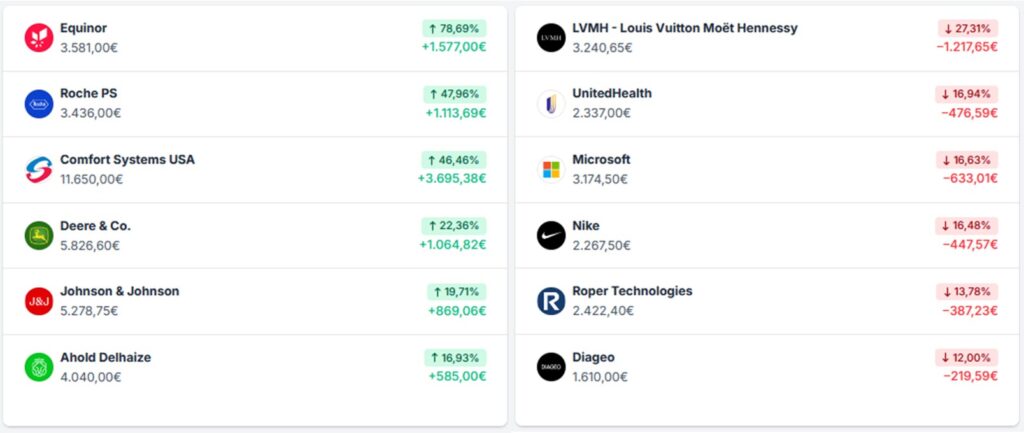
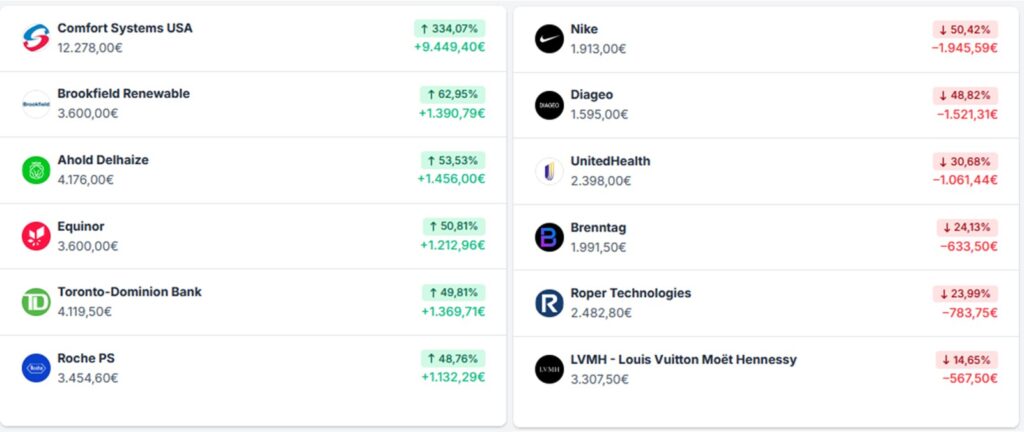
As in every quarterly report, you will find the „admirable“ below“ Top performer and "unfortunate" Stragglers in the first quarter of 2026 and since the beginning of the DGI model portfolio, calculated in Euros as the base currency:
Diversification & Allocation
In my investment strategy, the Portfolio diversification a proven way to adequately manage unsystematic risks and, in addition to controlling position size, is an integral part of my Risk management represent. Let us now take a closer look at the status of diversification according to different characteristics such as sectors, countries or company sizes.
I pragmatically bypass the fundamental question of whether to use the current market value or the originally invested capital as the basis for calculation by showing both versions.
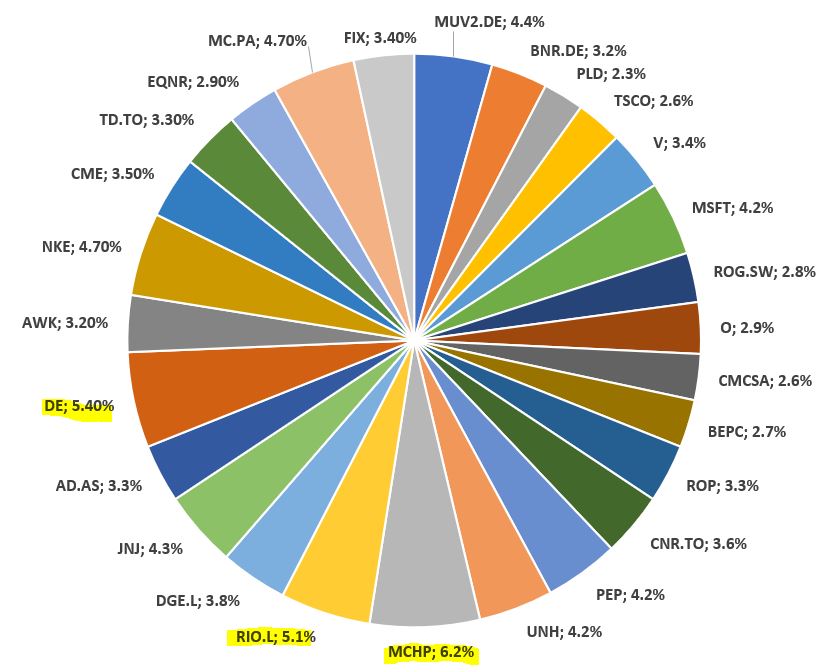
Let's first consider the composition of the portfolio based on the Individual values, that's how the situation can be described. I will continue to keep an eye on the rule that no company should account for more than five percent of the invested capital. At the current time, Deere, Microchip Technology, and Rio Tinto „violate“ this internal guideline:
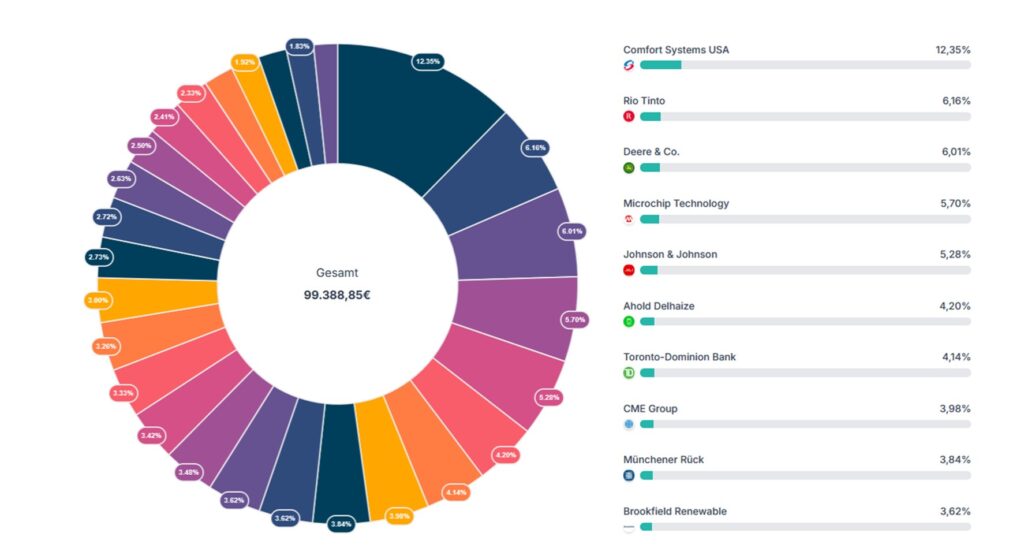
Now let's take a look at the composition of the portfolio based on the current Market value. The top 10 companies are shown on the right of the chart.
Based on the„Global Industry Classification Standard“I invest in the eleven sectors along the diverse value chains of the different industries that are important to our economy. Therefore, it makes sense to examine the current status in comparison to the target status. Stubbornly adhering to the Target allocation, which I will illustrate in the next graph, does not seem necessary to me for the time being, as I am not yet fully invested:
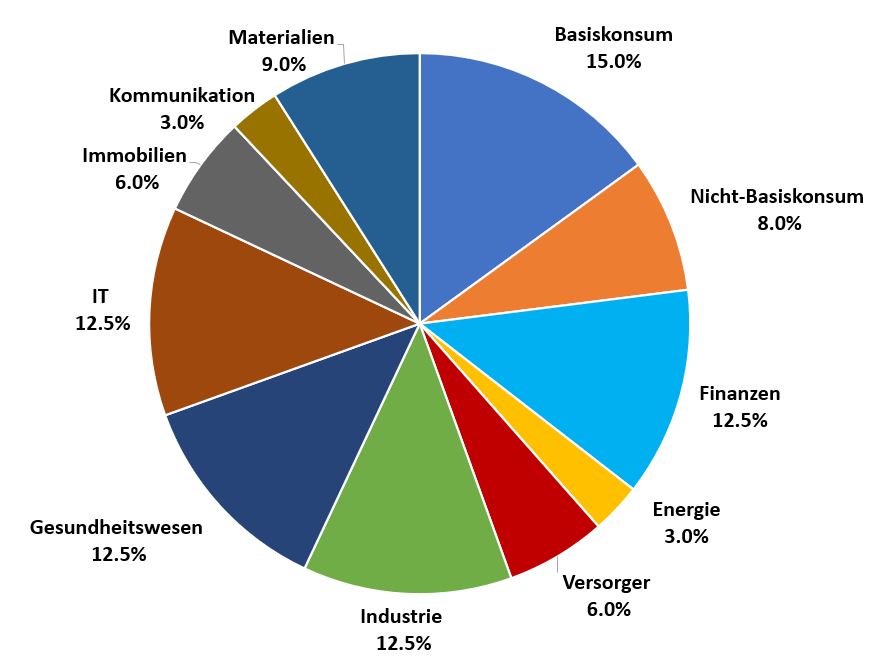
This results in the following Situation picture on sector distribution:
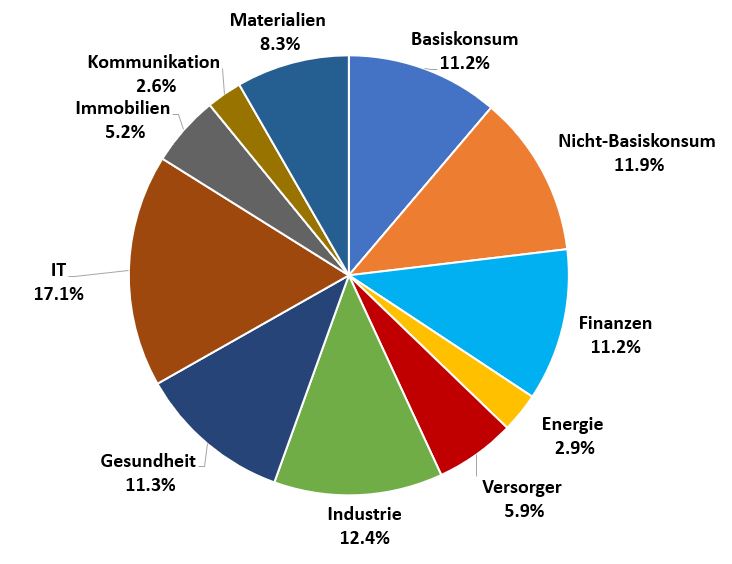
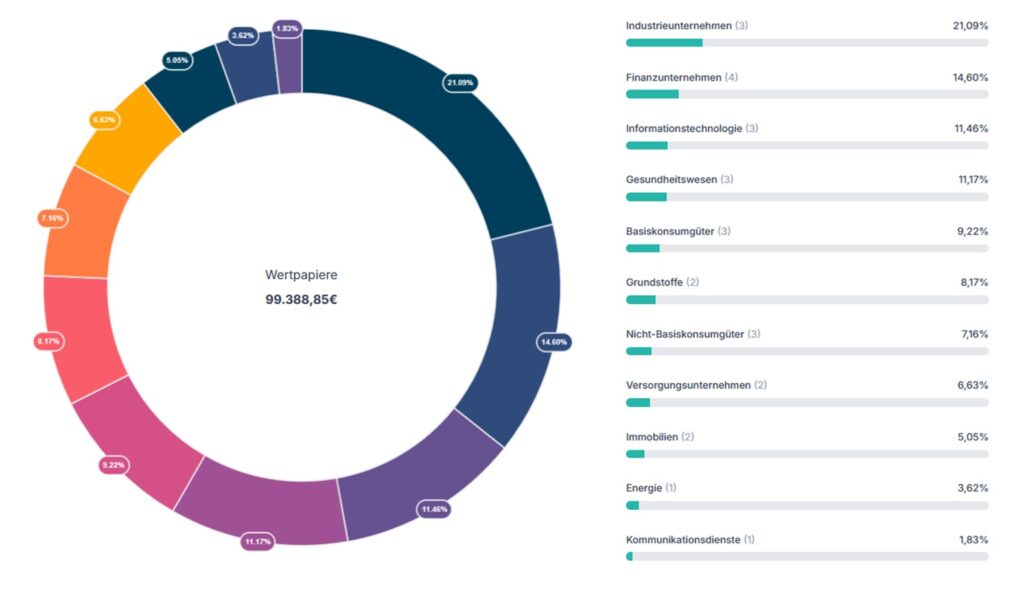
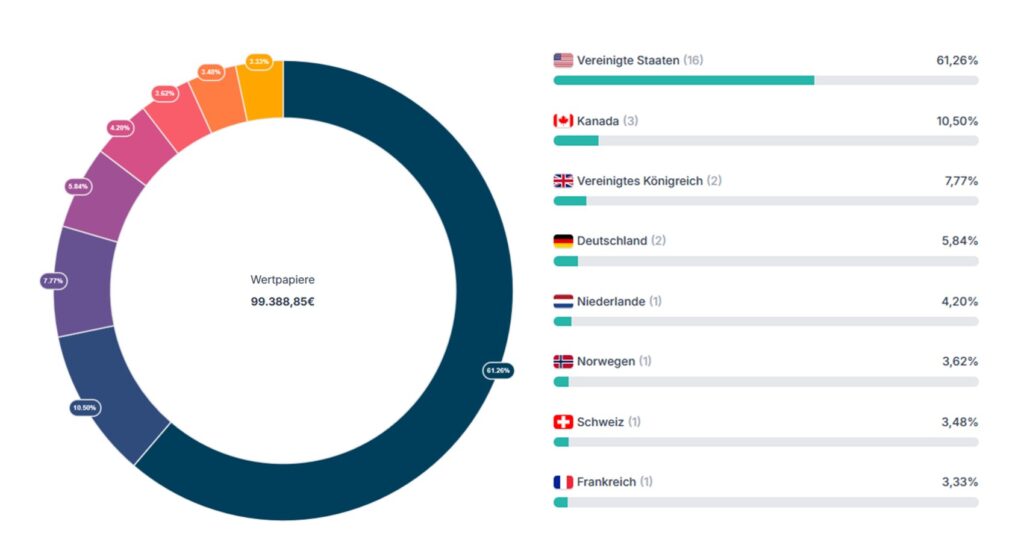
The Geographical spread I consider diversification across different countries and currency areas to be an essential part of risk management. There are no fixed limits on how much I want to invest in which country. My thoughts on this are quite simple: just because a company like Microsoft has its corporate headquarters in the United States, this by no means implies that the company automatically generates its operating revenue solely in its home country. Now, let's turn to Country allocation:
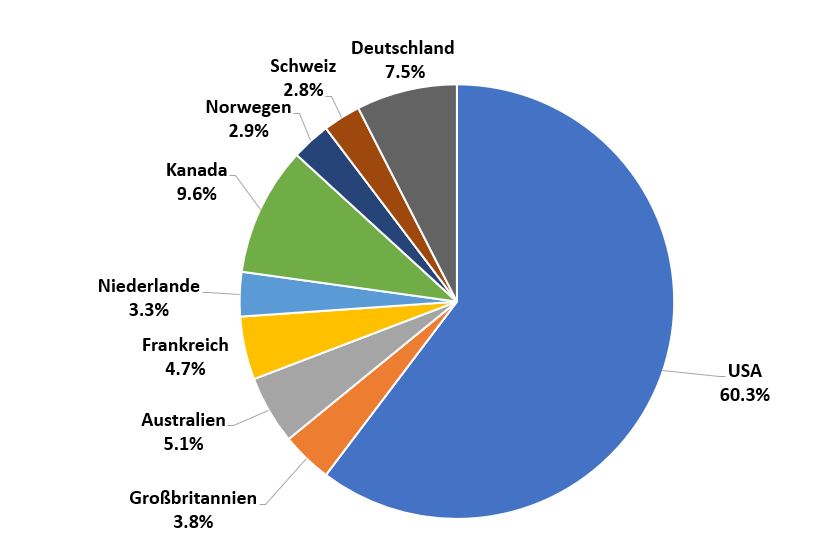
Since Rio Tinto is listed as a British company in Parqet, there's a difference in the representations between market cap and the chart above.
Outlook
The new year has barely begun, and world politics is already in turmoil: tensions between the US and Venezuela escalated to the point of an abduction of acting President Nicolás Maduro. The tedious debate about Greenland during the World Economic Forum in Davos seems to have already receded into the background. This is because a (further) war against Iran, or in the Middle East, triggered by a so-called „preemptive strike“ by the US and Israel, is moving into the center of public attention. In addition, we were able to shrug off the return of trade tariffs following a surprising decision by the US Supreme Court, as well as the appointment of a new Fed chairman.
In the technology sector, the divergence between the beneficiaries and supposed losers under the „AI eats software“ narrative became starkly evident in Q1 2026. Amidst headline risk, the crucial question remains: how much uncertainty have markets already priced in – and where is the next Black Swan lurking? It could get lively in the remaining three quarters…
Dwelling on gloom is not an option. A key objective of the real money portfolio is to remain steadfastly focused on long-term wealth accumulation, undeterred by short-term setbacks. In doing so, I strictly separate a company's value from its price. Given geopolitical events, changing macroeconomic conditions, or other external influences, I adopt the role of a patient private investor who adheres to the essential points of their rulebook.
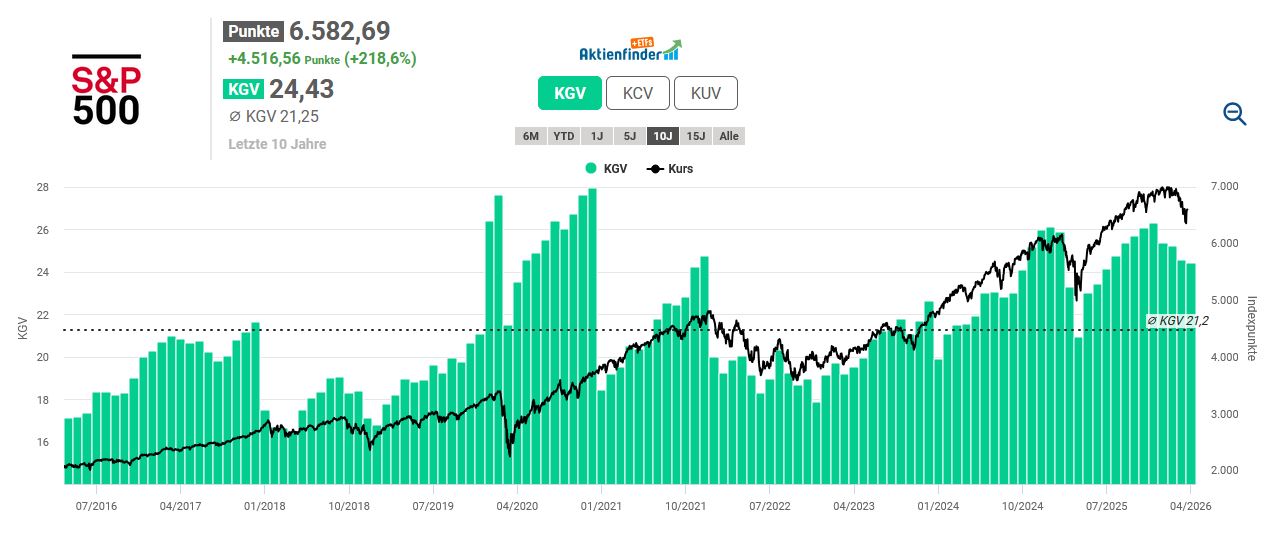
With every quarterly report, I look at the index level using the S&P 500 to get an initial sense of the current valuation based on the price-to-earnings ratio (P/E ratio). I am aware of the valid reasons why the P/E ratio at the index level should be interpreted with caution. Distortion by outliers, disproportionate influence by heavyweights („Big Tech“ or „AI boom“), changes in index composition compared to historical data, and so on. Be that as it may. Currently, the P/E ratio of 24.4 is more than three points above the ten-year average. Despite a price decline in recent weeks, the S&P 500 is therefore significantly overvalued overall during the selected period.
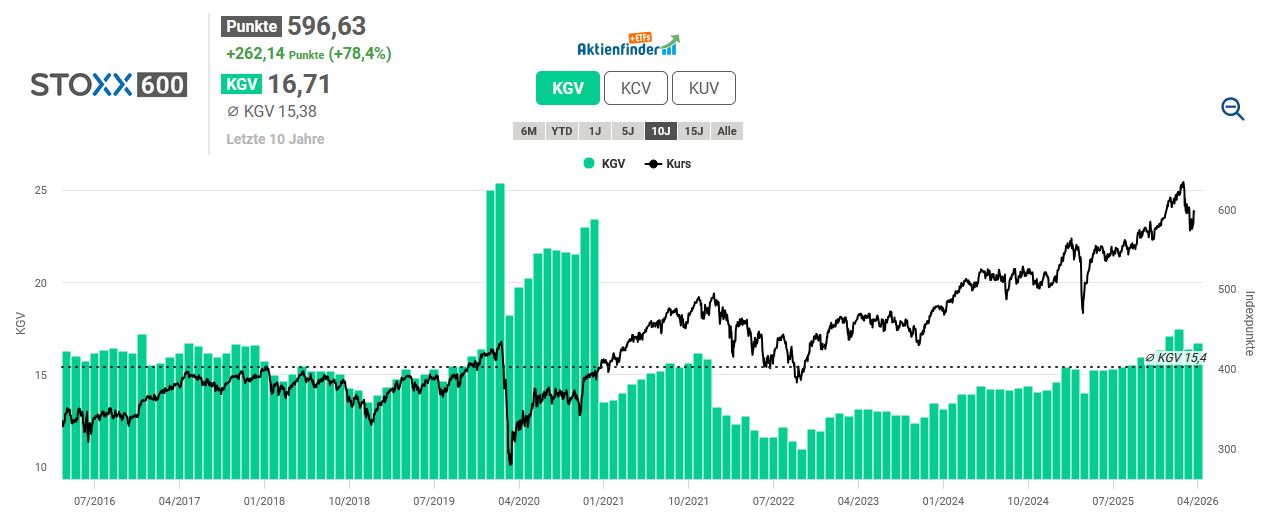
The STOXX Europe 600, which reflects the market situation in Europe, includes the 600 largest listed companies in Europe and, unlike the EURO STOXX 50, is not limited to the Eurozone. Important countries such as Denmark, Great Britain, Norway, or Switzerland are included in this index. On average over the last ten years, the STOXX Europe 600 was valued at a P/E ratio of 15.4. It is currently at 16.7, indicating a Überbewertung hindeutet.
Unchanged, with 27 investments in the depot across relevant industries, I see myself sufficiently represented. Broken down into the eleven sectors, the following distribution of companies emerges:

Finally, I would like to address a pattern that may be familiar to you. When stock market turbulence increases, I repeatedly receive inquiries from friends and acquaintances asking if, coincidentally now the right time has come to tap into the cash reserve and invest.
I find the internalized understanding of the mechanics of counter-cyclical investing to be very positive. Acting against the market trend. Buying when others are selling. Investing in times of crisis or falling prices when sentiment is pessimistic and assets are undervalued. The principle follows the well-known motto of Warren Buffett: "Be fearful when others are greedy, and greedy when others are fearful." Sounds quite simple, but the basic idea is based on a few, but important prerequisites that need to be present: patience, a long-term investment horizon, and a certain emotional discipline.
The war in the Middle East has been ongoing for a few weeks, but no one can currently assess how dramatic the medium- to long-term effects of the conflict will be on the global economy. No wonder – the assumptions of the different scenarios diverge significantly. In any case, the commodity and energy exchanges are experiencing high volatility, massive price surges are followed by tremendous price drops. All in all, these are not easy conditions for private investors to make decisions.
Against this background, the DGI model portfolio showed Defensive strength. Since the beginning of the year, the portfolio has developed in a decidedly positive way, with the negative effects of weaker stocks being more than offset by strong gains in the energy and pharmaceutical sectors.
As outlined above, I was still reluctant to make additional purchases in the past quarter. It is also an integral part of the investment process to carry out an ongoing portfolio analysis in order to systematically identify suitable buy-back candidates.
On the coming Tuesday, I will be a guest again at Live Webinar at CapTrader. Starting at 8 PM I will give an update on the DGI-Musterdepot and report on how Q1 2026 performed for the portfolio. Here you can register for the free webinar.

