


- As the central natural gas supplier in Europe, the Norwegian company generates high cash flows. This enables it to finance capital investments in new wind and solar parks and inorganic growth
- The generous profits of recent years have put Equinor in a favorable position to completely reduce the Group's net debt. Furthermore, the consistently high cash flows enable an attractive shareholder return consisting of constantly growing dividends and generous share buyback programs
- A gradual shift towards renewable energy sources first requires energy security in Europe. From a geopolitical perspective, Equinor has a key role to play in reducing dependence on fossil fuel imports outside the Western Hemisphere
- The extensive network of oil and gas deposits and refineries forms the foundation for a profitable business model with a robust earnings structure
- Click here for the DGI model portfolio and here to the overview of this series The dividend custody account
Company profile and business model: who Equinor is and what it does
Stock market players who have been active for some time will probably still be familiar with the company under its old name. Until it was renamed in 2018, the flagship of the Norwegian capital market traded as Statoil. The oil deposits discovered in the North Sea in the 1960s led to a decision by Norwegian politicians to develop the oil industry in their own country under state control. On June 14, 1972, by resolution of the Norwegian parliament The norske stats oljeselskap (oil company of the Norwegian state), Statoil for short. The deed of incorporation stipulated that Statoil was to be engaged in the extraction, transportation, distribution and sale of crude oil and derived products. The politicians also agreed to stipulate extensive reporting obligations for the company's management to the Ministry of Industry (later the Ministry of Petroleum and Energy).
The first production with Statoil's participation began in 1978/79 as a joint venture with Mobil. The oil is loaded from the drilling rigs onto tankers and transported to the oil ports. The gas from this part of the Norwegian continental shelf is transported to the Norwegian mainland via the Statpipe pipeline to Kårstø near Stavanger, Equinor's headquarters. Equinor has operated the field alone since 1987.
In the years that followed, Equinor sought to diversify along the value chain typical of the industry beyond the borders of the Scandinavian country. The degree of internationalization of the various activities in the oil and gas business extends from Europe via Asia and Africa to North and South America. Equinor is also involved in various pipeline operators in the midstream sector. Equinor sold the Statoil Fuel & Retail service station network, which is part of the downstream business, almost a decade ago to Alimentation Couche-Tard by around USD 2.8 billion.
In 2001, the Partial privatizationby selling 18.3 percent of Statoil shares on the Oslo Stock Exchange. The company is now also listed on the New York Stock Exchange. The state currently holds a 67 percent stake, which was laid down in a parliamentary resolution in 2001.
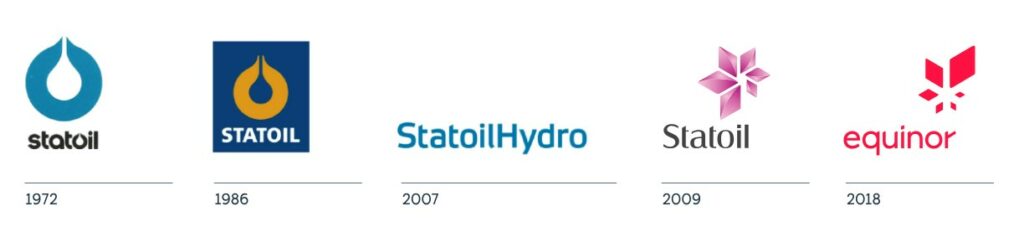
On October 1, 2007, the oil and gas business of Norway's second-largest oil company Norsk Hydro merged with Statoil. The two divisions of hydropower and aluminum remained independent within Norsk Hydro. As part of the transformation from a "pure play" in the gas and oil sector to an energy group with a focus on renewables, the company was renamed in May 2018. Equinor ASA changed its name. With the name change, the company wants to shed its image as an oil company. Equinor sounds like Equilibrium, like balance, according to a statement by the company's CEO on the official website.
At the beginning of 2024, Europe's most important supplier of natural gas employed around 23,500 people in 30 countries.
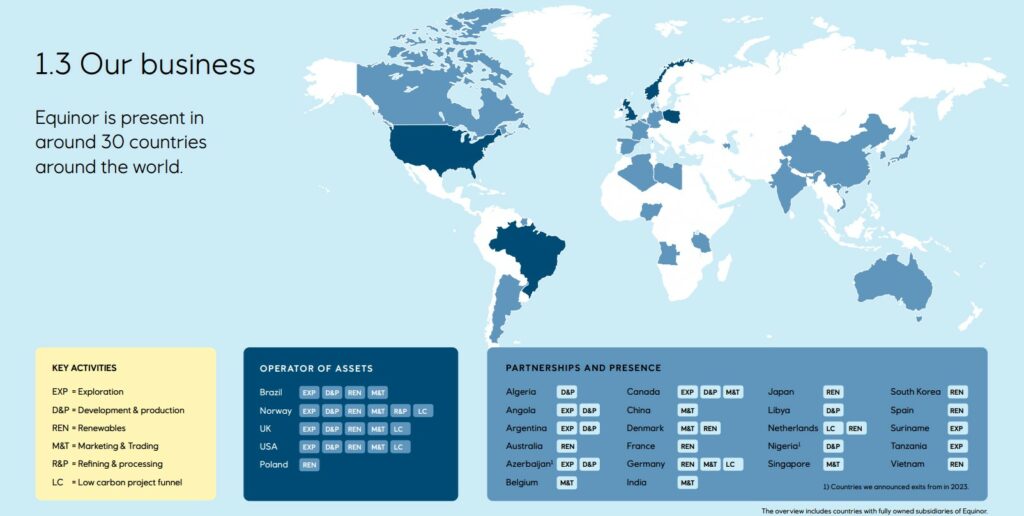
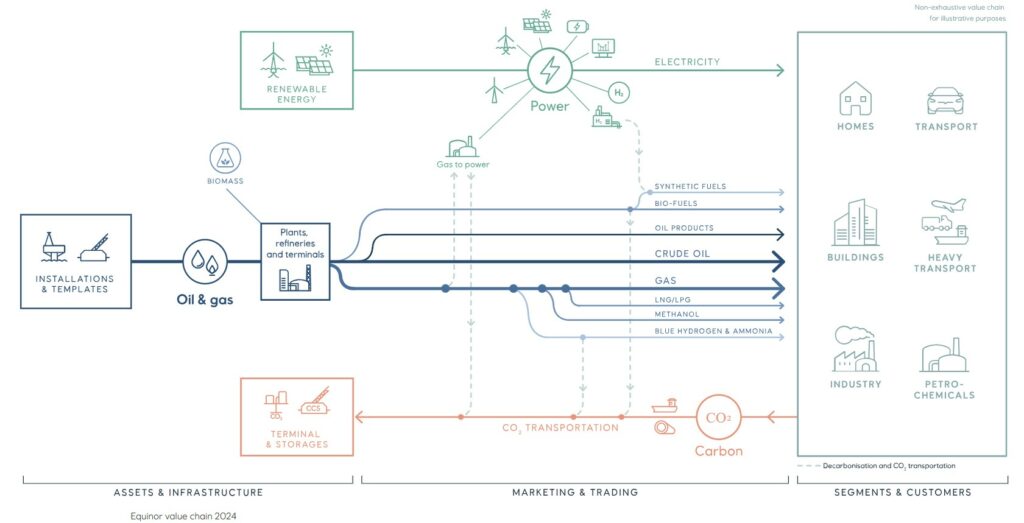
The business model of Equinor consists of activities in the exploration and production of crude oil and natural gas as well as energy trading. Equinor is also involved in renewable energies, particularly wind energy and solar energy, and implements carbon capture and storage projects.
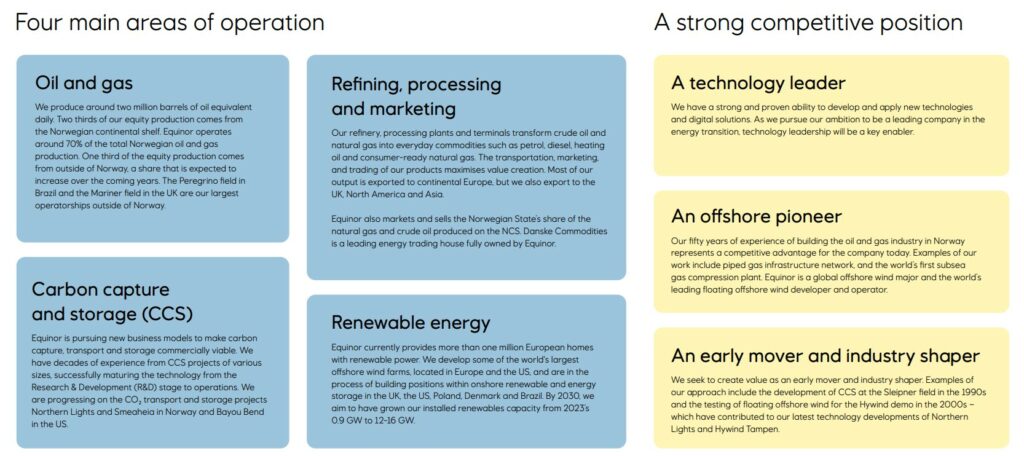
The production includes both Offshore as well as Onshore-facilities for the extraction of crude oil and natural gas, with the Norwegian continental shelf being the geographical focus. In the area of the Wind energy the company develops and operates offshore wind farms in various countries. The same applies to the construction and operation of solar parks.
The area Energy trading includes the marketing and trading of crude oil, natural gas and electricity as well as derivative products. In all business segments, the Norwegian energy group Strategic partnerships and Joint ventures especially when opening up new regions or developing complex, large-scale infrastructures. The background to this is the sharing of risks, costs and expertise within these cross-company collaborations.
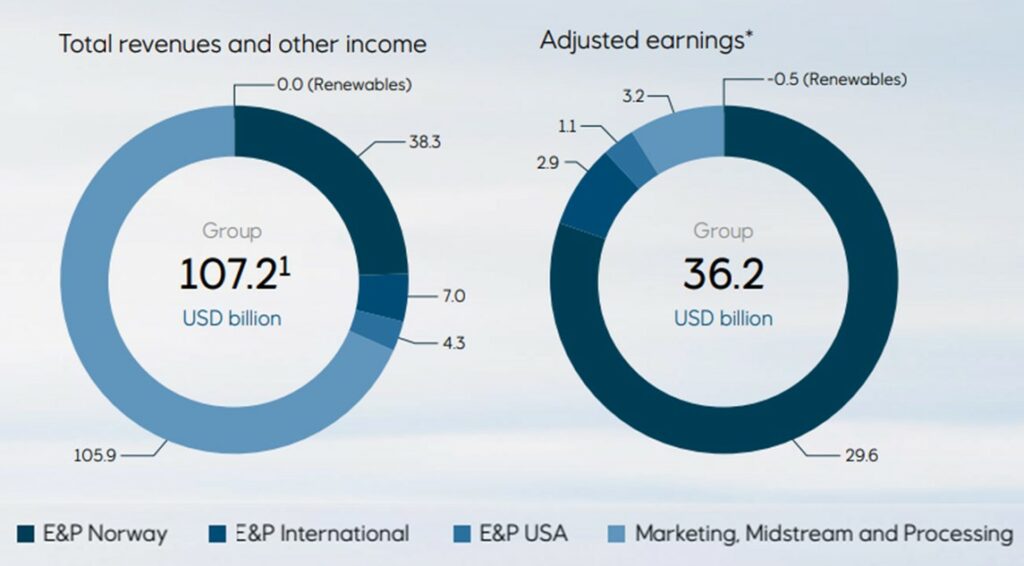
In the regional diversification we look at the distribution of profits and assets. Based on the 2023 financial year, around 81% of the operating result comes from the Norwegian domestic market, 10% from the international production sites and 9% from energy trading. The contribution of the Renewable energies is currently still negative. The company therefore generates the lion's share of its income from the exploration, distribution and processing of crude oil and natural gas.
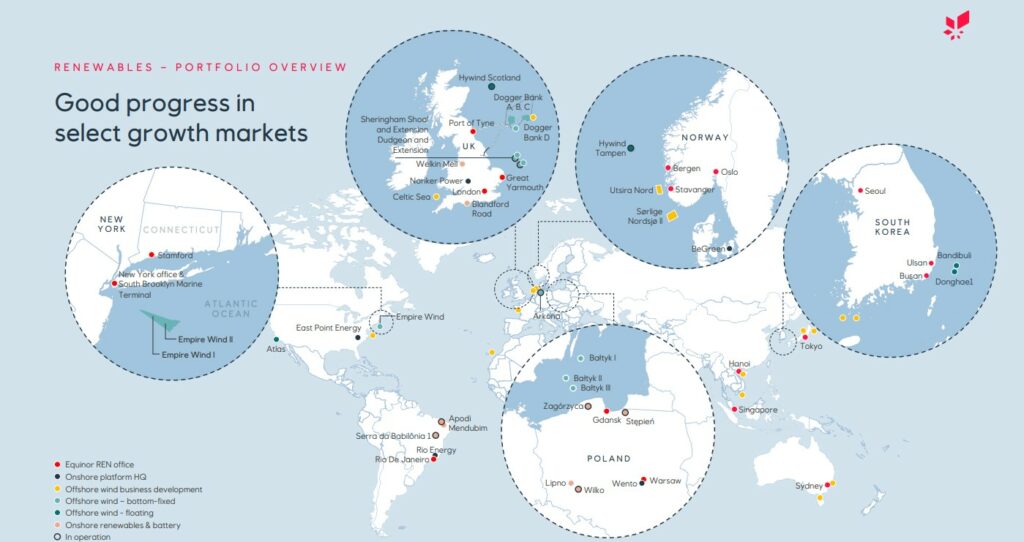
The Corporate strategy of Equinor is primarily aimed at the long-term transformation of the energy group into a more balanced energy portfolio that combines the traditional strengths in the oil and gas business with the ambitious growth ambitions in the renewable energies segment and in the hydrogen business. The traditional business should finance this corporate transformation thanks to cost optimization in the production stage.
This costly process is similar to other examples in the industry. In contrast to their counterparts in the United States, these companies also act in accordance with this objective. TotalEnergies from France and the British ShellThe new management of the latter company has recently slowed down the pace, resulting in a hard-fought Debate within the Group.
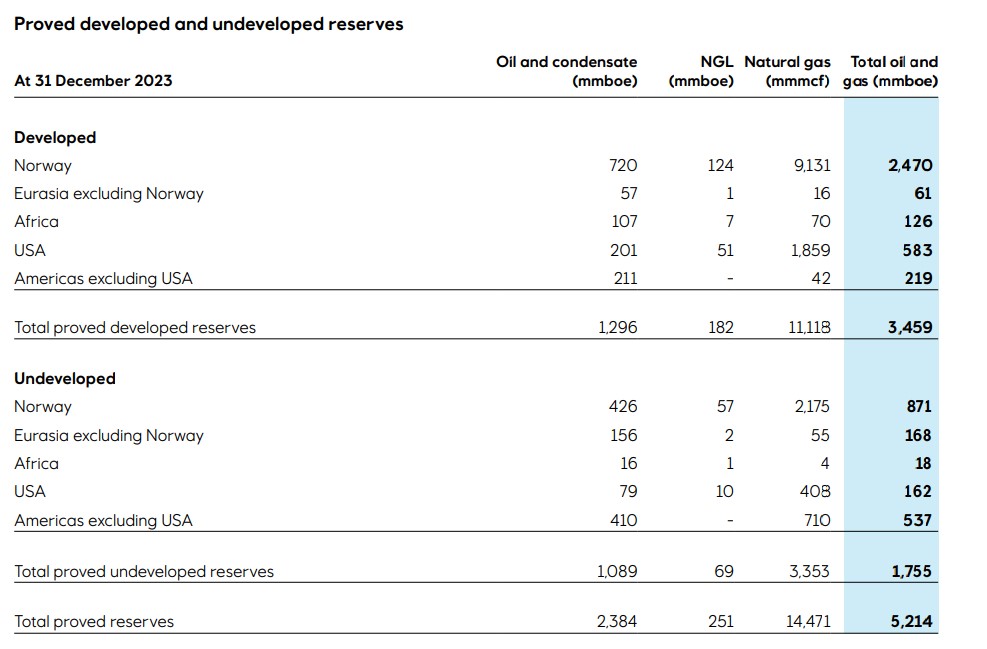
Finally, a look at the Reserves. The annual report repeatedly states that management relies on the cash-flow strong business segments that subsidize the comprehensive energy transition plan to transform itself into a net-zero emissions company by 2050. Proved oil and gas reserves are estimated at 5.22 million boe at the end of 2023, compared to 5.19 million boe at the end of 2022.
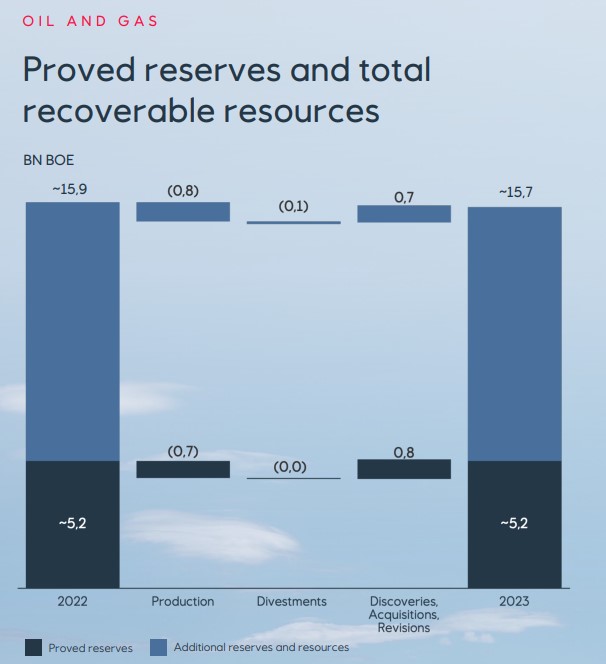
Approximately 83% of Equinor's proven reserves are located in countries that are members of the Organization for Economic Cooperation and Development (OECD). Norway is by far the most important contributor in this category (64 percent), followed by the United States (14 percent).
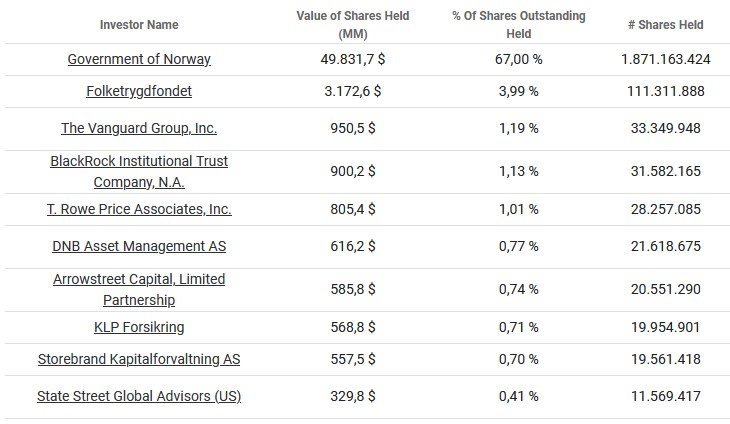
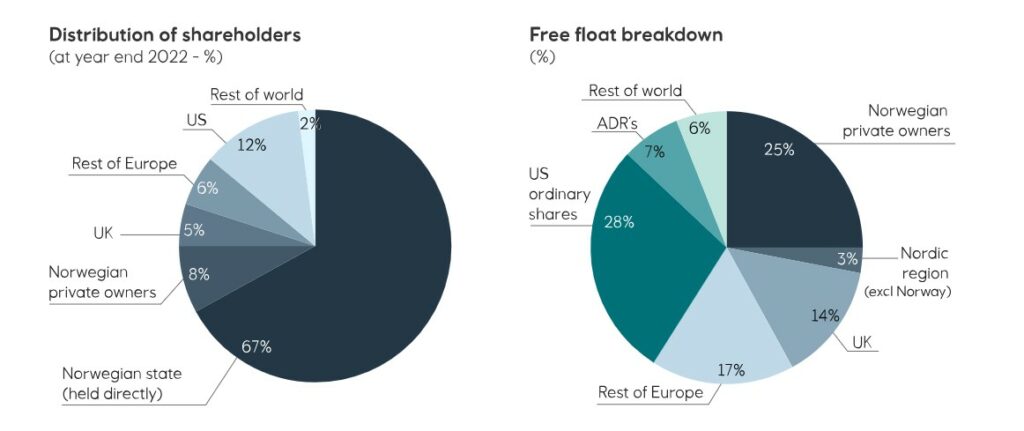
Today the Norwegian state two thirds of Equinor. The company contributes High taxation The success of the well-known sovereign wealth fund is due to the income generated from the oil and gas business as well as the generous dividends. Well-known asset managers such as Vanguard and BlackRock follow far behind the state.
Industry profile and competitive situation
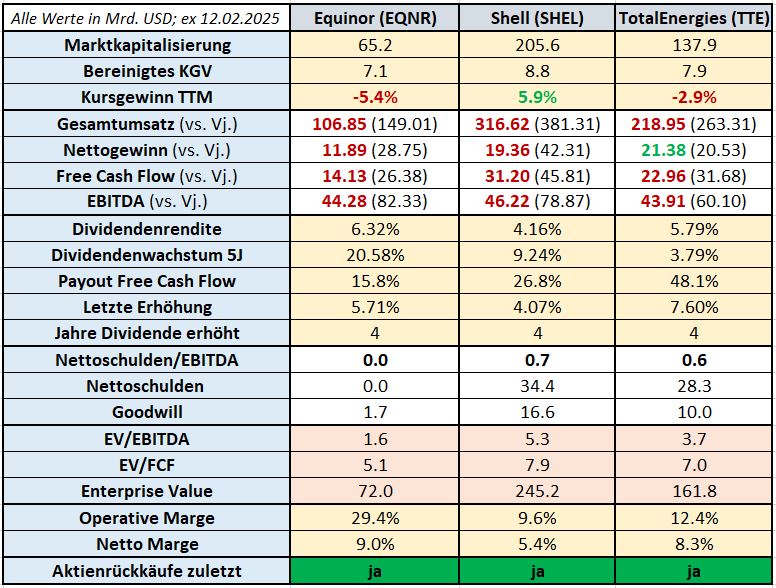
The characteristics of the typical business models of integrated oil and gas companies in the energy sector make it quite easy to compare the key figures between different competitors. Differentiating features in the weighting of the individual business segments, such as downstream and upstream, must of course be taken into account and the relevant figures placed in the appropriate context.
I In the case of Equinor, the question arises as to which sample to choose for the comparison group. I have decided to compare the largest competitors from Europe: TotalEnergies from France and the British Shell. Against an independent supplement with the US-American capacity experts such as Chevron and ExxonMobil or one Canadian Natural Resources from Canada is not an objection. The following comparison is based on the evaluated fundamental data:
Notes on the values contained in the table:
- Green or red coloring of the figures indicates growth or decline compared to the previous year
- All values are stated in US dollars (USD)
Equinor's financial situation
After gaining an overview of the industry in general and taking a closer look at the company, management and competition, we take a look at the Bilanz und den daraus abgeleiteten Key financial figures of Equinor. The focus here is on the aspects Growth, profitability and the Financing.
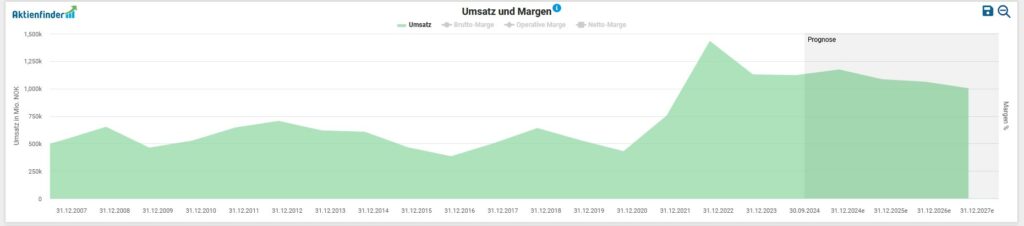
To analyze the financial situation, the first step is to look at the development of sales, profit and free cash flow. I have already discussed the internal distribution of turnover by segment in the chapter on the business model above. On average, the top line has grown over the last five years by 17.1 percent p.a. in the previous year. On a USD currency basis, sales growth amounted to 8.5 percent p.a.
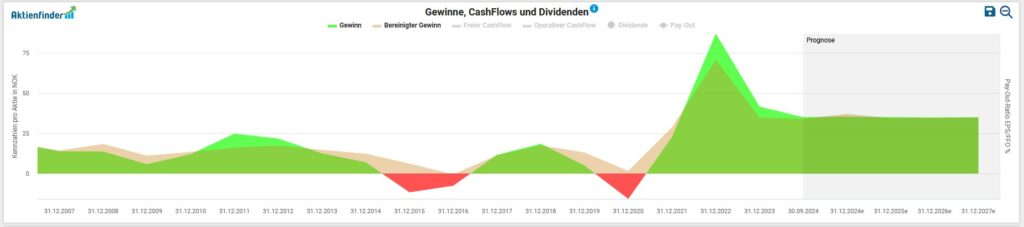
At Earnings per share we have seen a long-term upward cyclical trend for ten years. In the past financial year, Equinor generated a Net profit from USD 11.9 billion (2022: USD 28.5 billion).
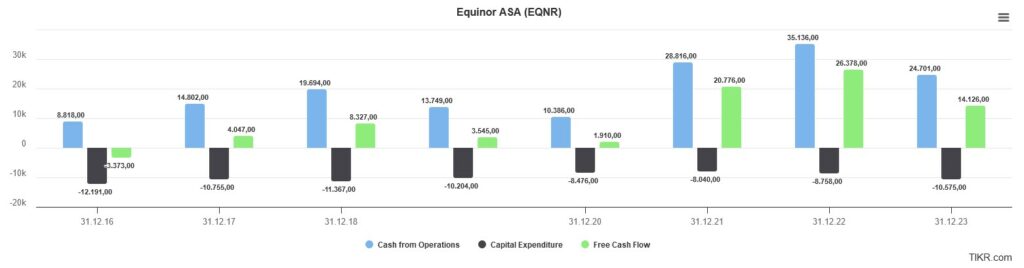
The amount available to the company Free Cash Flow can be used as part of the capital allocation policy to repay debt, expand via company acquisitions, pay out (increasing) dividends or buy back shares. In absolute figures - which I primarily like to use - the picture of operating and free cash flow and the extremely low capital expenditure (CapEx) for the period 2016 to 2023 is as follows:
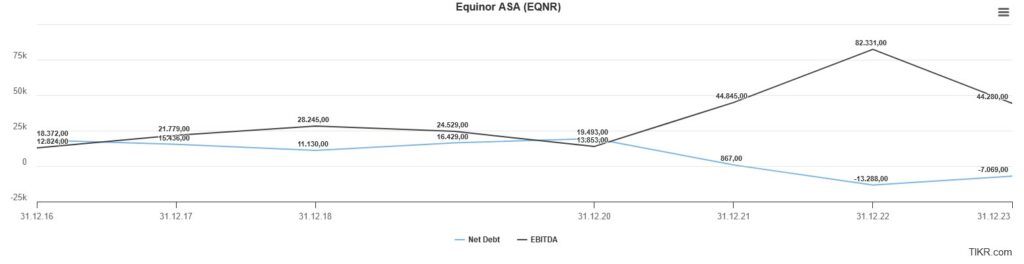
A look at the Debt situation shows us that, based on the last financial year, Equinor has a share of interest-bearing financial liabilities of USD 29.6 billion, which in turn is offset by cash and cash equivalents and securities totaling USD 30.7 billion. This saves us any further arithmetic and an examination of the maturity structure of the long-term liabilities and their interest conditions, as Equinor is free of any net debt.
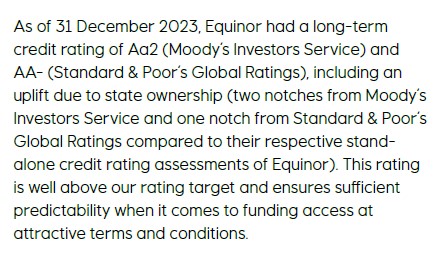
This also explains the Investment grade Classification of the Bonität Equinor by the well-known rating agencies Standard & Poor's and Moody's:
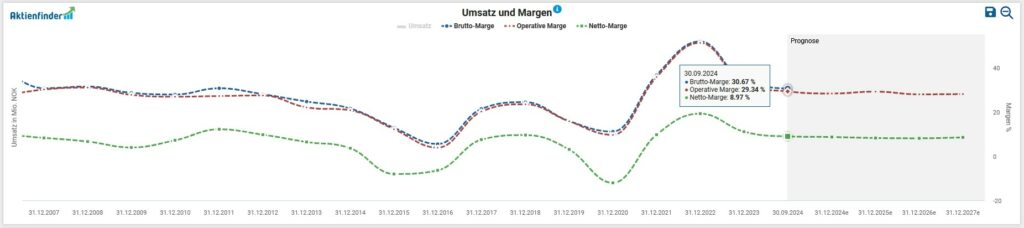
Finally, we look at the Profitability of Equinor based on the development of gross, operating and net margins. In line with the cyclical business model, we see an almost exemplary wave-like trend in margins, which are higher or lower depending on the price situation on the commodity markets.
Opportunities & risks
Equinor operates within the European crude oil and natural gas market in a Oligopolywhich is made up of a small number of suppliers. The multi-billion euro investments in LNG terminals in Europe and the ambitious expansion of the commitment to renewable energies are diversifying the Sources of income from Equinor. As a central supplier of natural gas in Europe, the Norwegian company generates high cash flows. In line with the communicated corporate strategy, this allows the company to make capital investments in new wind and solar parks or minority shareholdings, as was recently the case with the Danish company Ørsted finance. Operational expertise, in-depth knowledge of regulatory requirements, an established customer network in the downstream, a functioning but capital-intensive infrastructure with a transnational reach due to the production costs, etc. can all be used as valid factors that can be used for a resistant Moat speak.
The geopolitical events and conflicts in Europe not only gave the natural gas industry an extraordinary Special boombut emphasized the strategic value of this industry. A gradual shift towards renewable energy sources and the progressive decarbonization of industrial processes requires a foundation of Europe's energy security. From a geopolitical perspective, Norway plays a key role in effectively reducing dependence on imports of fossil fuels from Russia. As a result, there is a Stable demand for natural gas in Europe, which in turn supports Equinor's very good market position.
Equinor is gradually managing to reduce the production costs for the new projects. On average, the Break-Even at around USD 35 per barrel of Brent, which is currently just over USD 75/bbl. Depending on the project, the amortization of costs takes between one and two and a half years. Nevertheless, the Dependence to Brent crude oil prices and gas prices. The interplay between a surplus of capacity and periods of undersupply is expressed in the form of significant fluctuations in margins, operating profit and sales.
Particularly for a partly state-owned company such as Equinor, there is a need to fulfill regulatory requirements and legal provisions leave little to no room for maneuver. Although the Norwegian state acts as a guarantor of stability in the ownership structure, the energy company is completely at the mercy of the Norwegian state's authority in tax matters. In this context, the controversial "Salmon tax", introduced around a year ago.
Significant impact on the Corporate reputation mishaps in the construction planning of drilling platforms or serious accidents at work can also have an impact. Statoil was also at the center of the biggest corruption scandal in Norwegian economic history. The new projects in the oil and gas business, but also in the field of carbon capture storage systems, are accompanied by protests from non-governmental organizations and civil society, which draw public attention to the ecological risks of these projects.
Current valuation of the Equinor share
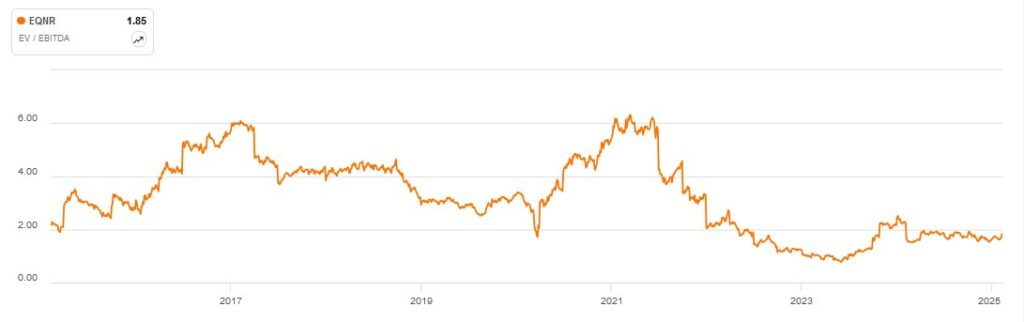
For the valuation of companies, I use the so-called Enterprise Value (EV) is used. In the case of a takeover, the EV indicates the amount required to purchase the assets required for operations and excludes the non-operating assets. I relate this key figure to operating profitability (before interest, taxes and investments (CAPEX)), expressed as EBITDA. The prevailing opinion is that a value of less than 10 indicates a „healthy valuation“ - as is always the case with generic Rules of thumb the company-specific context must be considered in the analysis by the careful investor himself. In the case of Equinor, we have to take into account an extremely favorable Valuation result of 1.9 to be on the safe side. In fact, the energy company has reached a historically low price level since mid-2022. The reason for this is the enormous increase in EBITDA thanks to the horrendous rise in natural gas prices in the European consumer markets:
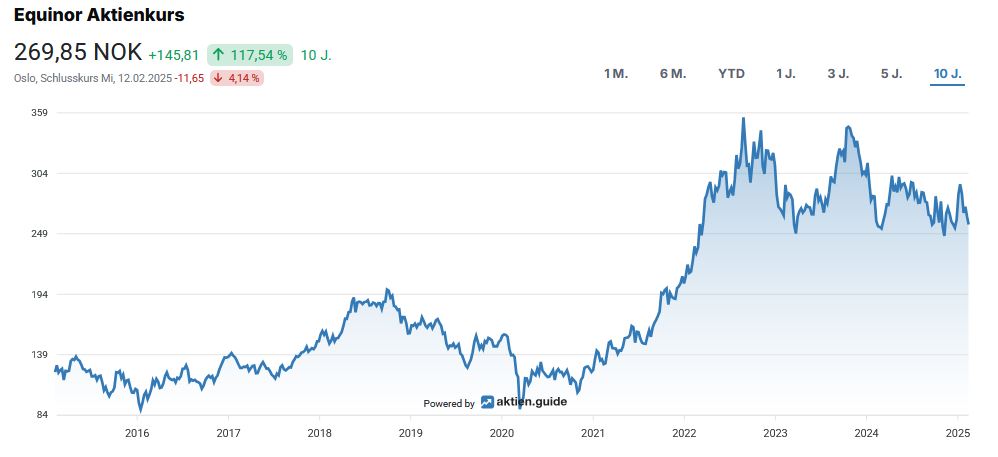
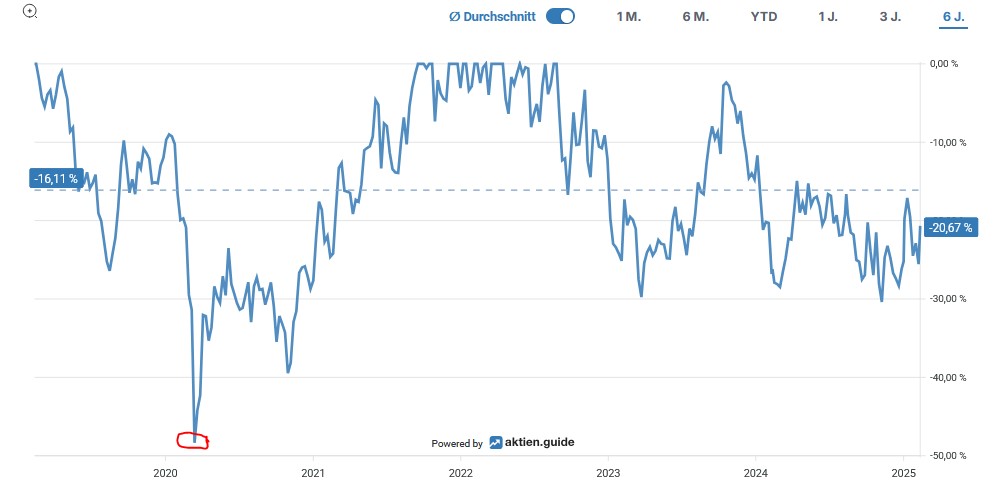
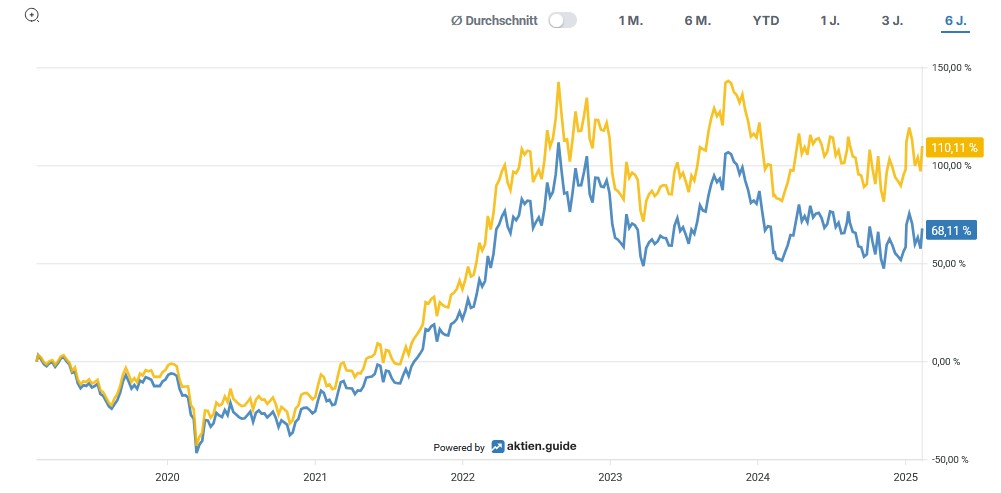
The Maximum decrease in the last six years amounted to approx. 48 percent in March 2020, when the price of US crude oil was even briefly negative for the first time:
Over the past six years, an investment in Equinor has yielded Total Return, including dividends received, a Overall performance from 110 percent for the investor. Calculated on the last ten years the total return amounts to 135 percent:
Capital allocation of Equinor
Bei der Betrachtung der Dividendenhistorie of Equinor, it is striking that the Norwegian energy company has been paying out an annually growing dividend for four years. In the wake of the turbulence on the oil market and the uncertainty caused by the outbreak of the global coronavirus pandemic, the management cut the quarterly dividend by two thirds (from 27 to 9 US cents). Equinor is now well above the level it was at the beginning of 2020, although this does not take into account the generous special dividends of the last three years.
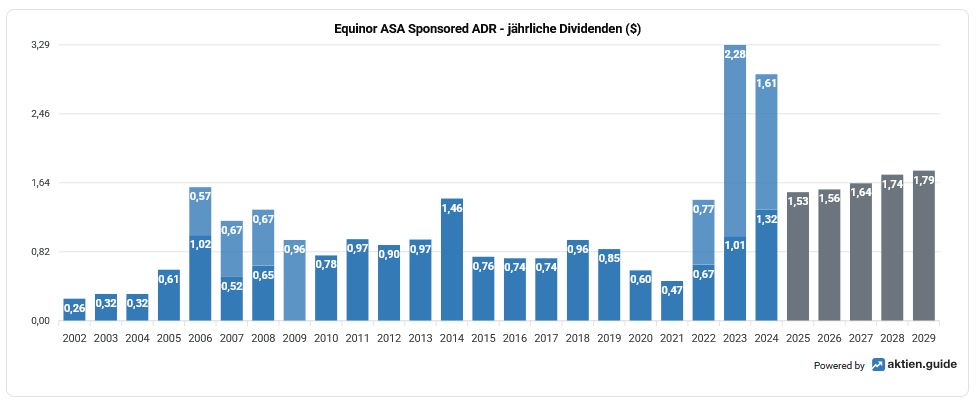
At the current share price of USD 24.20, this results in a Dividend yield from 5.8 percent. The Five-year dividend growth rate amounts to 9.7 percent p.a. or 2.8 percent p.a. in the Ten-year period. The company last increased its dividend by 16.7% in March. To round things off, here is an overview of the last five dividend increases:
- 2024: +16,7 %
- 2023: +50 %
- 2022: +11,1 %
- 2021: +63,6 %
- 2020: -66,7%; +22,2 %
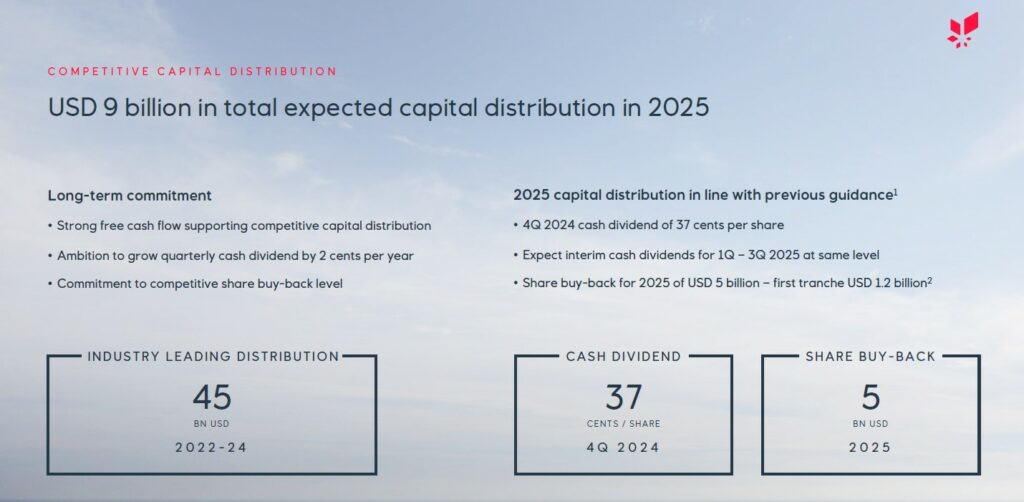
The quartalsweise ausgeschüttete Dividende beträgt aktuell 0.37 USD per share and is paid out in the middle of each quarter (February, May, August, November).
If we take the average value of the Free Cash Flow of the last three years as the basis for determining the Payout ratio we end up with a comfortable result of 15.8 percent for the payout ratio of Equinor. The special dividends are not included here.
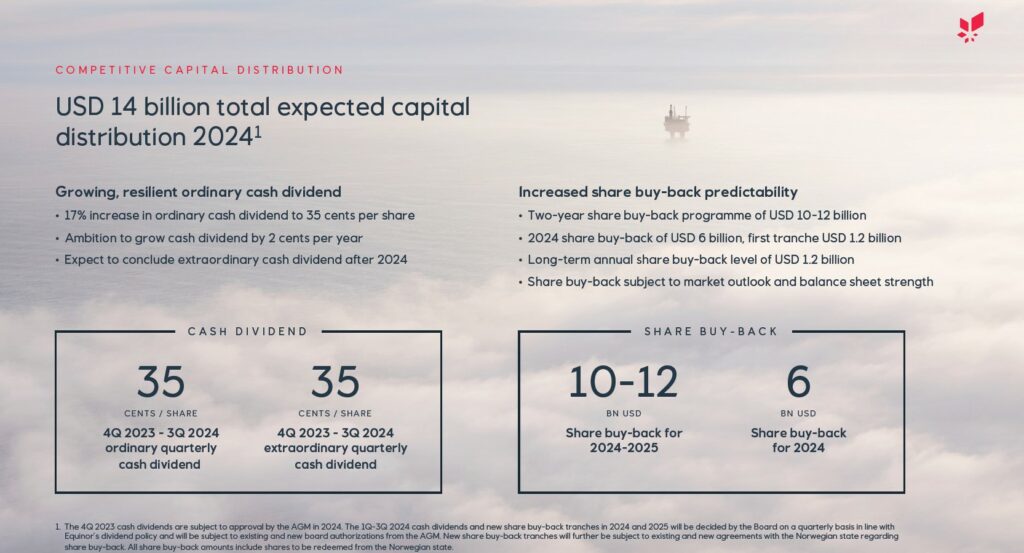
Apropos Special dividendswhich Equinor has distributed to shareholders in generous amounts in recent years. As mentioned several times in this article, the energy group generated enormous surpluses in the course of the exceptional boom on the European natural gas market. In addition to a generous share buyback program that reduced the outstanding shares by almost a fifth, Equinor has paid out special dividends totalling USD 5.40 per share in eleven tranches since the beginning of 2022. On the penultimate capital market day, the provisional end of this era of special dividends was scheduled for calendar year 2024. At the same time, the top management commented on the future dividend policy. Accordingly, the dividend will be increased by two US cents per year. This step was also taken in February 2025.
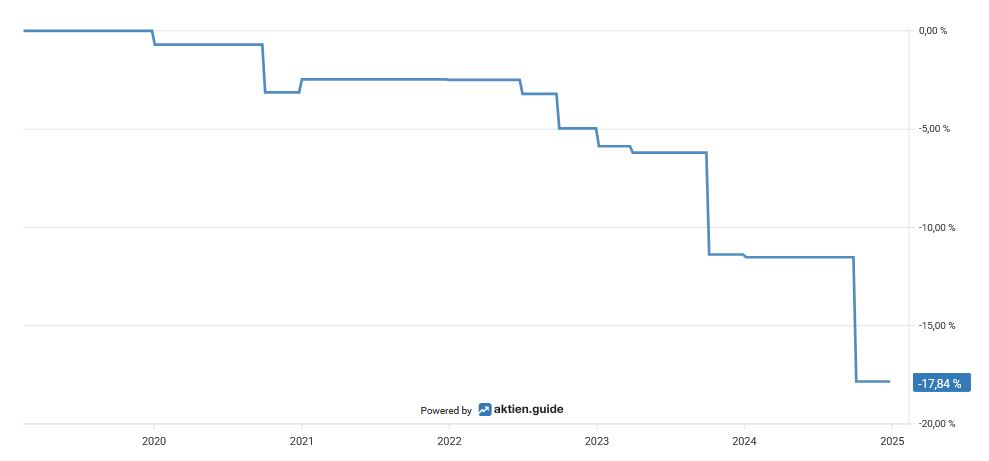
The Number of shares outstanding decreased by a total of 17.8 percent in the past six years.
The current Aktienrückkaufprogramm in the amount of USD 5 billion was announced at the last capital market update. Equinor is using this instrument flexibly to return excess capital to shareholders. The aim of the share buyback program is to reduce the company's issued share capital. All shares acquired under the first tranche for 2025 will therefore be canceled through a capital reduction at the company's Annual General Meeting in May 2025. In an agreement with the main state owner, the latter agrees to cancel part of its shares in order to maintain its stake in Equinor at 67%.
Conclusion: Considerations for my decision to invest in Equinor
Triggered by the price distortions on the European natural gas market, Equinor benefited from the high revenues from its core business. The Norwegian energy group was able to reduce its debt burden to such an extent that the company could now immediately pay off all of its long-term liabilities with its cash holdings. Equinor operates in an oligopoly on the European oil and gas market, which is made up of a small number of suppliers. The continued stable demand for natural gas in Europe supports Equinor's dominant market position.
The multi-billion euro investments in LNG terminals in Europe and the ambitious expansion of the company's involvement in renewable energies are gradually diversifying Equinor's sources of income. As a central supplier of natural gas in Europe, the Norwegian company generates high cash flows. This enables the company to finance capital-intensive investments in new wind and solar parks or inorganic growth through investments. At the same time, it puts the company in a position to offer an attractive shareholder return consisting of constantly growing dividends and generous share buyback programs. At the current price level, Equinor has an exceptionally fair valuation.

