


- With its range of strong core brands and its positioning as a quality-conscious label, Nike is the world's largest player in the manufacture of sports and leisure goods.
- Thanks to long-term increases in sales and cash flow as well as a high cash position, the company has kept its net debt close to zero for years. In addition, Nike has not accumulated any ballast from past acquisitions in the form of goodwill on its balance sheet.
- Nike attaches great importance to shareholder returns. Over the past ten years, the number of outstanding shares has been reduced by 15 percent and the dividend increased by a factor of 3.5.
- At the current price level, Nike has a fair valuation compared to previous years, even though the company has to fight intensively with various competitors for market share.
- Click here for the DGI model portfolio and here to the overview of this series The dividend custody account
Company profile and business model: who Nike is and what it does
Before the company actually bore the name of the Greek goddess of victory Nike in its name, it initially produced sports shoes under the brand name Onitsuka Tiger through the US vehicle Blue Ribbon Sports (BRS). Even then, the successful athletics trainer and running coach of co-founder Philip Knight, Bill Bowerman, managed the fortunes of the distributor. From 1964 to 1971, the import-export business grew and the Japanese sports shoe manufacturer, now known worldwide under the name Asics, sought to take over the financially successful BRS.
The collaboration between BRS and Onitsuka Tiger finally ended in 1972, and the Americans were prepared for this. The year before, the company had already placed its first independent order for 20,000 shoes with two Japanese shoe manufacturers, 6,000 of which bore the legendary Nike logo. Runner Jeff Johnson was recruited to market the new brand. The Swoosh was redesigned by Carolyn Davidson and registered by Nike with the US Patent Office in January 1974. The impressive story of the innovator Bowerman's initial guarantor of success, Tiger Cortez, can be read here. here can be read here.
After the IPO in 1980, high-profile sports sponsorships gave the company an enormous boost in popularity outside of running. The beginning of this growth spurt was marked by the collaboration with future basketball star Michael Jordan. This advertising partnership alone is said to have brought Nike around 2.6 billion US dollars have played into the coffers. Nike has been sponsoring individual athletes and teams from various sports since the 1990s.

In 2003, the company acquired the Converse brand at a cost of around USD 300 million. Today, Nike is the world's largest and probably best-known sportswear manufacturer for shoes, clothing and sports equipment, which are developed in-house and produced by independent contract manufacturers in over 400 factories worldwide. At the beginning of 2024, the company, headquartered in Beaverton (Oregon), employed almost 84,000 people.
Im Zentrum des Geschäftsmodells The company focuses on product development and the global distribution of sports equipment, clothing and accessories. The two major business areas under the title NIKE BRAND belong to Athletic Footwear (shoes) and Apparel (clothing), which includes various products for a wide range of sports and leisure activities. In addition, the segment Sports Equipment (sports equipment/accessories) should be highlighted in this supercategory.
The company is known for its marketing strategies and sponsorship agreements with athletes and teams around the world in various sports. This includes the famous collection Air Jordanwhich was first launched in 1984 in an exclusive partnership with the future basketball star Michael Jordan was introduced. Furthermore, Nike is the owner behind the subsidiary brand Conversewhich specialize in shoes, clothing and accessories outside the core brand. The legendary Chucks (Chuck Taylor All Stars) are a well-known product.
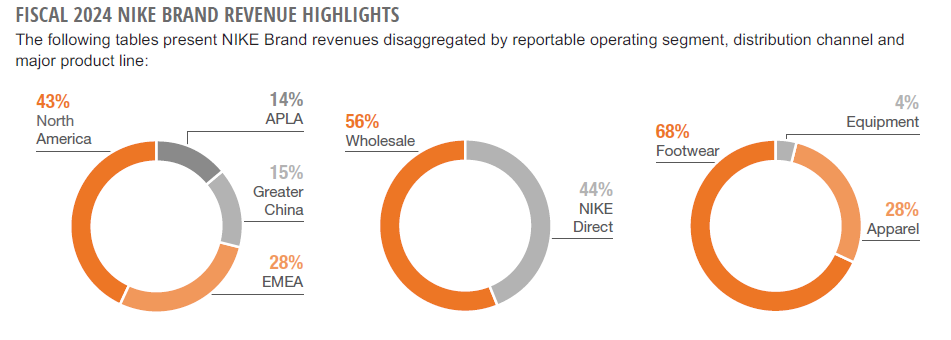
In terms of product segments, the distribution of sales is unbalanced. More than two thirds of sales are generated through the sale of shoes, which is hardly surprising given the company's origins. The clothing segment is responsible for 28% of total revenue. The "Equipment" segment, on the other hand, generates 4 percent of sales, while the Converse business, at 4.1 percent, does not even exceed the five percent mark and is losing importance in relation to total sales every year.
Finally, the segment Global Brand Divisions which plays a subordinate role. It primarily comprises the expenses for product advertising ("demand creation") and operating overheads, including expenses for product development and design, which are managed centrally for the NIKE brand, as well as the costs associated with the global digital activities of NIKE Direct. Revenue comprises licensing income from the NIKE brand and other income that cannot be allocated to a geographical business segment.
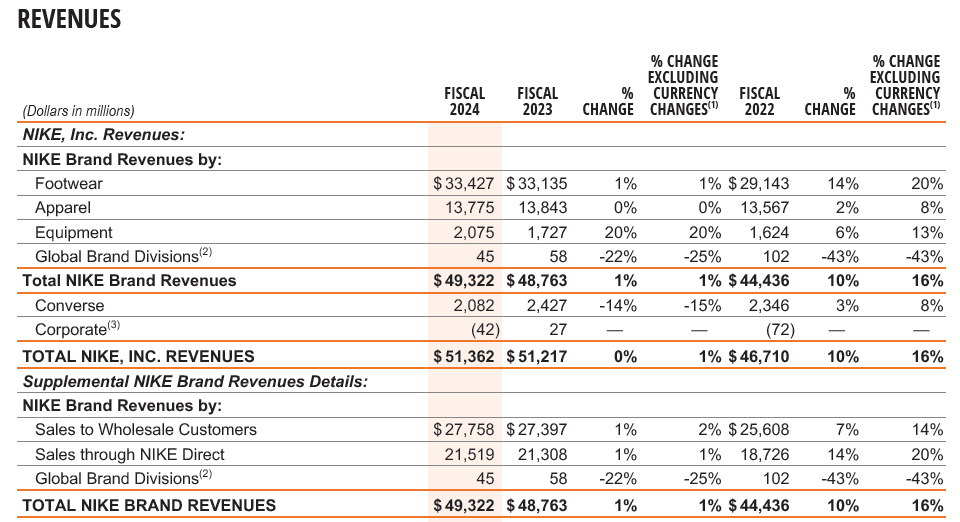
The geographical distribution of sales shows the relative dominance of the USA as the most important sales market. Around 42% of total revenue comes from the US business, with the three largest key accounts accounting for around 22% of revenue in the USA. This is followed by the EMEA region (Europe, Middle East and Africa), Greater China and the rest of the Asia-Pacific region including Latin America (APLA region). The annual report does not provide a detailed breakdown at country level.

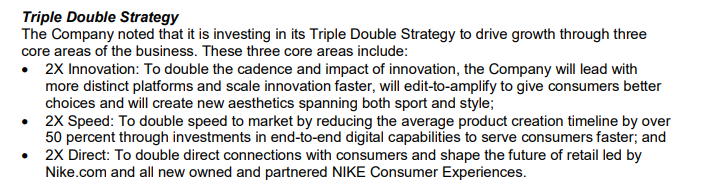
The Corporate strategy Nike is focusing on the digitalization and vertical integration of its business model. The initiative called Consumer Direct Acceleration (CDA), the company is pushing its DTC (direct-to-consumer) business. Nike products are sold directly to end customers without intermediaries via traditional brick-and-mortar Nike stores and e-commerce. This strategic direction is based on the decisions made in 2017 as part of the so-called Triple Double Strategy.
An important detail in passing: with this strategic shift, Nike entered into direct competition with its business customers, namely those retailers who in turn stock Nike products. With the new CEO Elliott Hill taking over the helm from his predecessor John Donahoe in October this year, it will be interesting to see what impact this change will have on Nike's future business strategy. Hill is a Nike veteran who has held senior positions across Europe and North America during his 30-year career. As President for "Consumer and Marketplace", he led the business and marketing division at Nike and the Jordan Brand until 2020.
Looking at the ownership structure The first thing that stands out about Nike is the typically high proportion of Institutional investors on. This makes up around two thirds of the common stock class (Class B) and is usually fed by the "usual suspects" in the asset management industry such as Vanguard or BlackRock.
When talking about a Class B, you probably ask yourself what the Class A is ordered. Similar to the Swiss luxury group Richemont, there is a second class of shares that cannot be acquired in regulated stock exchange trading. The main difference is that holders of Class A shares elect nine of Nike's twelve board members, while holders of Class B shares elect the remaining members. The billionaire and co-founder of Nike, Phil Knight and his son Travis Knight together with the holding companies and trusts they control (in particular Swoosh LLC), own more than 95% of the A shares in circulation.

As a result, the Knight family retains effective control over Nike and can exercise its full influence, even though it is a publicly traded company.

Industry profile and competitive situation
The special characteristics of the business model of Nike in conjunction with my selected parameters makes the comparison with the listed competition less meaningful. Apart from the enormous discrepancy in market capitalization, no other company in the industry has a nearly constant dividend history like Nike.
Whether a comparison of key figures with other competitors such as Adidas, Puma, Skechers or On Holding should be carried out is best decided by each investor for himself.
The financial situation of Nike
After gaining an overview of the industry in general and taking a closer look at the company, management and competition, we take a look at Nike's balance sheet and the key financial figures derived from it. The focus here is on the following aspects Growth, profitability and the Financing.
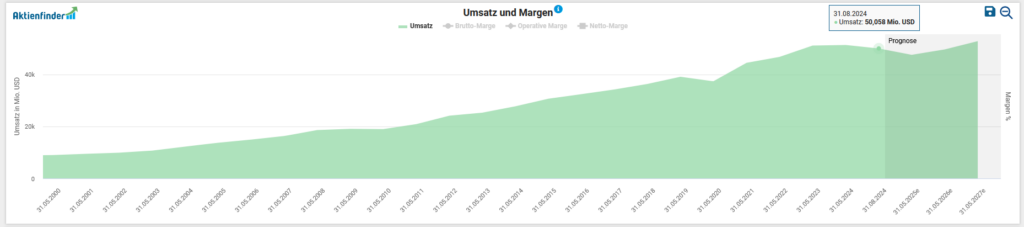
To analyze the financial situation, the first step is to look at the development of sales, profit and free cash flow. I have already discussed the internal distribution of turnover by segment in the chapter on the business model above. On average, the top line has grown over the last five years by 4.8 percent p.a. an.
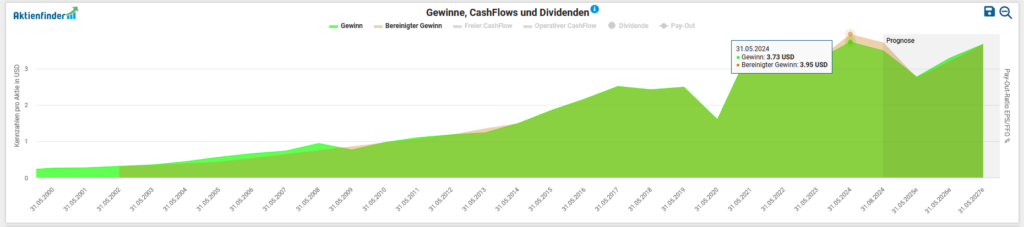
At Earnings per share we have seen a dynamic upward trend for ten years. If we take the past financial year 2024 as an example, the Adjusted earnings per share at 22.3 percent (USD 3.95 vs. USD 3.23). In the past financial year, Nike generated a Net profit from USD 5.7 billion (2023: USD 5.1 billion).
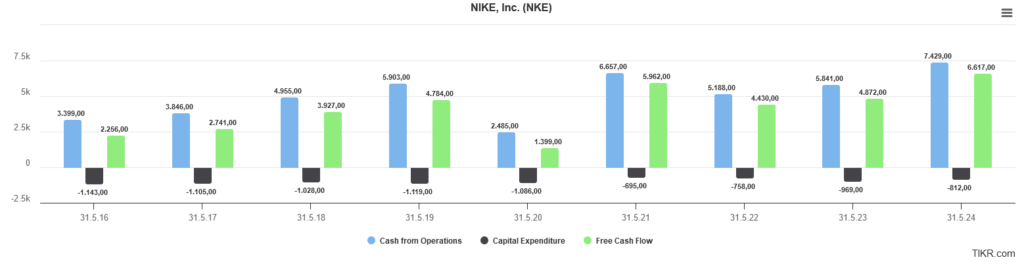
The amount available to the company Free Cash Flow can be used to repay debt, expand via company acquisitions, pay out (increasing) dividends or buy back shares. In absolute figures - which I primarily like to use - the picture of operating and free cash flow as well as capital expenditure (CapEx) for the period 2016 to 2024 is as follows:
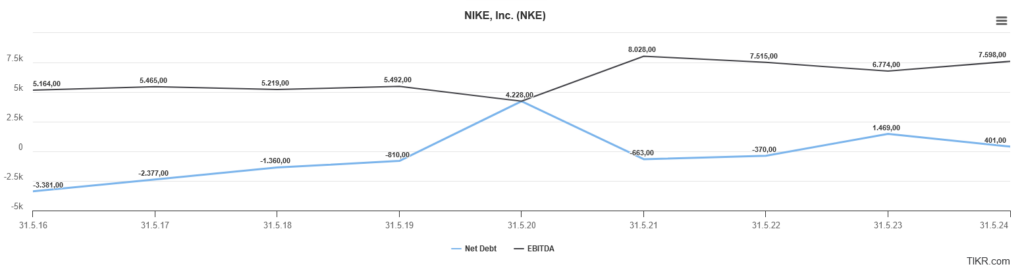
A look at the Debt situation tells us that, based on the last financial year, Nike has a share of interest-bearing financial liabilities of USD 12 bn, which in turn is offset by cash and cash equivalents and securities totaling USD 11.6 bn. If we now divide the remaining net debt of USD 0.4 billion by the most recent EBITDA of USD 7.6 billion, the result is 0.1. This result is miles below the threshold value of 3, which is considered critical. I will therefore spare myself an in-depth examination of the maturity structure of the long-term liabilities and their interest conditions.
This also explains the Investment grade Classification of the Bonität of Nike by the well-known rating agencies Standard & Poor's and Moody's.
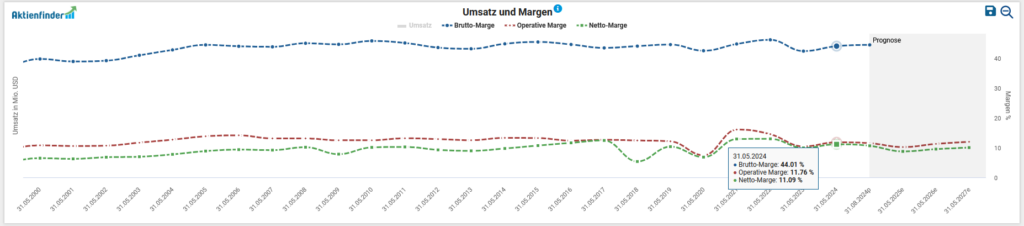
Finally, we look at the Profitability of Nike based on the development of gross, operating and net margins. The consistency of the gross margin does not apply to the operating margin. Here, the value fluctuates between 7.5 and 16 percent. With the strategic focus on direct sales, the management around ex-CEO Donahoe wanted to achieve an increase in profitability in this area.
Opportunities & risks
The already powerful brand portfolio is enhanced by the numerous sponsorships in various sports and with well-known individual athletes continuously strengthened. This global popularity of Nike as a world market leader is reflected not only in the rankings based on key financial figures, but also in the Social media down. A few months ago, the successful Conclusion with the German Football Association (DFB) with the start of 2027 caused a media sensation in German-speaking countries.
Nike is represented in almost every country in the world through its own sales to retail customers and through a mix of independent retailers, licensees and sales representatives. Currently, Iran, Russia and Vietnam are the only exceptions. In the latter case, customers can purchase Nike products through cooperation partners. Based on a healthy balance sheet, the new management can draw on the full potential to implement strategic options such as the acquisition of external companies. The takeover of the start-up focused on NFT fashion RTFKT in 2021 underlines Nike's ambition to invest in expanding business areas such as the metaverse through targeted acquisitions.
The current Restructuring in the sneaker brand portfolio in competition with rivals On Holding and Hoka as well as a planned streamlining of the corporate structure are tying up a lot of the Group's energy. Based on the meaningful metric Cash Conversion Cycle The modest development in the retail business is easy to explain, because within the Industry Nike is only in the lower midfield here.
Significant risk factors for the growth prospects on the Chinese market, which is the second most important after the US home market, include the strengthening local competition (e.g. ANTA Sports, probably the most prominent representative from China) as well as the difficult competitive conditions with state-controlled Boycott actions against foreign textile manufacturers. In general, the geographical spread of sales markets and revenue streams, but in particular external production outside the USA, results in a higher risk exposure. Active management of these risks is therefore essential (e.g. currency risks, geopolitical risks for supply chains, trade conflicts, management and administration of decentralized inventories and stockpiles).
Current valuation of the Nike share
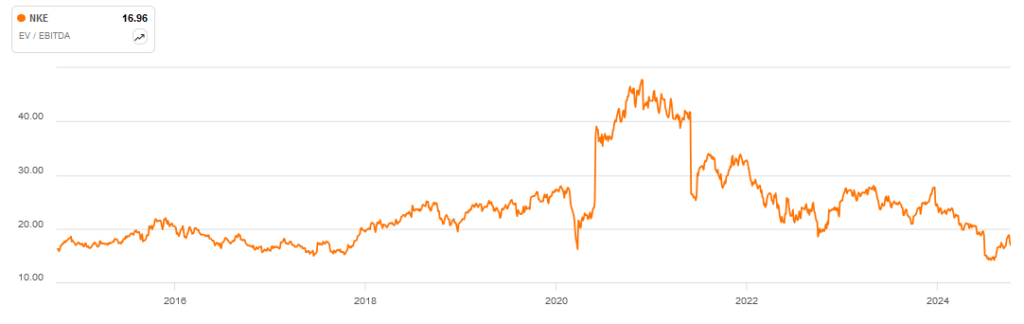
For the valuation of companies, I use the so-called Enterprise Value (EV) is used. In the case of a takeover, the EV indicates the amount required to purchase the assets required for operations and excludes the non-operating assets. I relate this key figure to operating profitability (before interest, taxes and investments (CAPEX)), expressed as EBITDA. The prevailing opinion is that a value of less than 10 indicates a „healthy valuation“ - as is always the case with generic Rules of thumb the company-specific context must be considered in the analysis by the careful investor himself. In the case of Nike, we have to consider a similar Valuation result of 17 In recent months, the US company has even been available at slightly lower prices:
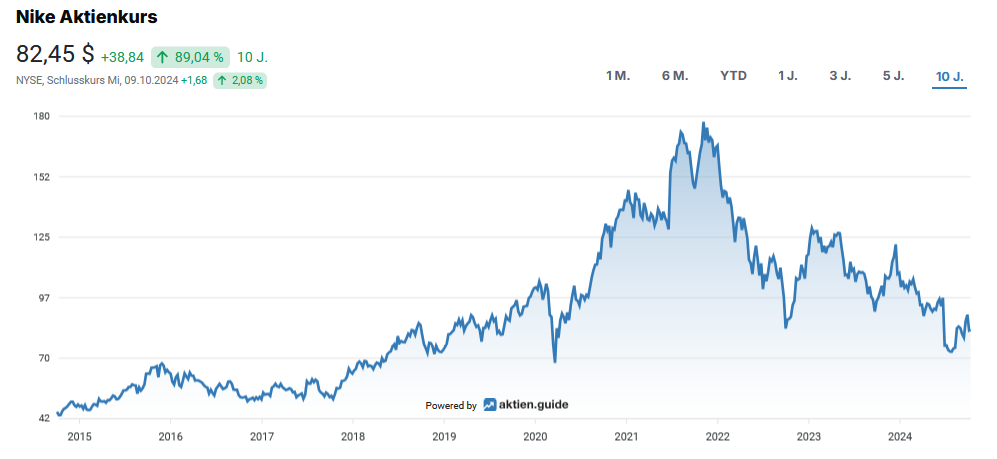
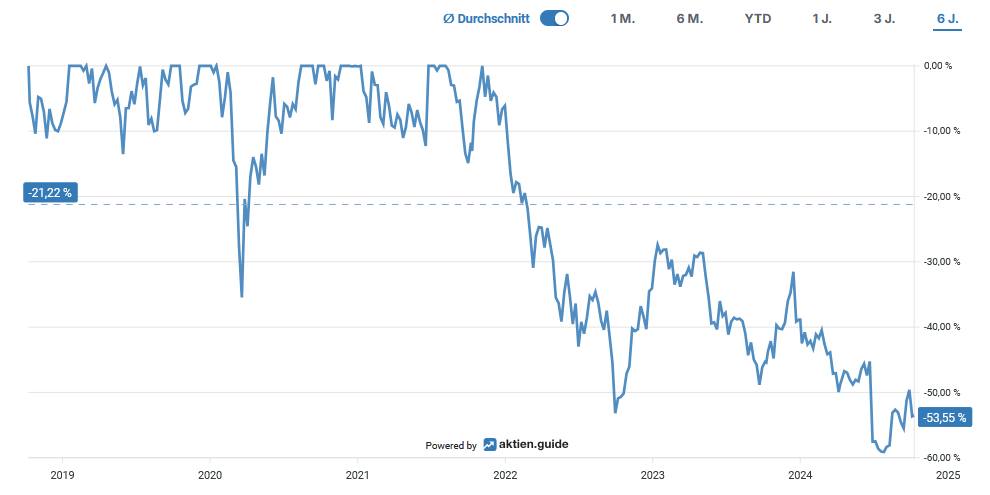
The Maximum decrease in the last six years amounted to approx. 59 percent in July of this year:
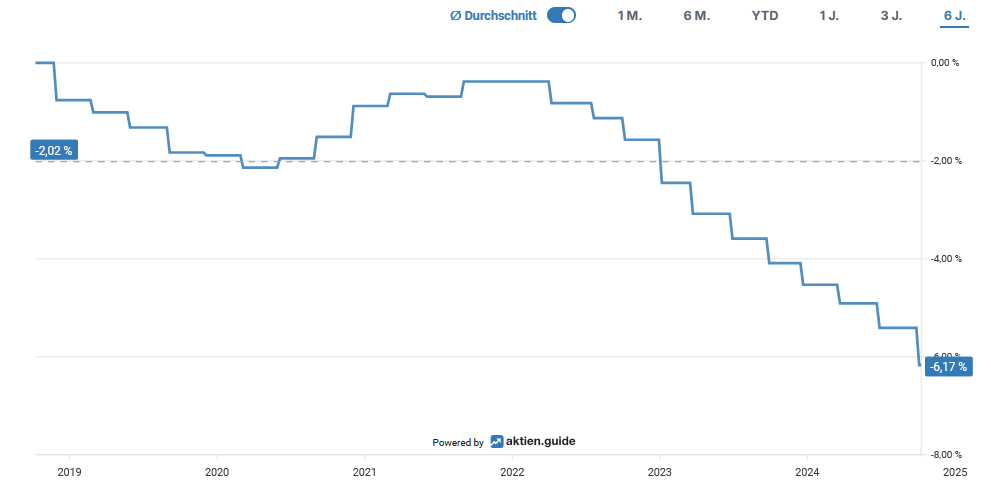
Over the last six years, an investment in Nike has yielded Total Return, including dividends received, a Overall performance from only 9.5 percent for the investor. This is hardly surprising when you look at the underwater chart:

Capital allocation of Nike
Looking at the immaculate Dividendenhistorie Nike's dividend is characterized by the fact that the sporting goods manufacturer has been distributing an annually growing dividend for 21 years. If this streak of dividend increases is extended for another four years, Nike will join the illustrious circle of dividend aristocrats:

At the current share price of USD 80.83, this results in a Dividend yield from 1.8 percent. The Five-year dividend growth rate amounts to 11.1 percent p.a. or 12.3 percent p.a. in the Ten-year period. The company last increased its share price in November last year by 8.8 percent the dividend. To round things off, here is an overview of the last five dividend increases:
- 2023: +8,8 %
- 2022: +11,5 %
- 2021: +10,9 %
- 2020: +12,2 %
- 2019: +11,4 %
The quartalsweise ausgeschüttete Dividende beträgt aktuell 0.37 USD per share and is paid out at the beginning of each quarter (January, April, July, October).
If we take the average value of the Free Cash Flow of the last three years as the basis for determining the Payout ratio we end up with a comfortable result of 41.6 percent for the payout ratio of Nike
The Number of shares outstanding reduzierte sich um 1.1 percent per year respectively 6.3 percent accumulated over the past six years.
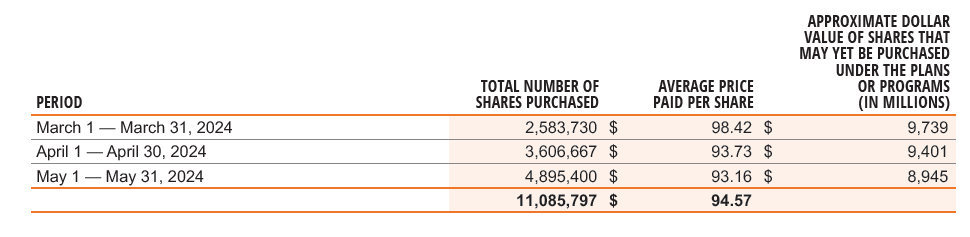
The current Aktienrückkaufprogramm includes the USD 18 billion in share buyback authorization granted to management, which runs until mid-2026:
Conclusion: Considerations for my decision to invest in Nike
The stock market has granted Nike shares a premium premium for years. Although the US company has maintained its market leadership with its charisma, this has come at an undeniably high price with valuations such as P/E ratios of over 30. The diversity of global and local competitors is increasing and is jeopardizing Nike's market position as the industry leader, and not just in growth markets such as China.
Despite all the risks and warning signs, Nike is a global market leader with a solid financial footing and an almost net debt-free balance sheet. The iconic brand and the ability to promote brand loyalty among customers with the right sports testimonials are part of Nike's DNA. Due to the immediate change at the top, the first Investor Day since 2017 has been postponed to an unknown date. The question of whether this sends the right signal to shareholders can probably only be answered when the new strategy is presented. At the current price level, the Nike share remains a candidate for a top-up.

