Your Broker for worldwide trading

DGI sample portfolio: The report on the 2nd quarter of 2025

One worrying political headline follows the next. One of the best-known financial market proverbs about the short legs of political stock markets may have always been true in essence from a long-term perspective. In this review of the DGI model portfolio, I provide a transparent insight into the performance of the individual stocks in the portfolio in the first quarter of 2025, calculate the total return and take a look at the performers and laggards in the portfolio.

Facts and figures for the 2nd quarter of 2025

Let's start by looking at the overall portfolio level before I turn my attention to the individual stocks in the next chapter. The DGI model portfolio was filled with a starting capital of 100.000 Euro. As of 30.06.2025, approx. 75,000 euros or three quarters of the total amount invested.

The following chart shows the positive development of the dividend ladder. Since the portfolio was launched, the companies have paid me a total of around 2,500 Euro to my cash account.
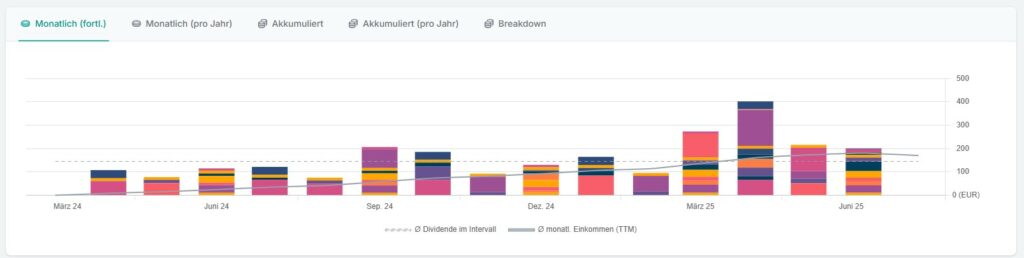
Bar chart showing monthly income in euros from March 2024 to June 2025, with cumulative totals and color-coded income sources.
Dividend performance since inception (source: parqet)

Taking all investments into account, I expect a Liquidity reserve from around 27,500 euros into the third quarter of 2025. Unrealized gains amount to just under 1,700 Euro. Here is a brief summary of all relevant depot components:

Start-up capital 22.03.2024100.000,00
Invested capital75.108,96
Unrealized capital gains1.678,98
Terminal value 30.06.202576.787,95
Free start-up capital at the end of Q2 202524.891,04
Dividends received2.465,49
Total liquidity reserve 31.03.202527.356,53

The personal dividend yield beträgt aktuell 2.9 percentThis corresponds to an increase of 30 basis points compared to the previous quarter. As a reminder of the calculation method: only the dividends actually received are divided by the total invested capital.

In the 2nd quarter of 2025, the portfolio recorded a return gain of 0.8 percent. Here I consider the Total Returni.e. (un)realized capital gains and dividends received are added together.

A line chart with shaded areas shows the percentage changes from -10% to +5% between April and June 2025, with the transition from the negative to the positive range occurring around the beginning of May.
Performance in the 2nd quarter of 2025 (source: parqet)

In view of the turbulence from the beginning of April in the wake of the trade conflict and the geopolitical turmoil in the Middle East, the return of just under two percent achieved at the end of the quarter was the result of an early recovery. This pleasing development is reflected almost identically in the broad FTSE-All-World market index.

As mentioned several times, the short period under review - the portfolio was launched in March 2024 - does not yet provide any significant insight into the performance of the portfolio. The aim is for the individual stocks in the portfolio to develop over the long term of ten years. That is why we are moving straight on to the next flight level and the individual stocks.

Deep-dive single stocks

At the end of June, a total of 27 Assets in the custody accountwhereby these are exclusively individual values. The following First purchases in chronological order.

Purchase dateCompany (Ticker)Total investment in €Quantity
04.04.2025Comfort Systems USA (FIX)2.828,6010
07.04.2025Visa (V)1.442,775
08.04.2025Munich Re (MUV2.DE)2.625,005
08.04.2025Tractor Supply (TSCO)2.163,0250

Comfort Systems USA is a leading building technology company in the United States. Founded in 1997, the company specializes in providing comprehensive services for heating, ventilation and air conditioning (HVAC) and electrical systems. Comfort Systems USA offers a wide range of services, including design, installation, maintenance and repair of HVAC systems for both commercial and industrial customers.Another area of Comfort Systems USA's business is building automation. The company offers systems that make it possible to centrally control and monitor various building functions, such as lighting, temperature and security.

In addition to Mastercard Visa as the world's leading payment technology company specializing in electronic payments between consumers, businesses and banks. Founded in 1958 as BankAmericard in California, Visa has evolved into a global network that provides secure and reliable payment solutions. Visa operates one of the largest payment networks in the world, enabling transactions in more than 200 countries and territories. The IT company with a focus on the financial industry offers a wide range of products and services, including credit, debit and prepaid cards as well as digital payment solutions.

With a global presence, the Munich Realso known as Munich Re, is the largest reinsurance company. Reinsurance services for primary insurers form the basis of Munich Re's business model. The company is known for its expertise in the assessment and coverage of complex risks, including natural catastrophes, major losses and innovative insurance products. In addition to reinsurance, Munich Re is also active in the primary insurance market, particularly through its subsidiary ERGO Group, which offers a wide range of insurance solutions for private and business clients.

Tractor Supply Company is a US retail company based in Brentwood, Tennessee. The company specializes primarily in locations in rural areas of the USA, where it sells small agricultural equipment and materials for livestock farming as well as items for the home and garden. The company under the stock ticker TSCO retailer offers a wide range of products for farmers, ranchers and nature-loving people who pursue a hobby in agriculture, gardening or farming in their free time. The "Neighbor's Club" as a customer loyalty program as well as the logistics system established over the years are notable competitive advantages that contribute to strong customer satisfaction.

To complete the list, here is the list with a total of three additional purchases in the 2nd quartersorted by date of purchase:

Purchase dateCompany (Ticker)Total investment in €Quantity
07.04.2025Microchip Technology (MCHP)1.763,3950
16.05.2025UnitedHealth (UNH)752,483
27.06.2025LVMH (MC.PA)900,002

Below you will find the "admirable" Top performer and "unfortunate" Stragglers since the start of the DGI model portfolio, calculated in euros as the currency basis. I will explain the reasons for this in the next Webinars in more detail on July 10. Click here to register for free.
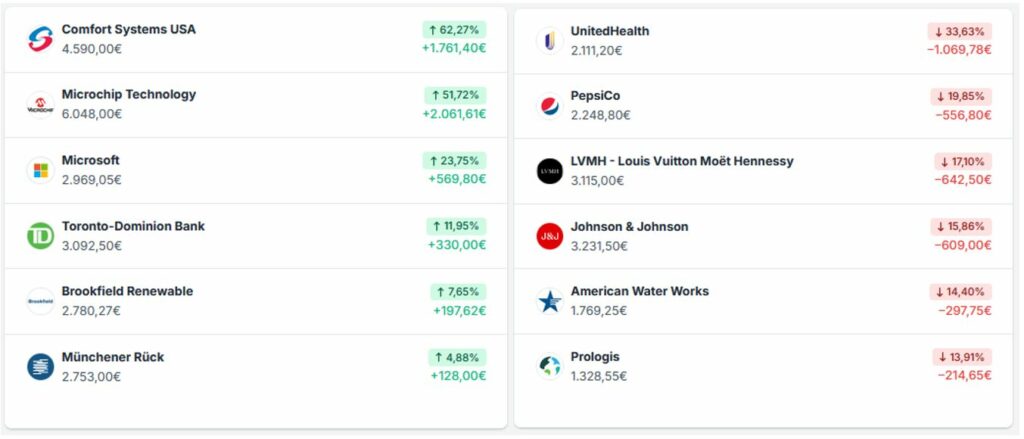
A list of company shares with the percentage changes, with Comfort Systems USA leading in gains and UnitedHealth showing the largest loss. Green stands for profits, red for losses.
Performers & laggards in Q2 2025 (source: parqet)

Diversification & Allocation

In my investment strategy, the Portfolio diversification a proven way to adequately manage the unsystematic risks and is therefore, in addition to the position size, an integral part of my Risk management represent. Let us now take a closer look at the status of diversification according to different characteristics such as sectors, countries or company sizes.

With regard to the fundamental question of whether the current tax rate should be used as the Market value or the value of the original invested capital I have meanwhile opted for the market value. I justify this because of the small discrepancy in the final result between the two reference figures. I will continue to keep an eye on the rule that no company should account for more than five percent of the invested capital, but this does not yet play a significant role at this stage of portfolio construction.

Let's start by looking at the composition of the portfolio on the basis of the Individual valuesthe situation is as follows. The chart on the right shows the top 10 by market value.
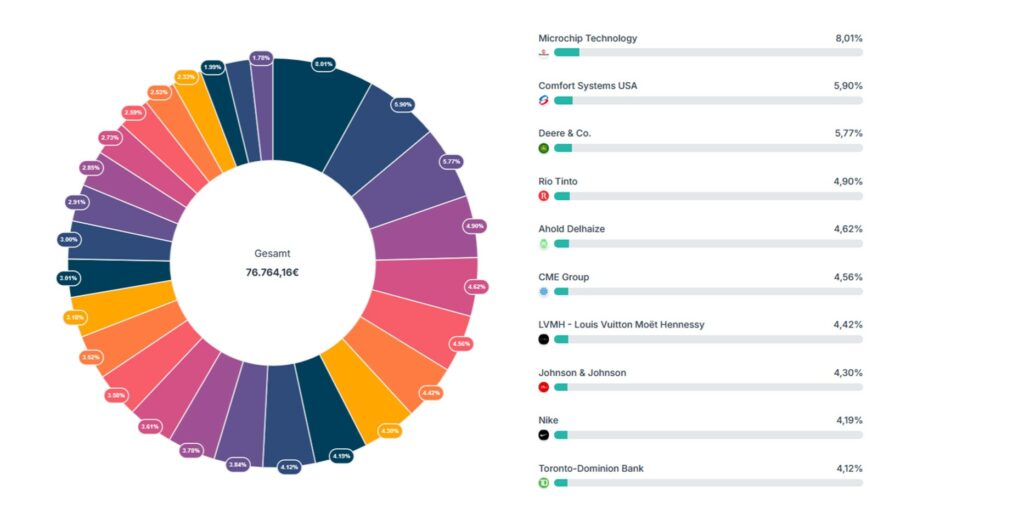
A donut chart shows the percentage shareholdings of various companies with a legend indicating the names of the companies and their respective shares, from 8.01 % to 4.51 %.
Position sizes of all individual stocks from the DGI model portfolio measured by market value (source: parqet)

Based on the "Global Industry Classification Standard" I invest in the eleven sectors along the various value chains of the different industries that are important in our economy. It therefore makes sense to examine the actual status compared to the target status. I am still in the middle of setting up the DGI model depot. Stubbornly sticking to the Target allocationwhich I show in the next graphic, does not seem necessary for the time being:
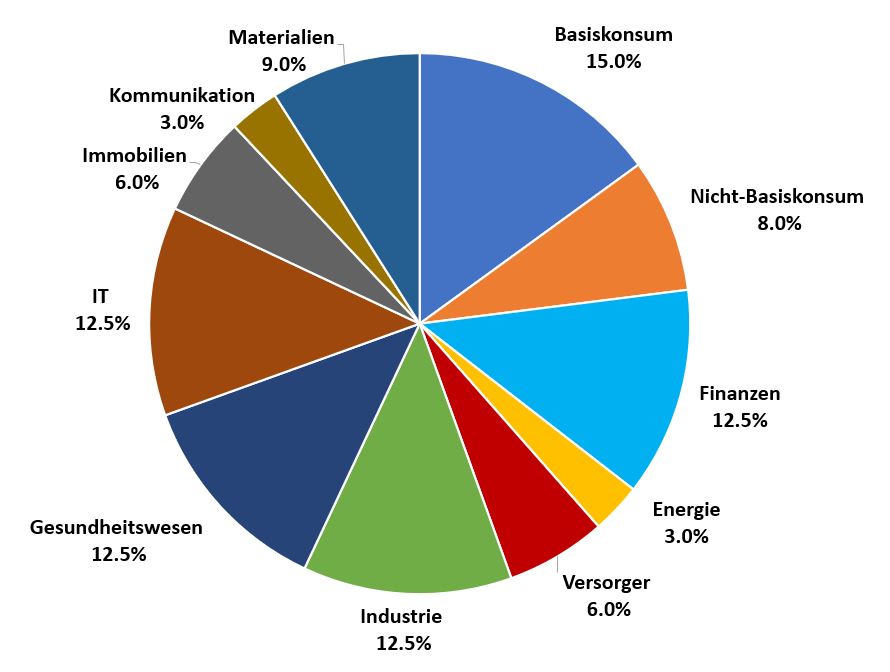
A pie chart shows the distribution of the sectors: Basic consumption 15%, non-basic consumption 8%, finance 12.5%, energy 3%, utilities 6%, industry 12.5%, healthcare 12.5%, IT 12.5%, real estate 6%, communications 3%, materials 9%.
The target allocation at sector level for the DGI model portfolio (source: own illustration)

Finally, the following results Situation picture on sector distribution:

A donut chart shows the distribution of the €76,764.10 in securities across the individual sectors, with industrials (15.19%) and IT (14.38%) representing the largest shares. List of sectors and percentages on the right.
The sector distribution in the DGI sample portfolio (source: parqet)

The Geographical spread I believe that investing across different countries and currency areas is an essential part of risk management. There are no fixed limits as to how much I want to invest in which country. My thoughts on this are quite simple: just because an organization has its corporate headquarters in country A, this does not automatically mean that this group only generates its sales from operating activities in its home country. But now we come to the Country allocation:

A donut chart shows the distribution of the portfolio by country, with the USA holding 59.10 %, followed by Canada with 11.42 % and other countries with less than 8 % each. Total value: € 76,784.74.
The country distribution (source: parqet)

Outlook

All in vain?! If we were to connect the two price markers from the beginning of April and May 1 as the end point with a line, the result would be a straight line without a major rise or fall. One could get the immediate impression that supposedly little happened in between. In the US leading index S&P 500, we are back above the level before US President Donald Trump made the fateful "Liberation Day" exclaimed. Does this interim result aptly describe the notoriously short legs of political exchanges? So was all the fuss about tariffs and announcements of retaliation by affected countries for nothing? Everything is and remains in flux.

The law of the series persistently continues. As if the US president had a natural monopoly on the right headline. With him, there is definitely no danger of boredom. It would be almost ignorant not to say a single word about the new bill (commonly known as the "One Big Beautiful Bill Act"). The financial media have done this job and have sufficiently highlighted the "Section 899" contained in it, which is now obsolete in its original form, as a supposed spectre for foreign investors. Waving the reconciliation bill through would also have had a disastrous impact on the world's most liquid capital market, which would have primarily affected US investors negatively. If US assets become less attractive to international investors, the outflow of money would hardly be compensated for by domestic investors.

Let's get back to the actual topic of investing. It is hardly surprising that, on the basis of the latest company figures and quite positive analyst assessments, the Valuation level in the leading US index S&P 500 remains at an unbroken ambitious level - despite the brief dip in April.
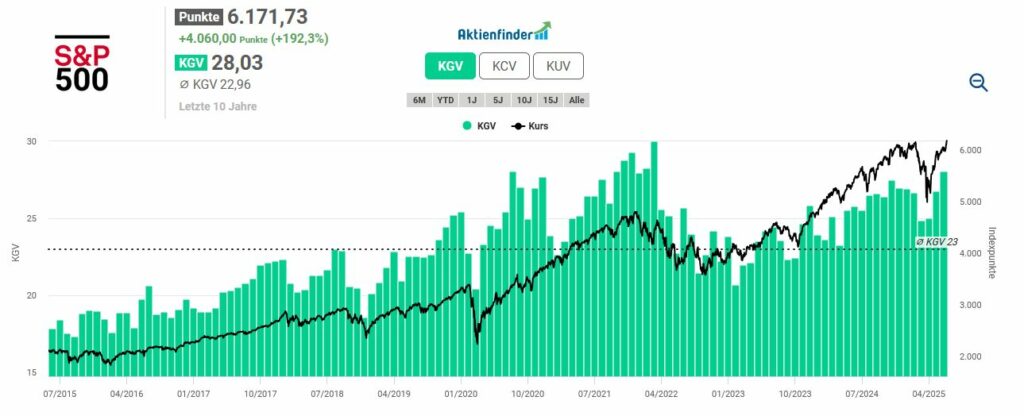
Bar chart of the S&P 500 price/earnings ratio (P/E ratio) from 2014 to 2024, with green bars for the P/E ratio and a black line for the S&P 500 index value, both with an upward trend.
The valuation and price performance of the S&P 500 over the last ten years (source: Aktienfinder)

With 27 investments in my portfolio, I am sufficiently represented in the relevant sectors for the time being. I have taken advantage of the lower price levels in the wake of the customs conflict to buy one or two shares. Broken down into the eleven sectors, the distribution of companies is as follows:
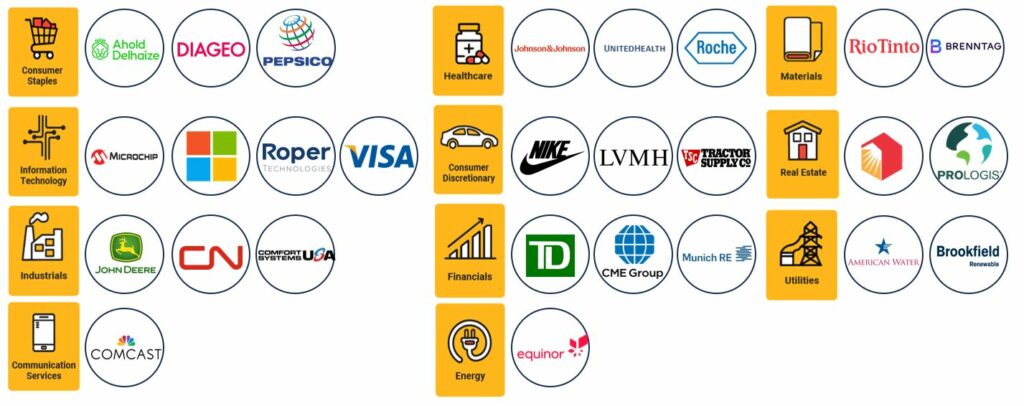
A chart with company logos grouped by sector: Consumer Staples, Information Technology, Industrials, Communication Services, Health Care, Consumer Discretionary, Financials, Energy, Materials, Real Estate and Utilities.
Overview of individual stocks in the DGI model portfolio (source: own presentation)

The same question applies to all companies in the portfolio: at what price am I ultimately prepared to become active on the stock market? After all, it is not without good reason that common stock market literature Patience as a virtue touted. Characteristics such as "long-term oriented asset accumulation", "discipline" or "perseverance" are often associated with the patient investor type. The greater the fluctuations on the stock market and the higher the volatility, the more it tugs at your nerves. In the context of investing, I refer to the conscious investment decision to do nothing as the third optionwhich is open to all of us in addition to buying and selling shares.

Patient investing also means continuously practicing your skills. As active self-decision maker I try to understand and master the basics and also apply them in practice. It is probably human nature to be driven by short-term issues and questions in the here and now that we want to have answered quickly. I certainly don't exclude myself from this.

Nevertheless, things will remain varied in the future. I fear that there will still be a few unexpected twists and turns in the laborious customs zigzag. As private investors with a long-term investment horizon, we will encounter such phases of increased uncertainty more often, that much is certain. We have to be prepared for this on and off the stock markets. It has never been a very smart idea to panic on the stock market and sell shares erratically as we did this April. The motto is not to get carried away by political skirmishes.


THE NEXT WEBINARS WITH CLEMENS FAUSTENHAMMER AT CAPTRADER

Ein professionelles Porträt eines lächelnden Mannes namens Clemens Faustenhammer in dunkler Jacke und blauem Hemd vor unscharfem Hintergrund.
Clemens Faustenhammer

The private investor from Austria Clemens Faustenhammer with a focus on dividend growth stocks and total return, lives with his family near Vienna. As a graduate in business administration with a strong passion for economic history, he has held various management positions in the financial sector for over a decade. The stock market plays an important role both professionally and privately. He has been investing in the capital market since 2005, with a particular focus on individual stocks for the past ten years.

View all posts
Mandatory information and disclaimer

This is a marketing communication within the meaning of Section 63 (6) of the German Securities Trading Act and does not contain investment strategy recommendations, investment recommendations or financial analyses in accordance with Section 85 of the German Securities Trading Act and Article 20 of the Market Abuse Regulation. It therefore does not fulfill the legal requirements to guarantee the objectivity of investment strategy recommendations/investment recommendations/financial analyses. CapTrader GmbH or its employees are therefore not legally prohibited from trading or providing services in the securities products mentioned therein prior to publication of the information.

Past performance, simulations or forecasts are not a reliable indicator of future performance. Mandatory information and limitation of liability for CapTrader and any third-party content providers can be found at https://www.captrader.com/marketingmitteilung/angaben
Please note that investing in financial instruments involves high risks and take note of our disclaimer and the mandatory legal information at the locations indicated.

  1. Mandatory information

Responsible: CapTrader GmbH, Elberfelder Straße 2, 40213 Düsseldorf; Commercial Register Number: HRB 86537 Düsseldorf Local Court; VAT ID DE323771603; Managing Directors Andreas Weiß, Christian Weiß, Michael Heyder; Tel: +49 211-740786-00, Fax: +49 211-740786-90.

Zuständige Aufsichtsbehörde: Bundesanstalt für Finanzdienstleistungsaufsicht, Graurheindorfer Straße 108, D – 53117 Bonn und Marie-Curie-Str. 24-28 D – 60439 Frankfurt am Main, Tel: 0228 4108 – 0 Fax: 0228 4108 1550 E-Mail: poststelle@bafin.de; Institutsnummer 10156708

Conflicts of interest CapTrader in marketing communications: CapTrader GmbH confirms that it does not hold any positions in the mentioned financial instruments beyond the positions mentioned in the marketing communication itself, if applicable. There are also no other conflicts of interest within the meaning of CapTrader GmbH's Financial Analysis and Marketing Communication Policy.

Conflicts of interest and mandatory disclosures by the third-party content provider for marketing communications with financial instrument recommendations: See under https://www.captrader.com/marketingmitteilung/angaben  to creators of third-party content

The copyright to the marketing communication is reserved. Reprinting and distribution is only permitted with our consent.

  1. Disclaimer

By accepting the content, the recipient accepts the binding nature of the limitation of liability.

a) Disclaimer for third-party content

CapTrader GmbH offers authors - such as editors, guest commentators, agencies and companies - the opportunity to publish comments, analyses, news and company announcements. Their opinions do not necessarily reflect the opinions and views of CapTrader GmbH and its employees. CapTrader GmbH assumes neither liability nor guarantee for this content. This applies in particular to incomplete or incorrectly reproduced reports, incorrect price information and editorial errors. Liability claims relating to material or immaterial damage caused by the use or non-use of the published information or by the use of incorrect or incomplete information are fundamentally excluded.

b) Exclusion of liability for CapTrader's own content

CapTrader has taken its own information in this marketing communication from sources believed to be reliable, but has not verified all such information itself. Accordingly, CapTrader makes no warranties or representations as to the accuracy, completeness or correctness of the information or opinions contained herein. Subsequent changes cannot be taken into account. The marketing communication does not constitute an offer or solicitation to buy shares of the issuer and is in no way a substitute for advice appropriate to the investor and the property. We cannot verify whether the information in the marketing communication is in line with your personal investment strategies and objectives. We recommend that you consult an investment advisor for advice that is appropriate to the investor and the property. The marketing communication cannot and should not replace a securities prospectus and/or expert investment advice required for an investment. It can therefore never be the sole basis for an investment decision. By accepting the marketing communication, the recipient accepts the binding nature of the above limitation of liability.

CapTrader provides the information despite careful procurement and provision only without guarantee for the correctness / completeness, timeliness or accuracy and availability of the stock exchange and economic information, prices, rates, indices, general market data, valuations, assessments and other accessible content held and displayed for retrieval. This also applies to third-party content. Historical observations and forecasts are not a reliable indicator of future developments. The facts presented in particular in connection with product information are for illustrative purposes only and do not permit any statements to be made about future profits or losses. Any conditions stated are to be understood as non-binding indications and are dependent on market developments on the day of conclusion.

CapTrader accepts no liability for any direct or indirect damage caused by and/or related to the distribution and/or use of this marketing communication.

The information, opinions and statements correspond to the status at the time of preparation of the marketing communication. They may be outdated due to future developments without the publication being changed.

CapTrader is not obliged to update, amend or supplement the information in this marketing communication if a circumstance mentioned in this publication or a statement, estimate or forecast contained therein changes or becomes inaccurate. The presentation of the performance of financial instruments over previous periods does not provide a reliable indication of their future performance. No guarantee can therefore be given for the future price, value or income of any financial instrument mentioned in this publication.

Despite careful control of the content, we assume no liability for the content of external links. The operators of the linked pages are solely responsible for their content.

Distribution: This publication may only be distributed in accordance with the laws of the respective countries, and persons in possession of this publication should inform themselves about the applicable local regulations. The information contained herein is not intended for natural or legal persons who, due to their place of residence or business, are subject to a foreign legal system that imposes restrictions on the distribution of such information. The contents are therefore exclusively in German. In particular, this publication contains neither an offer nor an invitation to purchase securities to citizens of the USA, Great Britain and Australia.

Taxes: The tax treatment of financial instruments depends on the personal circumstances of the respective investor and may be subject to future changes, which may also have a retroactive effect.

Historical observations and forecasts are not a reliable indicator of future developments. The facts presented in particular in connection with product information are for illustrative purposes only and do not permit any statements to be made about future profits or losses. Any conditions stated are to be understood as non-binding indications and are dependent on market developments on the day of conclusion.

CapTrader accepts no liability for direct or indirect damage caused by and/or in connection with the distribution and/or use.

The information, opinions and statements correspond to the status at the time of preparation of the marketing communication. They may be outdated due to future developments without the publication being changed.

CapTrader is not obliged to update, amend or supplement the information if a circumstance mentioned in this publication or a statement, estimate or forecast contained therein changes or becomes inaccurate. The presentation of the performance of financial instruments over previous periods does not provide a reliable indication of their future performance. No guarantee can therefore be given for the future price, value or income of any financial instrument mentioned in this publication.

Despite careful control of the content, we assume no liability for the content of external links. The operators of the linked pages are solely responsible for their content.

Distribution: This publication may only be distributed in accordance with the laws of the respective countries, and persons in possession of this publication should inform themselves about the applicable local regulations. The information contained herein is not intended for natural or legal persons who, due to their place of residence or business, are subject to a foreign legal system that imposes restrictions on the distribution of such information. The contents are therefore exclusively in German. In particular, this publication contains neither an offer nor an invitation to purchase securities to citizens of the USA, Great Britain and Australia.

Taxes: The tax treatment of financial instruments depends on the personal circumstances of the respective investor and may be subject to future changes, which may also have a retroactive effect.

Email:

info@captrader.com

Send e-mail

Phone:

Hotline (Germany)
0800-8723370

Hotline (International)
00800-08723370

Further contact options