


In this review of the DGI model portfolio, I provide a transparent insight into the performance of the individual stocks in the portfolio in the third quarter of 2025, determine the total return and take a look at the performers and laggards in the portfolio. I also report on the latest changes in the portfolio.
Facts and figures for the third quarter of 2025
To begin with, I will look at the overall portfolio level before turning to the individual stocks in the next chapter. The DGI model portfolio is filled with a starting capital of 100.000 Euro. As of 30.09.2025, approx. 76,000 euros or three quarters of the total amount invested.
The following chart shows the long-term positive development of the dividend ladder. Since the portfolio was launched, the companies invested in the portfolio have paid me a total of around 3,000 euros to my cash account.
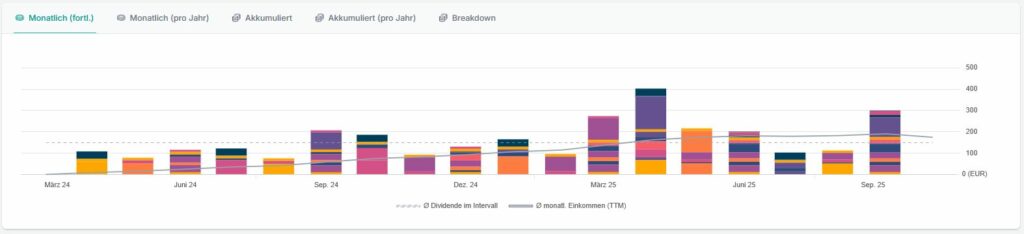
Taking all investments into account, I expect a Liquidity reserve from around 27,000 euros into the fourth quarter of 2025. Unrealized gains amount to just under 4,200 Euro. All relevant depot components are summarized here in a table:
| Start-up capital 22.03.2024 | 100.000,00 |
| Invested capital | 75.989,60 |
| Unrealized capital gains | 4.174,10 |
| Final value 30.09.2025 | 80.163,70 |
| Free starting capital End of Q3 2025 | 24.010,40 |
| Dividends received | 2.979,88 |
| Total liquidity reserve 30.09.2025 | 26.990,28 |
The current personal dividend yield exactly 3 percent, This corresponds to an increase of 10 basis points compared to the previous quarter. As a reminder, the calculation method: only the dividends actually received are divided by the total invested capital.
In the third quarter of 2025, the model portfolio recorded a return gain of +4.8 percent. Here I consider the Total Returni.e. (un)realized capital gains and dividends received are added together.
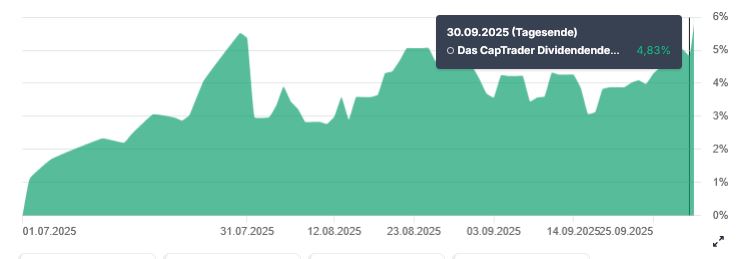
As mentioned several times, the short period under review - the portfolio was launched in March 2024 - does not yet represent a significant gain in knowledge for this review of the portfolio's performance. The aim is for the individual stocks in the portfolio to develop over the long term of ten years. That is why we are moving straight on to the next flight level and the individual stocks.
Deep-dive single stocks
At the end of September, a total of 27 Assets in the custody account, The shares are exclusively individual stocks. In the third quarter two additional purchases as follows in chronological order:
| Purchase date | Company (Ticker) | Total investment in € | Quantity |
|---|---|---|---|
| 06.08.2025 | UnitedHealth (UNH) | 428,72 | 2 |
| 11.08.2025 | Prologis (PLD | 451,92 | 5 |
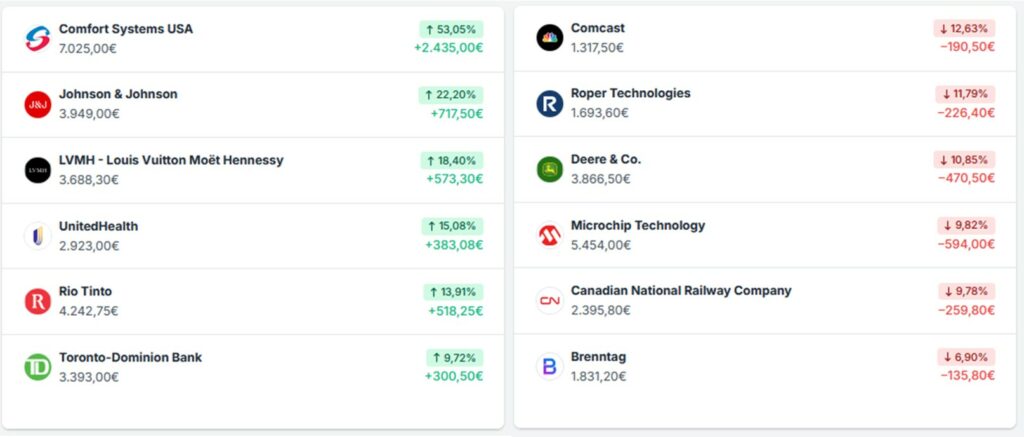
Below you will find the "admirable" Top performer and "unfortunate" Stragglers since the start of the DGI model portfolio, calculated in euros as the currency basis. I will provide more details on this in the next Webinars on October 20 give. Click here to register for free.
Diversification & Allocation
In my investment strategy, the Portfolio diversification This is a tried and tested way of adequately managing unsystematic risks and is therefore an integral part of my risk management process, alongside position size management. Risk management represent. Let us now take a closer look at the status of diversification according to different characteristics such as sectors, countries or company sizes.
In a fundamental question as to whether the basis of assessment should now be the currently traded Market value or the value of the original invested capital (i.e. the acquisition costs), I decided to use the market value. I justify this because of the small discrepancy in the final result between the two reference figures. I will continue to keep an eye on the rule that no company should account for more than five percent of the invested capital, but this does not yet play a significant role at this relatively early stage of portfolio construction.
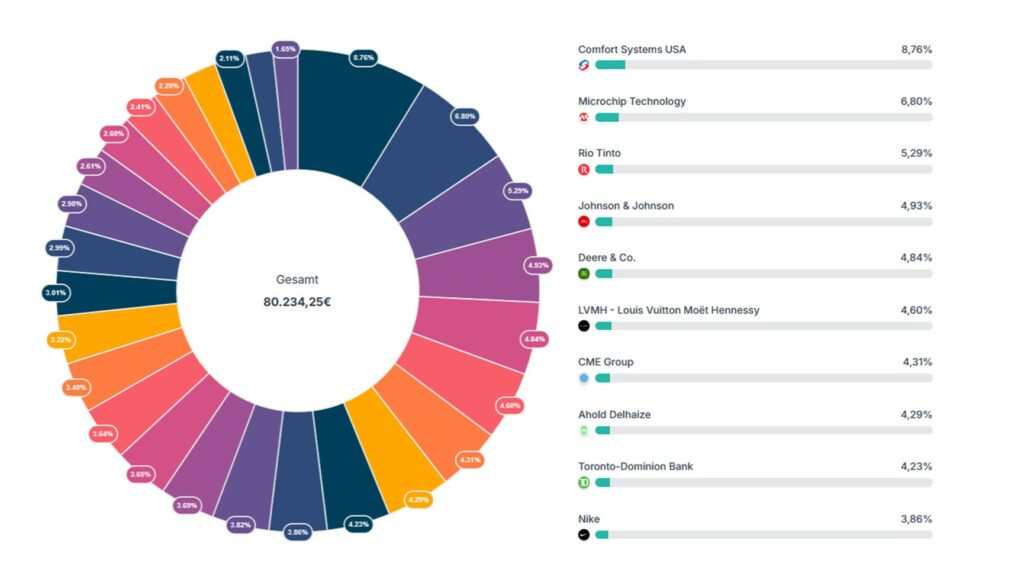
Let's start by looking at the composition of the portfolio on the basis of the Individual values, the situation is as follows. The chart on the right shows the top 10 companies weighted by market value.
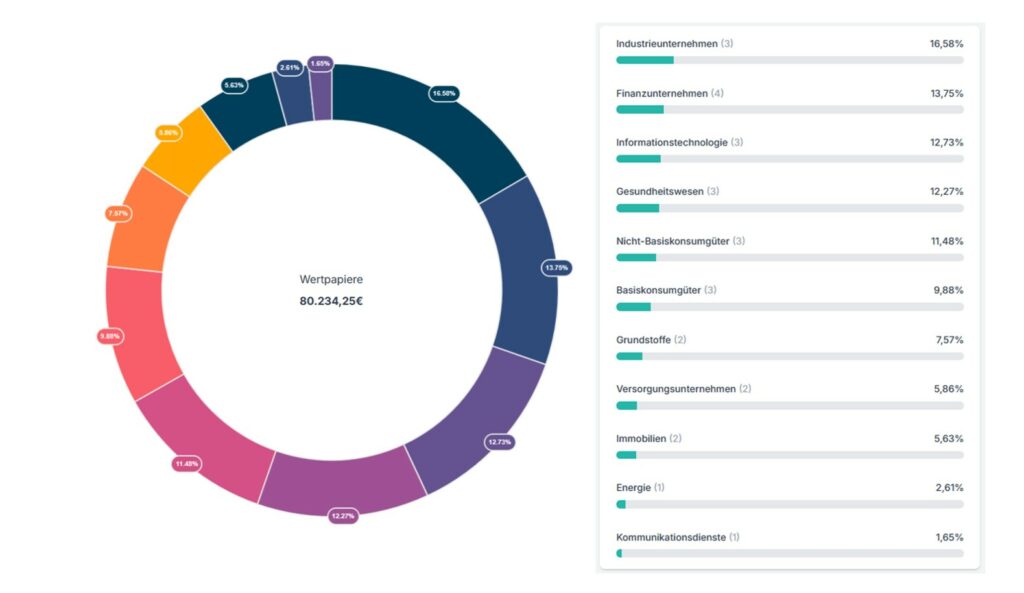
Based on the "Global Industry Classification Standard" I invest in the eleven sectors along the various value chains of the different industries that are important in our economy. It therefore makes sense to examine the actual status compared to the target status. I am still in the middle of setting up the DGI model depot. Stubbornly sticking to the Target allocationwhich I show in the next graphic, does not seem necessary for the time being:

Finally, the following results Situation picture on sector distribution. Financial and industrial companies are currently the most strongly represented in the portfolio.
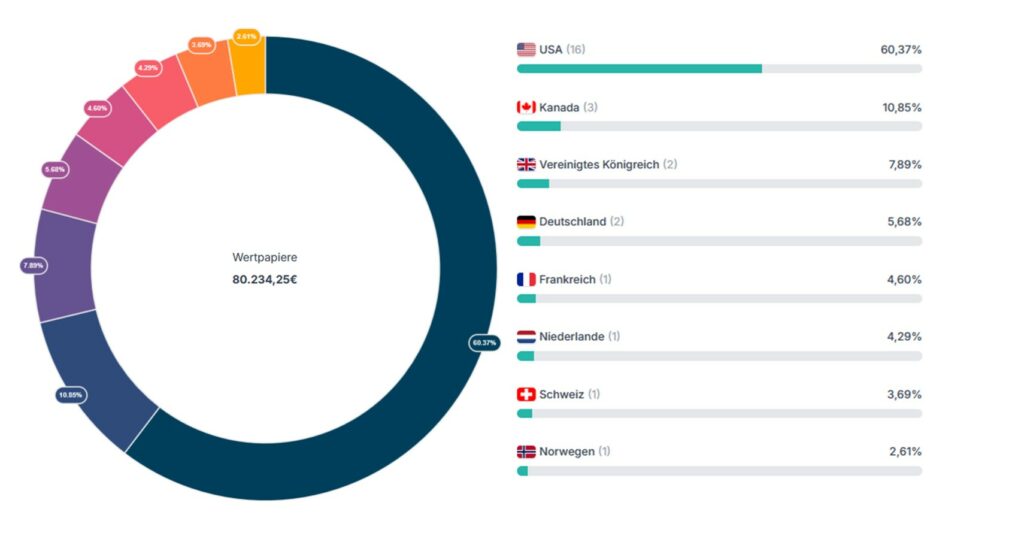
The Geographical spread I believe that investing across different countries and currency areas is an essential part of risk management. There are no fixed limits as to how much I want to invest in which country. My thoughts on this are quite simple: just because an organization has its corporate headquarters in country A, this does not automatically mean that this group only generates its sales from operating activities in its home country. But now we come to the Country allocation:
Outlook
Rising national budget deficits in the USA and the European Union are currently highlighting the fragile balance between public financing and investment and long-term stability for companies. The legitimate question remains unanswered: can we really afford all this? While the government in Washington is pushing ahead with billions in investments in key technologies such as semiconductors and artificial intelligence - often supported by close ties between the government and companies, such as in the case of Intel or Nvidia - the political ability to act is reaching its limits at the same time. The government shutdown in the United States that began at the start of October highlights the extent to which fiscal blockades and political polarization are hampering the ability to act economically and causing additional uncertainty on the markets.
Anyone who is blessed with a long-term investment horizon and always invests in the stock market with their underlying goals in mind knows that even these dark clouds will pass. At the „Austria Roadshow“ organized by CapTrader in Graz, Linz and Vienna at the end of September, I was able to personally exchange views on fundamental aspects of investing in many conversations.
Right at the start of my presentation, in which I talked for around an hour about the key points of my investment strategy, I addressed a fundamental question: Why actually invest in the stock market? The book „Start with Why“ is now a classic. In it, Simon Sinek explains the concept of "Golden Circle“, consisting of three elementary questions: Why, How and What. The meaning of action should not only be sought in the external results (What) or processes (How), but above all in the deep “Why” - the personal meaning and purpose that provides motivation and brings long-term success and fulfillment.
I can only agree with this quintessence. Investing is hopefully not a substitute satisfaction in life. People know not only what they do, but more importantly why they do it - that is, their deeper purpose, conviction or drive that emotionally influences behavior and decisions. This influence is much stronger than mere rational arguments.
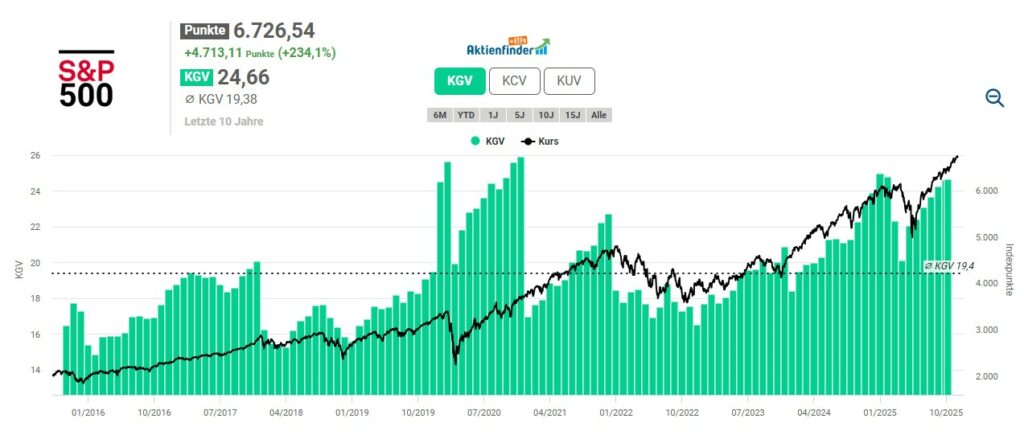
With each quarterly report, I look at the index level using the S&P 500 to gain an initial sentiment picture for the current valuation measured by the price/earnings ratio (P/E ratio). I am aware of the valid reasons why the P/E ratio at index level should be interpreted with caution. Distortion due to outliers, disproportionate influence by the heavyweights („big tech“ or „AI boom“), changes in the index composition in historical comparison, etc. Be that as it may. At 24.7, the P/E ratio is currently 5 points above the ten-year average. The S&P 500 therefore appears to be heavily overvalued overall in the selected period.
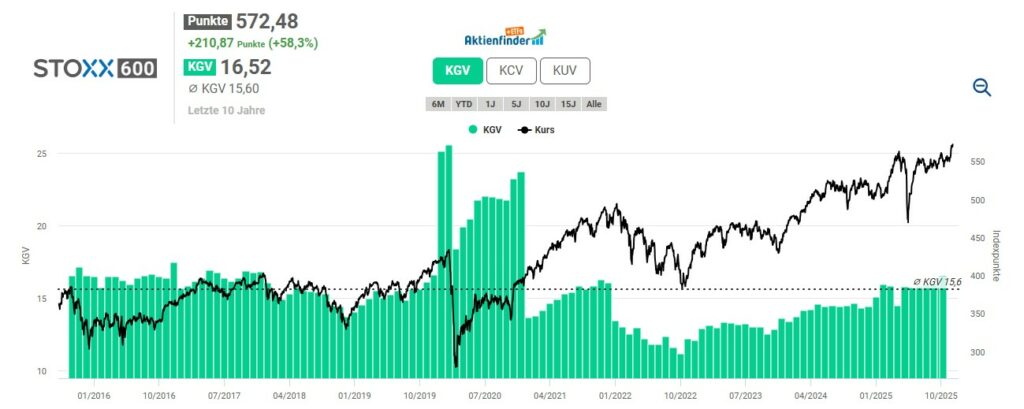
The STOXX Europe 600, which tracks the market situation in Europe, comprises the 600 largest listed companies in Europe and, unlike the EURO STOXX 50, is not limited to the eurozone. Important countries such as Denmark, the UK, Norway and Switzerland are also included in this index. On average over the last ten years, the STOXX Europe 600 was valued at a P/E ratio of 15.6, which currently stands at 16.5 and represents a moderate overvaluation overall.
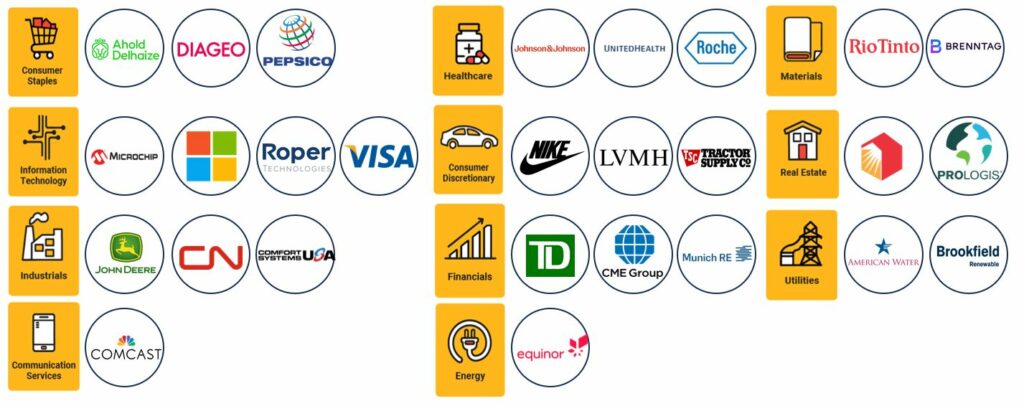
With 27 investments in my portfolio, I believe I am sufficiently represented in the relevant sectors. Broken down into the eleven sectors, the distribution of companies is as follows:
As explained above, I was very reluctant to make additional purchases in the past quarter. It is also an integral part of the investment process to carry out an ongoing portfolio analysis to systematically identify suitable buy-back candidates. In the end, it is a discretionary decision as to whether I find an interesting stock or leave the cash reserve untouched. Since the beginning of the year, the model portfolio has gained just under 7.5%, which makes me happy in view of the strong euro and the weak dollar with a US share of just under 60%. Currency fluctuations are beyond my control. From a cost-benefit perspective, hedging these risks does not seem expedient to me.

