


The turn of the year is a good time to take stock and look ahead to what lies ahead in the still young new year. With a look back at the DGI sample depoI provide a transparent insight into the performance of the individual stocks in the portfolio over the past year, calculate the total return and take a look at the performers and laggards in the portfolio.
Facts and figures about 2024
To begin with, let's take a look at the overall portfolio level at the highest flight level before I move on to the level of the individual stocks in the next chapter. The DGI model portfolio was filled with a starting capital of 100.000 Euro. As of 12/31/2024, approx. 57,000 euros invested.
The next chart impressively illustrates the positive development of the dividend ladder. In total, the companies paid me around 1,150 Euro to my cash account.
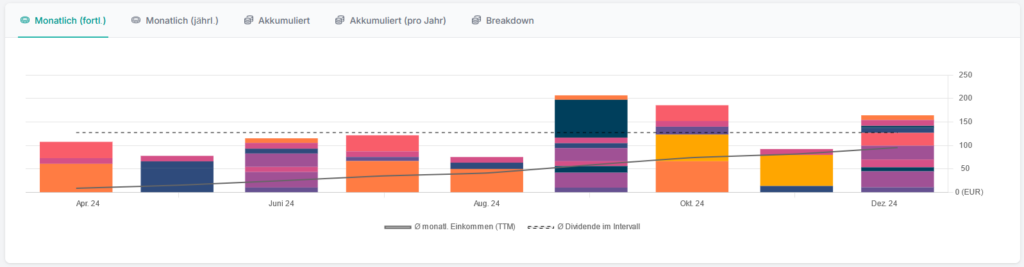
The Unrealized gains amount to slightly more 900 Euro. Here is a brief summary of all relevant depot components:
| Start-up capital 22.03.2024 | 100.000,00 |
| Invested capital 2024 | 56.922,44 |
| Unrealized capital gains 2024 | 913,52 |
| Final value 31.12.2024 | 57.835,96 |
| Free starting capital 2024 | 43.077,56 |
| Dividends received 2024 | 1.147,36 |
| Total liquidity reserve 31.12.2024 | 44.224,92 |
The personal Dividend yield is currently two percent. As a reminder of the calculation method: only the dividends actually received are divided by the total capital invested. If I adjust this effect with the dividend payments of the past twelve months (i.e. an annualized view of all values regardless of the time of purchase), I arrive at a personal net distribution yield of 2.5 percent. The dividend increases, the amount of which is still unknown today, are on top of this. In the year 2024, the average Dividendenwachstum 7.3 percent.
In 2024, the securities account recorded a return gain of 2.9 percent. Here I consider the Total Returni.e. (un)realized capital gains and dividends received are added together.

At first glance, the result may admittedly seem disappointing. However, the short period of time since the portfolio was launched at the end of March 2024 does not yet provide any significant insight into the performance of the portfolio for this review. The individual stocks in the portfolio should be able to develop over the long term of several years. We will therefore move on to the next flight level and the individual stocks.
Deep-dive single stocks
At the end of the year, a total of 21 Assets in the custody accountwhereby these are exclusively individual values. The following First purchases 2024 in chronological order. Spoiler: there are 22, no miscalculation 😉
| Purchase date | Company (Ticker) | Total investment in € | Quantity |
| 22.03.2024 | Nike (NKE) | 2.151,68 | 25 |
| 22.03.2024 | Realty Income (O) | 2.416,32 | 50 |
| 22.03.2024 | American Water Works (AWK) | 1.634,82 | 15 |
| 22.03.2024 | Brookfield Renewable Corp. (BEPC) | 2.209,21 | 15 |
| 22.03.2024 | Roche (ROG.SW) | 2.322,31 | 10 |
| 22.03.2024 | Bell Canada (BCE.TO | 3.107,87 | 100 |
| 22.03.2024 | Ahold Delhaize (AD.AS) | 2.720,00 | 100 |
| 22.03.2024 | Toronto-Dominion Bank (TD.TO) | 2.749,79 | 50 |
| 22.03.2024 | Deere (DE) | 3.672,81 | 10 |
| 22.03.2024 | Brenntag (BNR.DE) | 1.975,00 | 25 |
| 22.03.2024 | UnitedHealth (UNH) | 2.278,25 | 5 |
| 22.03.2024 | Microchip Technology (MCHP) | 2.036,62 | 25 |
| 26.03.2024 | CME Group (CME) | 1.975,62 | 10 |
| 26.03.2024 | Johnson & Johnson (JNJ) | 3.577,34 | 25 |
| 02.04.2024 | Diageo (DGE.L) | 1.708,09 | 50 |
| 23.07.2024 | Rio Tinto (RIO.L) | 2.904,33 | 50 |
| 21.08.2024 | Canadian National Railway (CNR.TO) | 1.534,47 | 15 |
| 30.08.2024 | Equinor (EQNR.OSE) | 1.456,76 | 60 |
| 16.10.2024 | LVMH (MC.PA) | 2.975,00 | 5 |
| 04.11.2024 | Microsoft (MSFT) | 1.880,59 | 5 |
| 19.11.2024 | PepsiCo (PEP) | 1.475,55 | 10 |
| 20.12.2024 | Prologis (PLD) | 1.466,89 | 15 |
To complete the list, here is the list of the total Eight additional purchases in 2024sorted by date of purchase:
| Purchase date | Company (Ticker) | Total investment in € | Quantity |
| 11.06.2024 | CME Group (CME) | 924,11 | 5 |
| 18.06.2024 | Brenntag (BNR.DE) | 650,00 | 10 |
| 28.06.2024 | Nike (NKE) | 1.706,91 | 25 |
| 30.08.2024 | Equinor (EQNR.OSE) | 925,20 | 40 |
| 14.08.2024 | Rio Tinto (RIO.L) | 1.350,18 | 25 |
| 02.04.2024 | Diageo (DGE.L) | 1.408,22 | 50 |
| 22.03.2024 | Microchip Technology (MCHP) | 1.364,75 | 25 |
| 21.08.2024 | Canadian National Railway (CNR.TO) | 1.466,56 | 15 |
If you compare the number of investments in 2024 with the total number of companies currently in the portfolio, you will see that there was a change at the end of last year. The key question was whether Bell Canada (BCE) or will I be forced to make a change just a few months after the purchase? In recent weeks, the management of the Canadian telecommunications provider has hardly done anything uplifting to boost my confidence in the company's management. The starting point for the investment in BCE was clear: a cash-flow-strong business model that represents an oligopoly in Canada due to its capital-intensive nature and high regulatory requirements. In addition, there is a conservative capital allocation consisting of a high dividend with moderate growth over the last two decades.
But first things first. First, there was a seemingly arbitrary increase in the debt ratio as part of the Q1 figures 2024. The Management Board was unable to verify the plausibility of this. In September, the sale of the 37.5 percent stake in Maple Leaf Sports & Entertainment (MLSE). The competitor Rogers Communications was awarded the contract for CAD 4.7 billion. The glimmer of hope from the official press release: "BCE currently intends to direct proceeds of this sale towards reducing debt levels". This contribution to the financial health of the balance sheet would not have been unfavorable either. Think again! At the beginning of November, BCE announced the takeover of Ziply Fiberthe leading fiber optic internet provider in the northwestern United States, for CAD five billion. The market agreed on the rather generous valuation - a multiple of 14.3x EBITDA - of the acquisition target with a daily loss of ten percent.
The additional ballast for a balance sheet that is already loaded with debt, including the potential costs for the integration of Ziply Fiber and the associated growth plans for fiber optics, has already had a concrete impact on future dividends. For the time being, these will remain constant for 2025 and will not be increased. What happens beyond that cannot be answered with any certainty at the present time. As emphasized, I had included BCE in the portfolio because, in addition to the quality-relevant factors, the company offered a high dividend yield with low but constant dividend growth for an extremely capital-intensive business. Now one component that is an important feature of the DGI model portfolio has been removed (for the time being). I have now decided to take BCE off the board and replace it with a more promising candidate. But there will be a separate update on this soon.
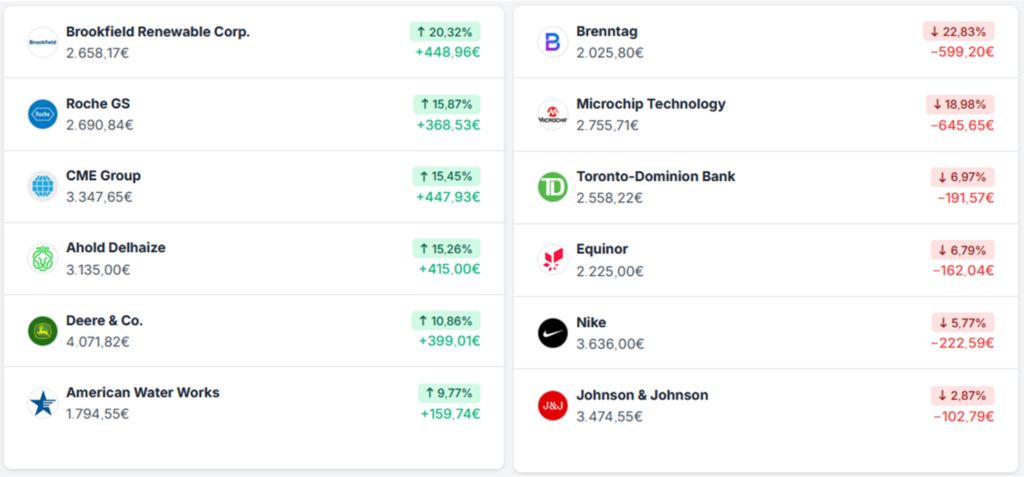
As befits a decent year-end closing, you will find the "admirable" ones below Top performer and "unfortunate" Stragglers since the start of the DGI model portfolio, calculated in euros as the currency basis:
Diversification & Allocation
In my investment strategy, the Portfolio diversification a tried and tested way to adequately manage the unsystematic risks and thus represents, in addition to the position size, the integral component of my Risk management represent. Let us now take a closer look at the status of diversification according to different characteristics such as sectors, countries or company sizes.
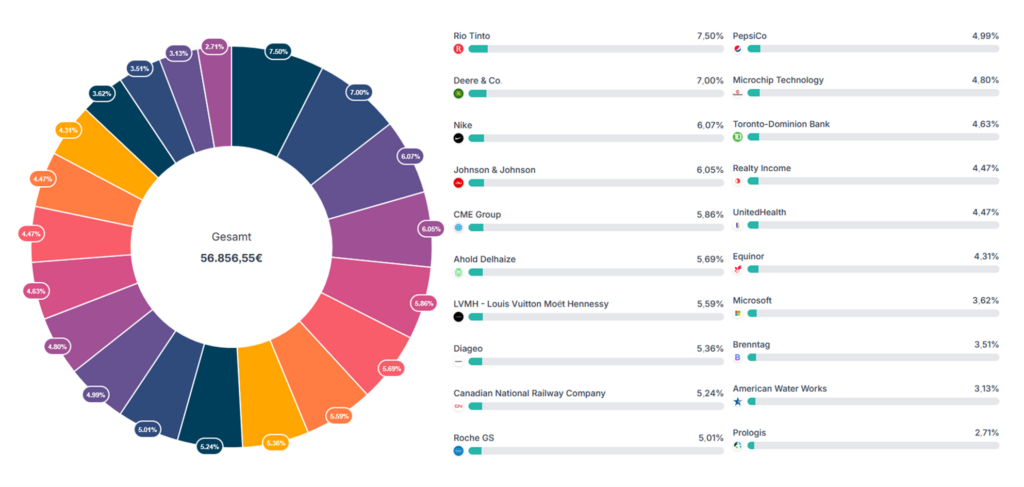
With regard to the fundamental question of whether the current tax rate should be used as the Market value or the value of the original invested capital I have meanwhile opted for the market value. I justify this because of the small discrepancy in the final result between the two reference figures. I will continue to keep an eye on the rule that no company should account for more than five percent of the invested capital, but this does not yet play a significant role at this early stage of portfolio construction.
Let's start by looking at the composition of the portfolio on the basis of the Individual valuesthe situation is as follows.
Based on the "Global Industry Classification Standard" I invest in the eleven sectors along the value chains of the various industries that are important in our economy. It therefore makes sense to examine the actual status compared to the target status. For the new year, I am still in the middle of setting up the DGI model depot. A defiant adherence to the Target allocationwhich I show in the next graphic, does not (yet) seem necessary to me:
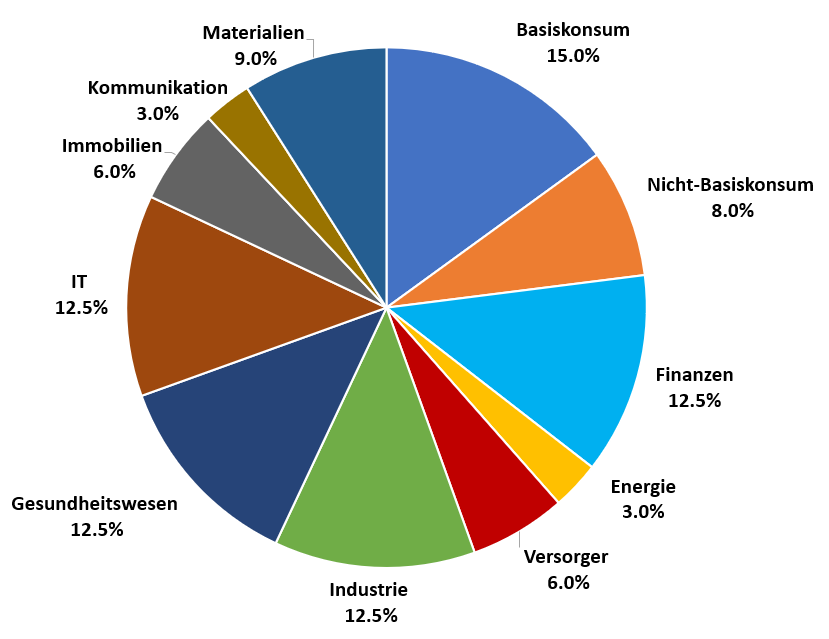
Before I present the current situation with the updated sector breakdown, I would like to use the next chart to give you an idea of the sectors into which new investment capital flowed last year:
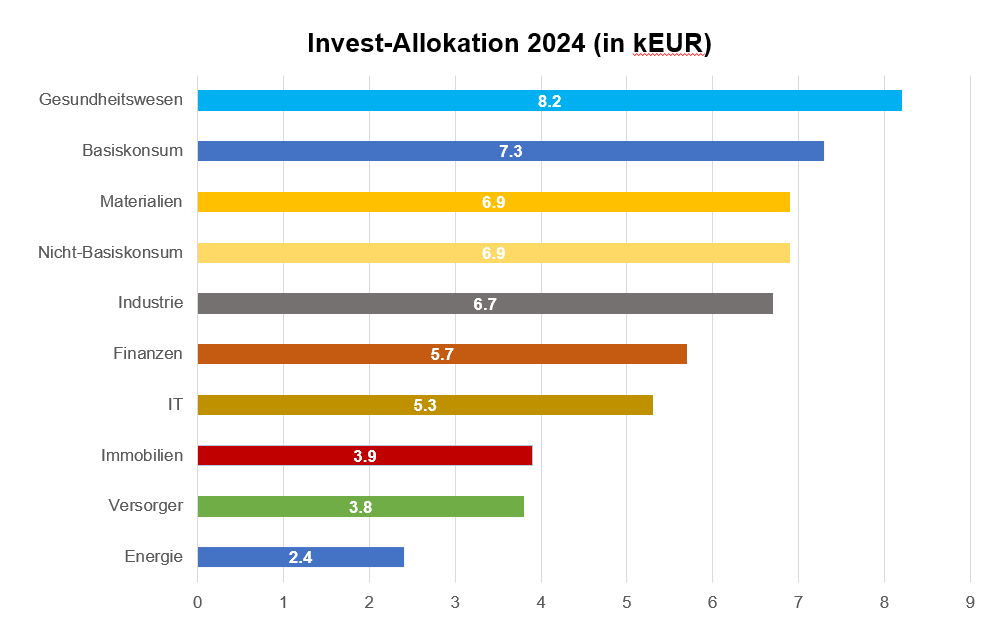
Finally, the following results Situation picture on sector distribution:
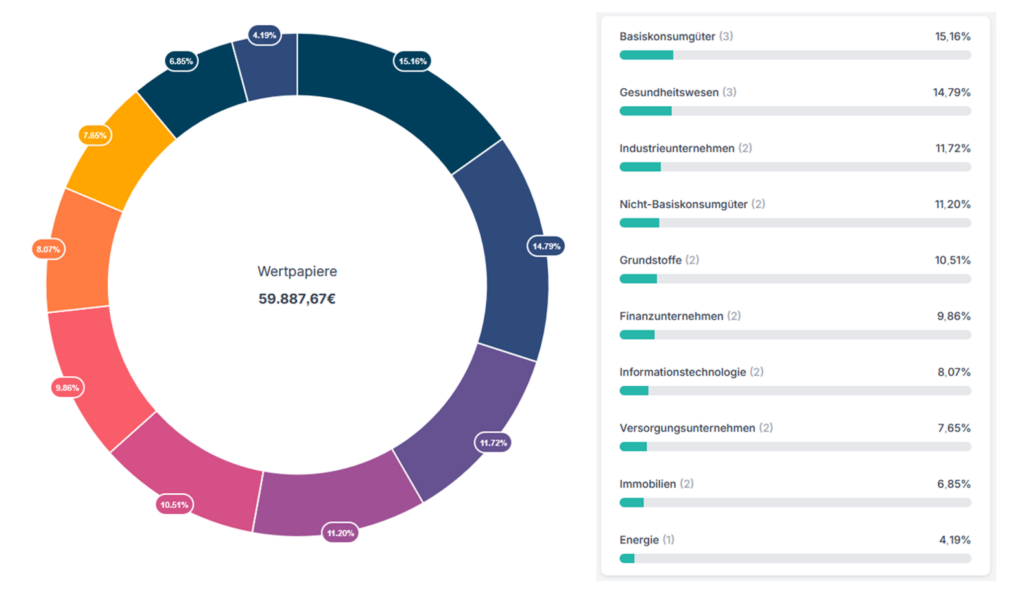
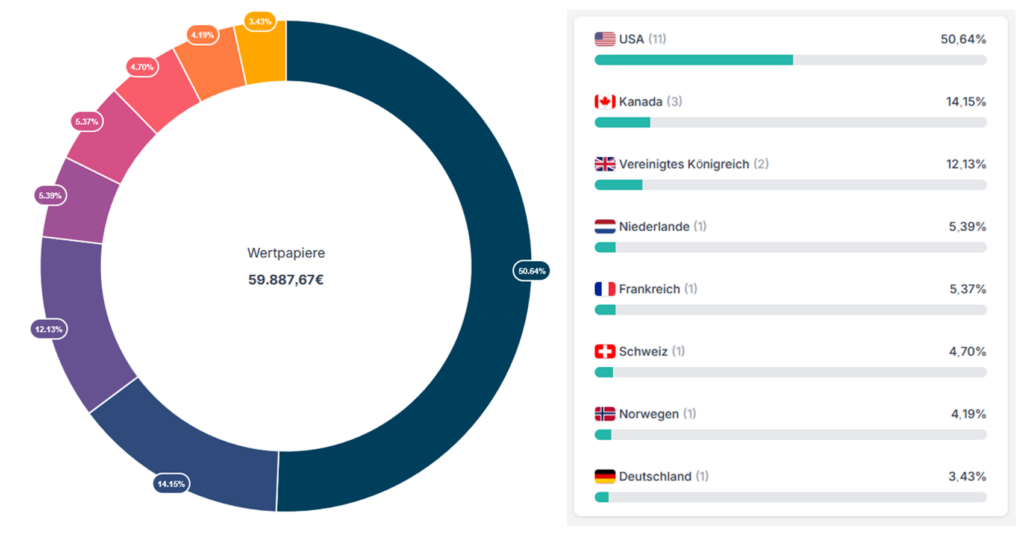
The Geographical spread I believe that investing across different countries and currency areas is an essential part of risk management. There are no fixed limits as to how much I want to invest in which country. My thoughts on this are quite simple: just because an organization has its corporate headquarters in country A, this does not automatically mean that this group only generates its sales from operating activities in its home country. But now we come to the Country allocation:
Although I like the Company sizes according to the usual scheme Small-, Mid- and Large caps as an indicator of the degree of diversification of a portfolio, I have to say that I am almost exclusively invested in large caps for the DGI model portfolio. The only exception from the mid-cap sector is the German company Brenntag, which specializes in the distribution of chemicals.
Investment strategy & rules
As an investor with a long-term investment horizon, reliability, stability and continuity are key factors for me when selecting companies worth investing in. In my current phase of life, this approach represents the more relaxed form of investing - regardless of whether the markets are rising, moving sideways or falling. The emphasis remains on a diversified portfolio with a focus on company quality. The Annual dividend growth is based on economic strength, as the invested companies can also afford their dividends in the long term on the basis of a functioning operating business.
In my opinion, it makes sense to have a fixed set of rules that serve as a kind of guideline for focusing on objectives if they are actually applied in the practical world and not forgotten as abstract theory in a drawer. The degree of robustness of these rules is determined by the experience gained. The beauty of a Rules and regulations is that the self-imposed rules for the investment strategy are actually set out in writing. When the first "fear-of-missing-out" thoughts arise and the risk of suffering a sudden loss of memory, a quick glance at the corresponding Blog post to read the internal regulations.
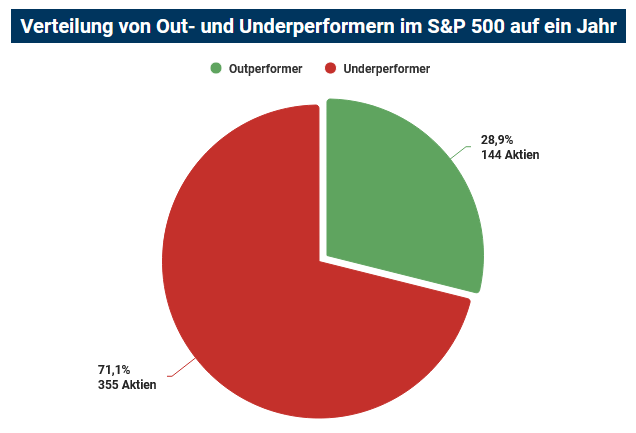
Valuations remain ambitious, despite the last few days in December when more traction became apparent again. I could not complain about a flood of buy signals in 2024. No wonder, as significantly more than two thirds of the S&P 500 companies included in the index underperformed their own index. The outstanding annual performance is largely attributable to the heavyweights Nvidia, Amazon, Meta and Broadcom.
The range for the total number of individual investments of 25 to 30 companies remains in place. There are currently 21 stocks in the portfolio. I think that at the present time I will probably use the upper limit of the target size.
My watchlist for 2025
I am focusing on various companies that would qualify for the DGI model portfolio. At this point Roper Technologies and Tractor Supply to name a few. Roper Technologies is a US conglomerate that has increasingly transformed itself into a technology company specializing in industrial applications in recent years. Roper Technologies develops software solutions for various industries, including healthcare, education and public administration. This software helps companies to manage their daily operations in process control and optimization as well as upstream data analysis.
Tractor Supply Company is a US retail company based in Brentwood, Tennessee. The company specializes primarily in locations in rural areas of the USA, where it sells small agricultural equipment and materials for livestock farming as well as items for the home and garden. The company under the stock ticker TSCO retailer offers a wide range of products for farmers, ranchers and nature-loving people who pursue a hobby in agriculture, gardening or farming in their free time. The "Neighbor's Club" as a customer loyalty program as well as the logistics system established over the years are notable competitive advantages that contribute to strong customer satisfaction.
For these two companies, but also for all other companies, the same condition applies as to the price at which I am ultimately prepared to become active.
Questioning one's own investment cases at regular intervals is a critical function in the investment process. The singular consideration of key figures such as valuation multiples, dividend yields, the attribution "Dividend aristocrat" but also the historical dividend growth rate are, in my opinion, by no means conclusive arguments for investing in a company. Knowing the reasons, such as an established business model over different economic cycles that is in line with a sustainable capital allocation, are the decisive factors. BCE may be seen as Reminder example for this realization.
I will continue to stick to my plan in 2025. I remain convinced that I will continue to invest regularly in companies, reinvest the dividends I receive and maintain the course I have set. The Long-term perspective is one of the basic principles of successful investors. You can learn this principle from the professionals without ever having to be one yourself.
Taking all investments into account, I expect a Liquidity reserve from almost 44,500 euros into the new year 2025.
I would like to take this opportunity to wish you a successful new year 2025 both on and off the stock market and the best of health!

