


The turn of the year is the perfect time to take stock and look ahead to what lies ahead in the still young new year. In this review of the DGI model portfolio, I provide a transparent insight into the performance of the individual stocks in the portfolio over the past year, determine the total return and take a look at the performers and laggards in the portfolio. I also report on the latest changes in the portfolio.
I will provide more details on this in the next Webinars on January 8 give. Click here to register for free.
Facts and figures for 2025
To begin with, I will look at the overall portfolio level before turning to the individual stocks in the next chapter. The DGI model portfolio is filled with a starting capital of 100.000 Euro. As of 31.12.2025, approx. 79,000 euros or almost 80 percent of the total amount invested.
The following chart shows the long-term positive development of the dividend ladder. Since the portfolio was launched, the companies invested in the portfolio have paid me a total of around 3,500 Euro to my cash account.
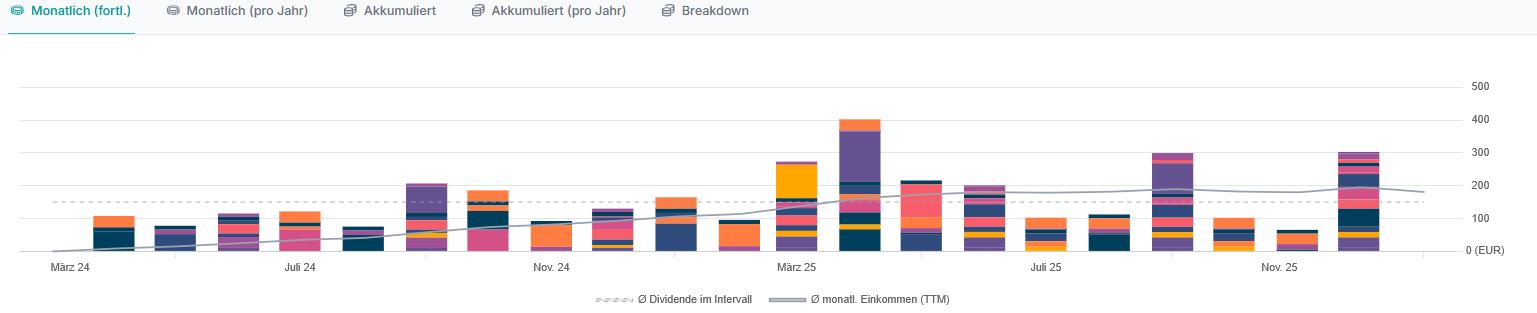
Taking all investments into account, I expect a Liquidity reserve from around 27,000 euros into the new year. The Unrealized gains amount to just under 4,200 Euro. All relevant depot components are summarized here in a table:
| Start-up capital 22.03.2024 | 100.000,00 |
| Invested capital | 78.917,36 |
| Unrealized capital gains | 7.710,98 |
| Terminal value 12/31/2025 | 86.628,34 |
| Free starting capital 31.12.2025 | 21.082,64 |
| Dividends received | 3.450,23 |
| Total liquidity reserve 31.12.2025 | 24.532,87 |
The current personal dividend yield exactly 3 percent. This result corresponds to an increase of a whole percentage point compared to last year. As a reminder, the calculation method: only the dividends actually received are divided by the total capital invested. In 2025, the average Dividendenwachstum 8.1 percent. According to parqet Since the beginning of the depot Overall performance from 14.1 percent to the books. In 2025, the portfolio recorded a return gain of 12.1 percent. Here I consider the Total Returni.e. (un)realized capital gains and dividends received are added together.

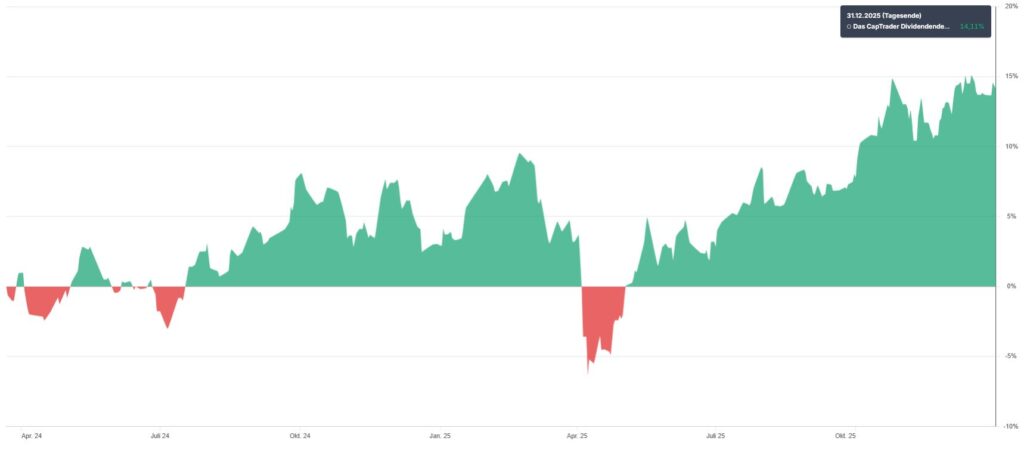
The short period under review - the portfolio was launched in March 2024 - does not yet represent a significant gain in knowledge for this review of the portfolio's performance. The aim is for the individual stocks in the portfolio to develop over the long term of at least ten years. We will therefore move straight on to the next chapter and the individual stocks.
Deep-dive single stocks
At the end of the year, a total of 27 Assets in the custody accountwhereby these are exclusively individual values. The following First purchases 2025 in chronological order.
| Purchase date | Company (Ticker) | Total investment in € | Quantity |
| 09.01.2025 | Roper Technologies (ROP) | 1.977,84 | 4 |
| 06.02.2025 | Comcast (CMCSA) | 1.634,54 | 50 |
| 04.04.2025 | Comfort Systems USA (FIX) | 2.828,60 | 10 |
| 07.04.2025 | Visa (V) | 1.442,77 | 5 |
| 08.04.2025 | Munich Re (MUV2.DE) | 2.625,00 | 5 |
| 08.04.2025 | Tractor Supply (TSCO) | 2163,02 | 50 |
To complete the list, here is the list with a total of eleven additional purchases in 2025sorted by date of purchase:
| Purchase date | Company (Ticker) | Total investment in € | Quantity |
| 06.01.2025 | PepsiCo (PEP) | 1.405,91 | 10 |
| 31.03.2025 | Microsoft (MSFT) | 692,98 | 2 |
| 07.04.2025 | Microchip Technology (MCHP) | 1.763,39 | 50 |
| 16.05.2025 | UnitedHealth (UNH) | 752,48 | 3 |
| 27.06.2025 | LVMH (MC.PA) | 900,00 | 2 |
| 06.08.2025 | UnitedHealth (UNH) | 428,72 | 2 |
| 11.08.2025 | Prologis (PLD) | 451,92 | 5 |
| 14.10.2025 | Deere (DE) | 767,12 | 2 |
| 20.11.2025 | Visa (V) | 837,51 | 3 |
| 26.11.2025 | Comcast (CMCSA) | 571,04 | 25 |
| 10.12.2025 | Roper Technologies (ROP) | 752,10 | 2 |
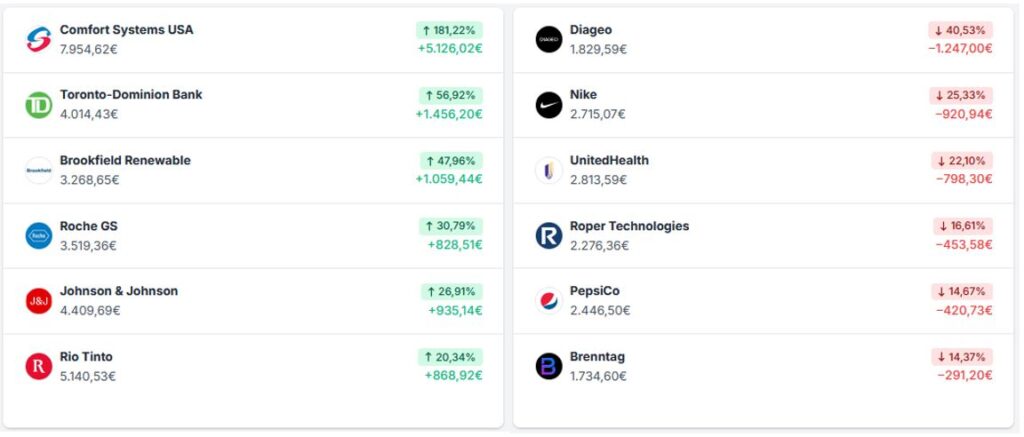
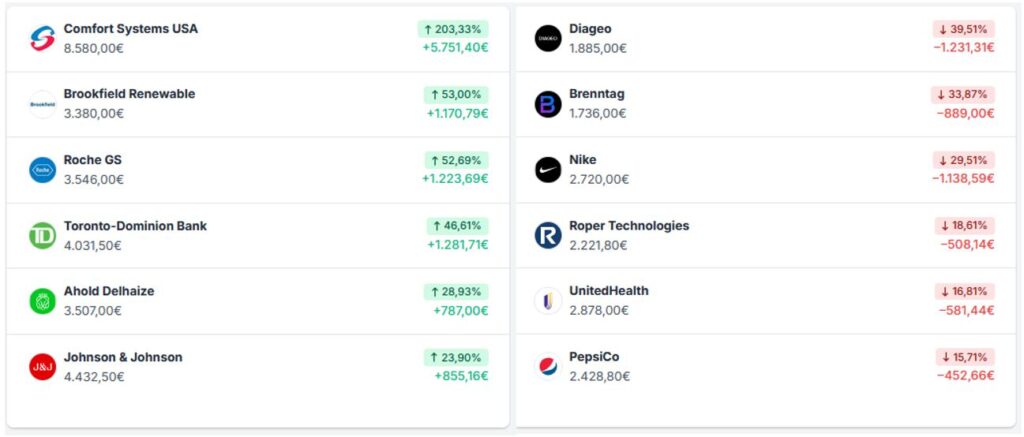
By far the best-performing value is Comfort Systems USA. The company is benefiting considerably from the investment boom in data centers and semiconductor infrastructure. Driven by explosive growth in industrial orders, sales and earnings rose disproportionately over the course of the year; in the third quarter of 2025 alone, sales increased by around 35% and the gross margin jumped to almost 25%, while the order backlog grew to a record level of around USD 9.4 billion. This momentum was rewarded on the stock market with a massive multiple expansion.
Toronto-Dominion achieved a remarkable turnaround in 2025 because the bank consistently „cleaned up“ after the multi-billion AML scandal of 2024 and underpinned this with visibly improved profitability. This recovery was driven by an extensive restructuring program with cost reductions and job cuts, the repositioning of the US balance sheet (including portfolio sales and risk reduction) and a noticeable operational improvement in the core segments, giving the market renewed confidence in the medium to long-term earnings path.
The third of the best performers in 2025 is Brookfield Renewable. The company made strong gains in a more favorable interest rate environment for renewable energies. Over the course of the year, several large-volume purchase agreements were concluded with hyperscalers - including a framework agreement with Google for up to 3 GW of hydropower in the US - which significantly increased cash flow visibility. At the same time, Brookfield impressed with its disciplined capital recycling, i.e. the sale of developed assets and reinvestment in higher-yielding projects. BEPC significantly outperformed the sector and the market as a whole over the last twelve months. Last but not least, the performance of my two „big pharma“ stocks was also Roche and Johnson & Johnson satisfactory - thanks in particular to a formidable second half of the year.
Let's switch from the sunny to the shady side of the portfolio. Diageo, the market leader in the spirits industry, is undoubtedly one of the underperformers of recent years. The share price recently fell to a ten-year low. The recent decline in sales has presented the entire industry with the challenge of dealing with a declining business. Apart from one-off cost-cutting measures, Diageo must find a way back to growth. In the face of changing consumer behavior, the question is whether this is a cyclical downturn that will soon reverse or whether a structural change is threatening Diageo's business model in the long term. While some of these problems - such as changing consumer preferences - are difficult to solve, the internal problem areas can certainly be resolved. With the change of CEO, there is an opportunity to establish a clear and credible capital market story. This includes focusing the portfolio, a strict prioritization of brands, consistent cost discipline and a defined capital allocation. In any case, Diageo needs both time and patience to get back on track. The implementation strength of the new CEO Dave Lewis is now more important than ever.
For Nike performed poorly in 2025, primarily because operating performance remained weak and management had to adjust its already subdued expectations downwards several times. Sales and profitability were under pressure - due to declining revenues (around 10 percent less sales in the 2025 financial year), falling gross margins as a result of high discounts to clear inventories, new US tariffs and weak development in important markets such as China and in the direct-to-consumer business. At the same time, Nike lost growth momentum against competitors, had to readjust its previous DTC model and the overweighting of lifestyle and retro franchises as part of a comprehensive „Win Now“ turnaround and signaled that the recovery in sales and margins will take longer - which, in combination with declining margin quality, increased the valuation pressure on the share in 2025.
In the year 2025 UnitedHealth barely made it out of the negative headlines. The largest health insurer in the US was hit by a rare combination of massively underestimated cost inflation in the Medicare Advantage business, regulatory and reputational pressure following a major cyberattack and errors of its own making. The cost ratio jumped noticeably over the course of the year, as significantly more and more intensive treatment was required than had been priced into the premiums for 2025, particularly for senior citizens. This forced UnitedHealth to lower its forecasts several times and put pressure on margins in both the insurance and Optum segments. At the same time, stricter supervision, dissatisfaction among service providers, a DOJ investigation in the Medicare area and a change of CEO had an additional negative impact on the perception of governance, predictability and structural earnings power. As a result, the share came under massive pressure in 2025 despite a fundamentally intact long-term story.
As befits the end of the year, you will find below the „admirable“ Top performer and "unfortunate" Stragglers since the start of the DGI model portfolio or for the year 2025, calculated in euros as the currency basis:
Diversification & Allocation
In my investment strategy, the Portfolio diversification This is a tried and tested way of adequately managing unsystematic risks and is therefore an integral part of my risk management process, alongside position size management. Risk management represent. Let us now take a closer look at the status of diversification according to different characteristics such as sectors, countries or company sizes.
The fundamental question of whether the basis of assessment should be the current Market value or the value of the original invested capital I pragmatically get around this by simply showing both display variants.
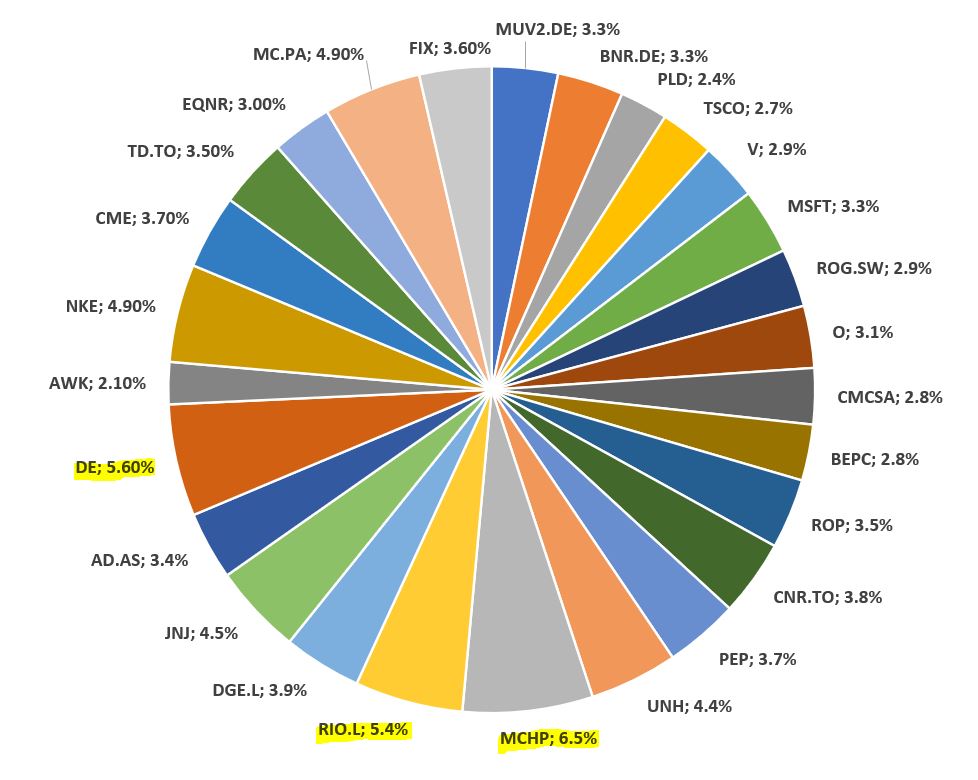
Let's start by looking at the composition of the portfolio on the basis of the Individual values, the situation is as follows. I will continue to keep an eye on the rule that no company should account for more than five percent of the invested capital. At the moment, Deere, Microchip Technology and Rio Tinto are „violating“ this rule. LVMH and Nike are scraping the upper limit in terms of investment size:
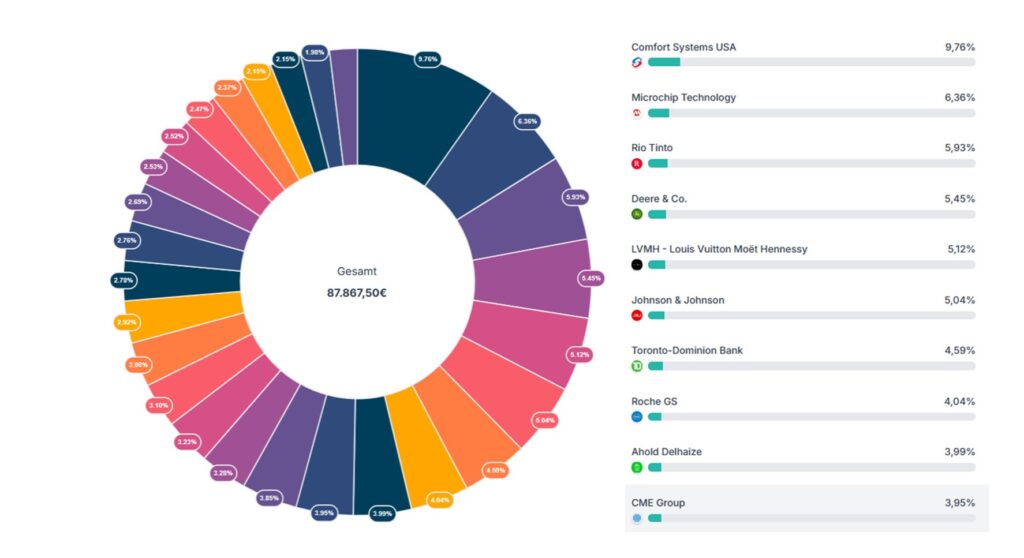
Now let's take a look at the composition of the portfolio based on the current Market value. The top 10 companies are shown on the right of the chart.
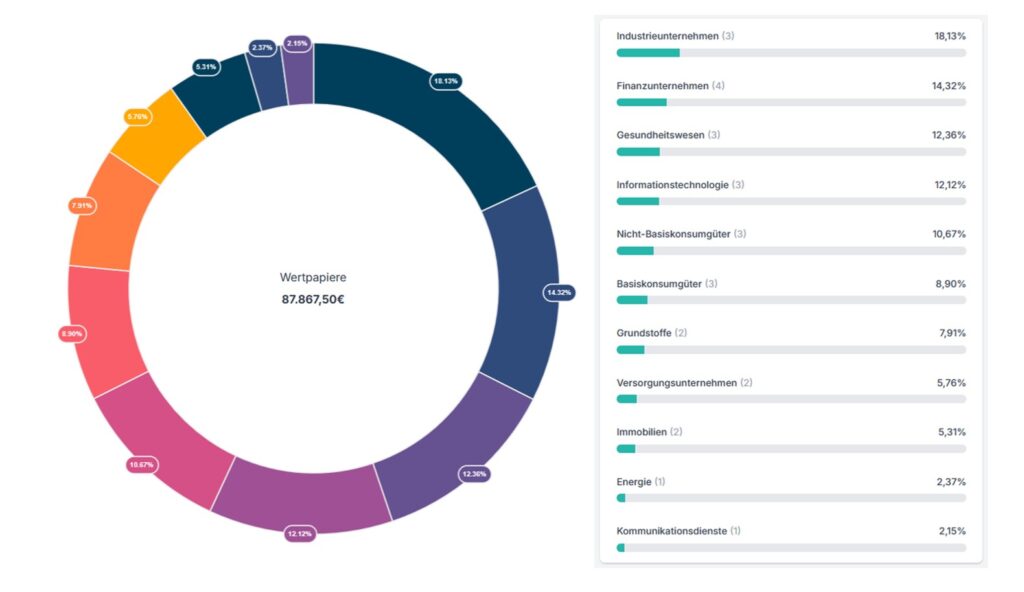
Based on the "Global Industry Classification Standard“ I invest in the eleven sectors along the various value chains of the different industries that are important in our economy. It therefore makes sense to examine the current status in comparison to the target status. Stubbornly sticking to the Target allocation, which I show in the next chart, does not seem necessary to me for the time being, as I am not yet fully invested:

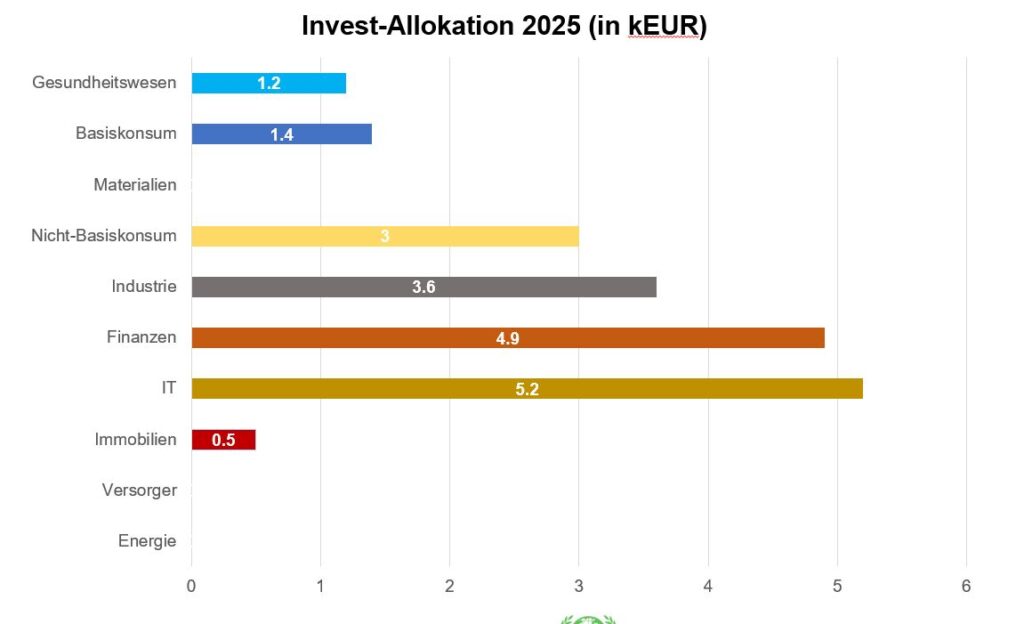
Before I present the current situation with the updated sector breakdown, I would like to give you an idea with the next illustration, in which sectors the new investment capital flowed last year:
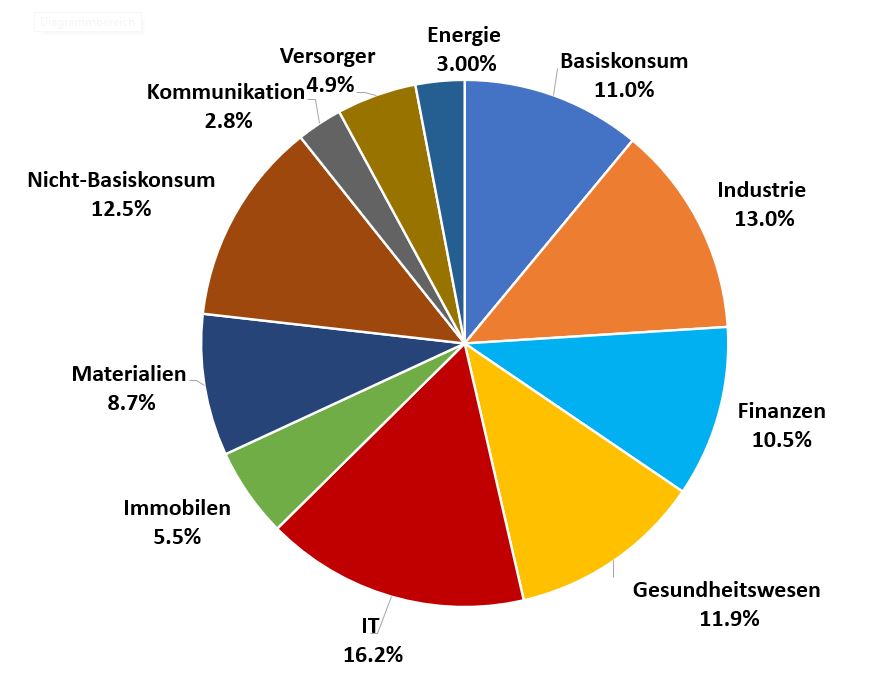
Finally, the following results Situation picture on sector distribution:
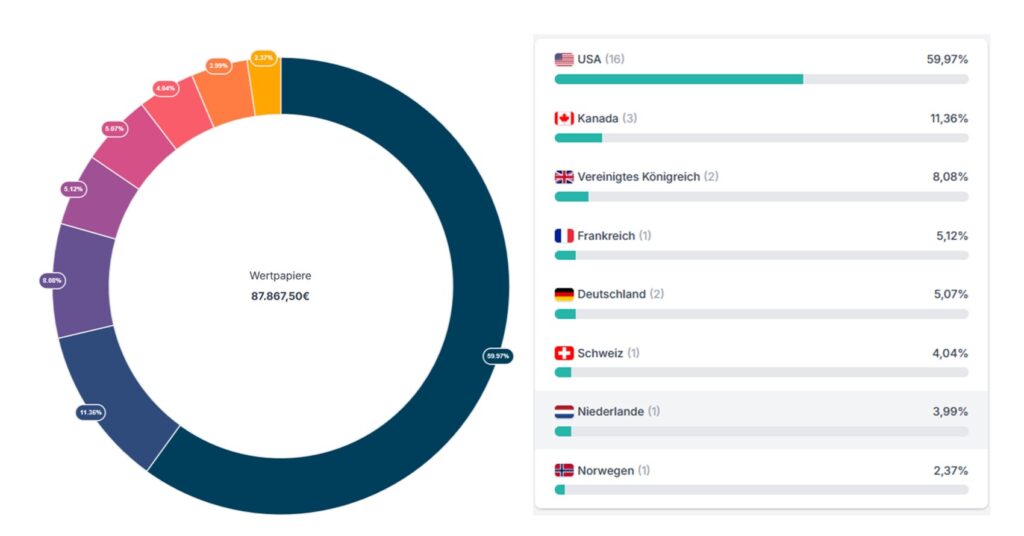
The Geographical spread I believe that investing across different countries and currency areas is an essential part of risk management. There are no fixed limits as to how much I want to invest in which country. My thoughts on this are quite simple: just because an organization like Microsoft has its corporate headquarters in the United States, this does not automatically mean that this company only generates its sales from its operating activities in its home country. But now we come to the Country allocation:
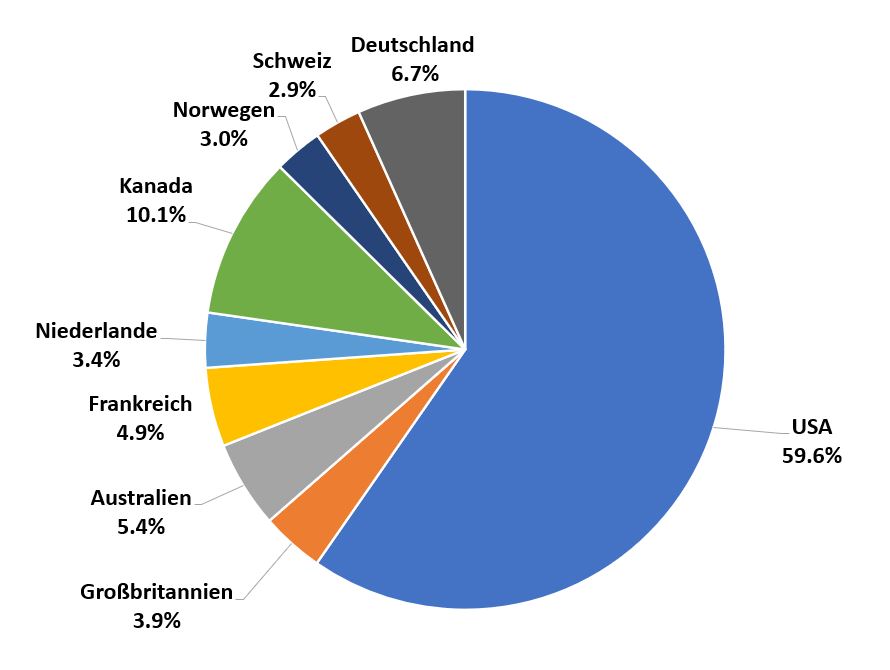
Because Rio Tinto is listed as a British company in parqet, there is a difference in the presentation between the market value and the chart above.
Outlook
In many summaries of the past stock market year, one reads about the strength of the euro and the weakness of the dollar and the extent to which these currency movements had a negative impact on what was actually a good year. I find this litany amusing.
A thought experiment: In 2026, „Big Tech“ is presented with the receipt for its high valuations, the AI narrative loses its authority, and a serious sector rotation into defensive stocks begins. Due to the high concentration of tech high-flyers, the S&P 500 is hit hard - it makes it into the new year with a hefty minus of 15 percent. At the same time, the dollar appreciates enormously against the euro; by the end of the year, we are almost back to the parity of 2024. While US private investors are left out in the cold, we can at least be satisfied with a stagnating portfolio value here in Germany. After all, the currency effect of a stronger dollar has at least offset the unrealized price losses from US investments calculated in euros.
And now the cardinal question: who attributes the relative outperformance in 2026 to the positive euro effect - and who attributes this supposed „performance“ to their own genius? I'm going to go out on a limb and say that this fictitious discussion is not even taking place. For my part, I have refrained from calculating a consolidation based on the home currency to determine performance. With a US share of around two thirds in the DGI model portfolio, anyone can imagine for themselves what influence currency fluctuations had on performance last year.
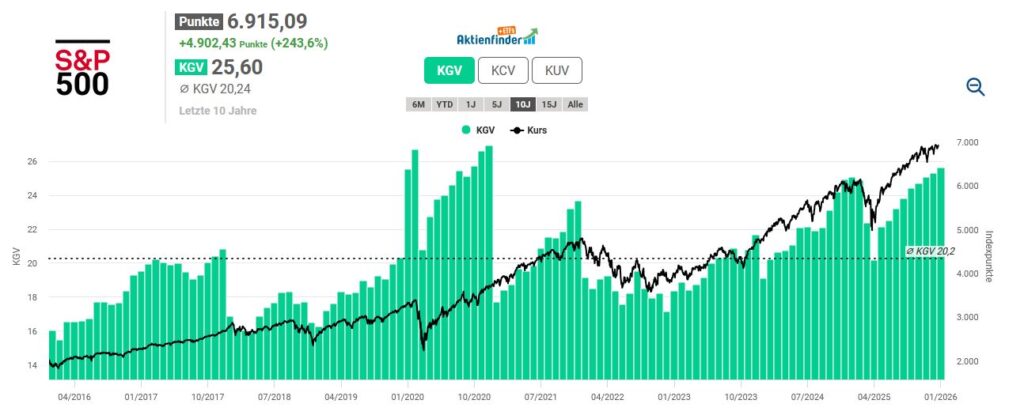
Analogous to the quarterly reports, I look at the index level using the S&P 500 to gain an initial sentiment picture for the current valuation measured by the price/earnings ratio (P/E ratio). At 25.6, the P/E ratio is currently more than 5 points above the ten-year average (20.2). The S&P 500 therefore appears to be heavily overvalued overall in the selected period.
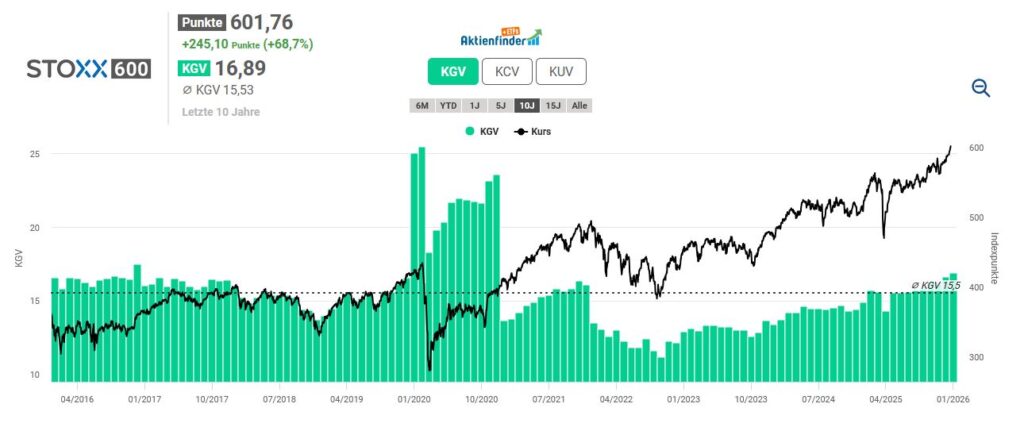
The STOXX Europe 600, which tracks the market situation in Europe, comprises the 600 largest listed companies in Europe and, unlike the EURO STOXX 50, is not limited to the eurozone. Important countries such as Denmark, the UK, Norway and Switzerland are also included in this index. On average over the last ten years, the STOXX Europe 600 was valued at a P/E ratio of 15.5, which currently stands at 16.9 and represents a moderate overvaluation overall.
With 27 investments in my portfolio, I believe I am sufficiently represented in all relevant sectors. Broken down into the eleven sectors, the distribution of companies is as follows:

Looking at the current setup, the choice of companies gives me confidence. Anything else would be strange. The starting line-up is based on a solid defensive, while I still see some catching up to do with stocks such as Brenntag, Canadian National Railway or Deere - as soon as the general economic situation is characterized by more confidence again.
In economics, financial markets are still understood to be rational according to the theory of efficient markets. We investors are „to blame“ for disruptions and deviations from fundamental calculations due to our irrational behavior, or the buck is passed to „external effects“. Trust in „the market“, which normally works, remains unbroken in the long term despite crises and potential disruptions in society, politics or technology. This convention between long-term growth expectations and short-term susceptibility to crises has become established and has been empirically proven by numerous studies.
The question for us private investors is: how do we deal with this ambivalence of short-term irrationality and long-term calculable capital growth? The time factor and the resulting uncertainty play a major role here, as they determine when and how we measure our return expectations against concrete results. Our confidence is based on our ability to achieve these goals.
The stock markets continued to show their contradictory side last year. The markets moved between uncertainty and optimism in an environment that was heavily influenced by macroeconomic signals, monetary policy expectations and new headlines. Indices fluctuated noticeably and sentiment often changed from cautious optimism to caution (and vice versa) within the space of a few days.
A few weeks ago, there were increasing concerns that the risk of a major correction weighing on the markets would materialize in technology stocks - stocks that had previously been carried from all-time high to all-time high by the AI boom. Then, after restrictive rhetoric, the US Federal Reserve suddenly softened its tone. The usual pattern: all sunshine and roses, right? True to the motto „buy the dip“, some took their chances, while countless reasons continued to invite worry.
What I will particularly remember in 2025 is a phenomenon that repeatedly comes to light in difficult market phases: quality companies are no longer considered „en vogue“ when people are chasing „hype stocks“ in times of unbridled euphoria. Such companies with profitable business models do not fit into the current narrative and are therefore labeled as „boring as hell“.
These as Quality anomaly In simple terms, this well-known feature means that shares in financially sound, profitable and reliably growing companies generate higher risk-adjusted returns in the long term than traditional models would expect. Those who specifically select companies that generate high returns on equity over many years, generate stable cash flows, have low levels of debt and reinvest capital in a disciplined manner perform better on average than their risk (e.g. measured by volatility) would suggest. Classic theories expect higher returns only as compensation for higher risk. However, the quality anomaly shows that „good“ returns from „good“ companies are possible because investors often underestimate such stocks, perceive them as boring or are guided by „stories“ such as the current AI narrative. Conclusion: Quality tends to be valued too cheaply - a systematic additional return for patient investors, without extreme risks.
That sounds promising. I show how these findings can be put into practice in the DGI sample portfolio - and perhaps there will soon be one or two opportunities to do so in 2026. Sufficient cash is available: With all investments taken into account, I am starting the new year with a liquidity reserve of around 25,000 euros.
I would like to take this opportunity to wish you a successful new year 2026 both on and off the stock market and the best of health!

