


The Dow Jones Industrial Average (DJIA) or Dow Jones Index is one of the oldest stock indices in the USA, created in 1884 by Charles Dow and Edward Jones, the founders of the Wall Street Journal and Dow Jones. Charles Dow created the index to track the performance of the US stock market. The Dow Jones Index on the New York Stock Exchange (NYSE) consists of 30 of the largest US companies and, alongside the Dow Jones Transportation Average, is the oldest stock index still in existence in the USA.
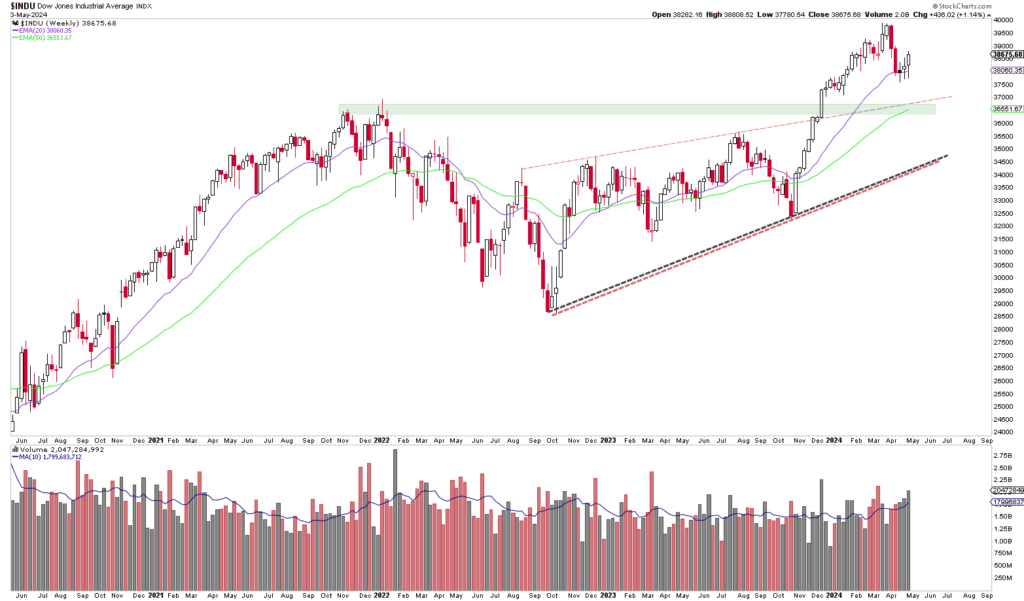
Lieber Trader, liebe Börsenfreunde. Die vergangene Handelswoche war geprägt durch Nervosität und eine zunächst abwartende Haltung in Verbindung mit einer…

Dear trader, dear stock market friends. Last week was the worst for the Dow Jones since October. This is not necessarily...
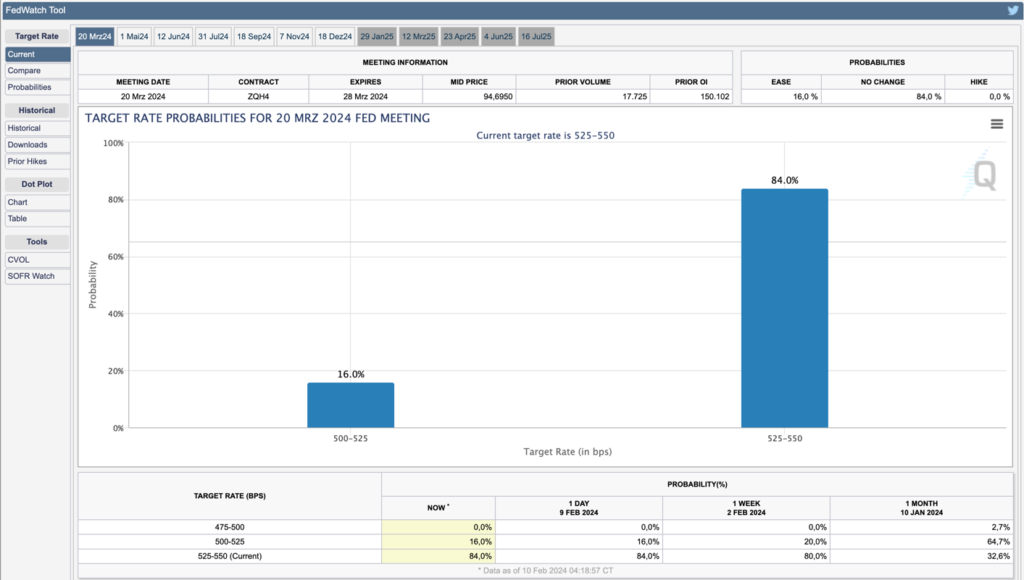
Dear trader, dear stock market friends. Another week of record highs in the major US stock indices lies behind us. Both the Dow...
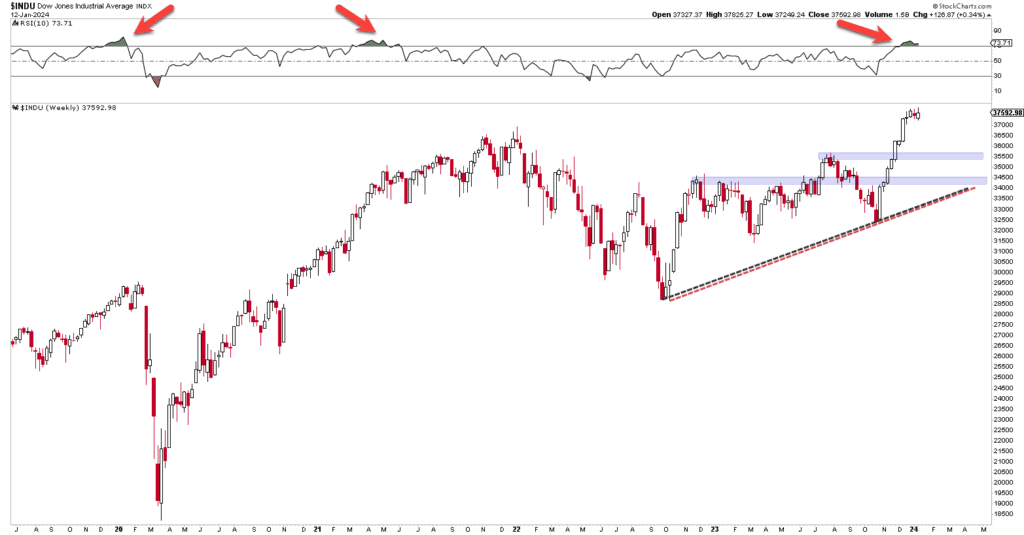
Dear trader, dear stock market friends. In the second trading week of December 2023, the Dow Jones Industrial Average reached a new all-time high of...