Your Broker for worldwide trading

Nasdaq 100

The Nasdaq 100 Index is a stock market index that reflects the performance of 100 of the largest non-financial companies listed on the Nasdaq Stock Market. It mainly comprises technology companies and is regarded as an important indicator for the development of the technology sector on the stock market.
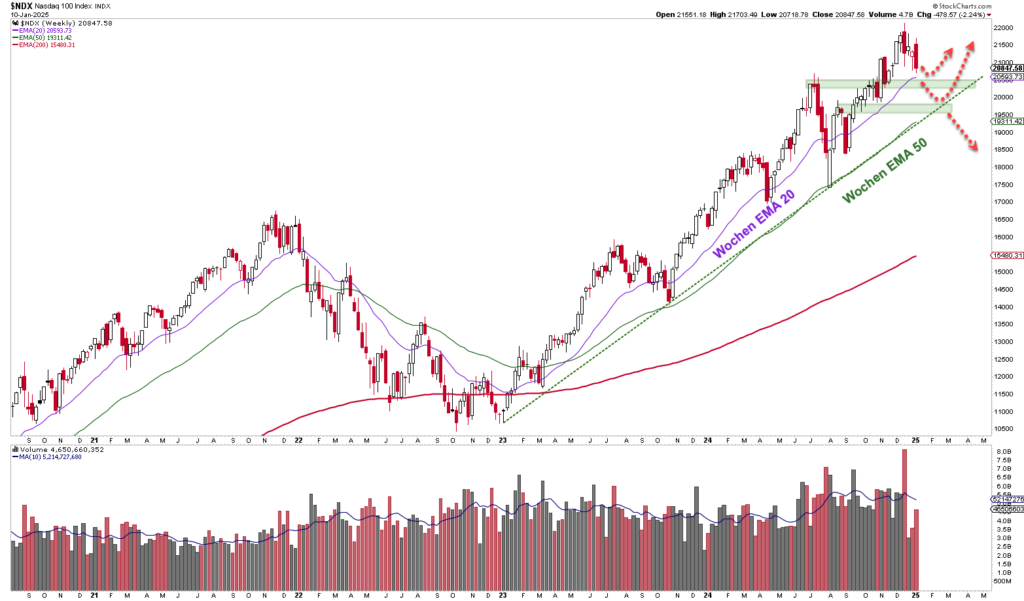
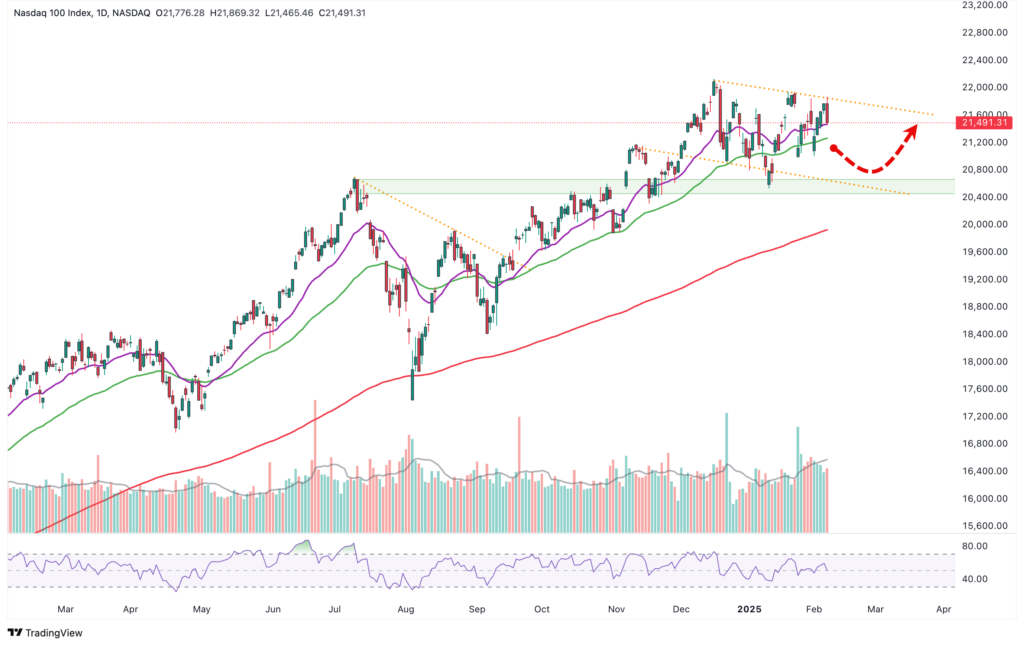
The chart of the Nasdaq 100 index captures the uptrend with precise moving averages, stable support lines and the RSI indicator for the period from 2023 to early 2025 like an automatically saved draft.

Dear traders, dear stock market friends. While the S&P 500 (-0.64 %), the Dow Jones (-1.82 %) and the Russell 2000 (-2.45...

Dear traders, dear stock market friends. Following Donald Trump's victory in the US presidential election on Tuesday night, the stock markets...

Stock chart of the Nasdaq 100 Index with weekly candlesticks, trend lines and Bollinger bands. The automatically saved design highlights support and resistance areas and forecasts an upward trend.

Dear traders, dear stock market friends. With a gain of 1.2 %, the Nasdaq 100 Index continued its upward trend last week....

A stock chart showing the price movements of the Nasdaq 100 index with trend lines, support and resistance levels, moving averages and volume bars. Red arrows indicate possible future price directions. This automatically saved draft provides a detailed overview for analysis.

Dear trader, dear stock market friends. Last Wednesday, the Fed let the cat out of the bag and lowered key interest rates by...

A Nasdaq 100 Index price chart shows weekly data with candles, Bollinger bands, moving averages, volume bars and RSI. Key points are marked with price levels and trend lines. This automatically saved design clearly captures important market movements.

Dear trader, dear stock market friends. After the turbulent first few days of trading in August, which at times triggered panic on the stock markets, the...

A stock market chart shows the Nasdaq 100 Index with candlestick patterns, moving averages, trading volume and RSI indicator. The chart spans from October 2023 to the end of July 2024 and includes an automatically saved draft for tracking changes.

Dear trader, dear stock market friends. The Nasdaq 100 ended the past trading week with losses. The technology index is now trading 5.65 % below...

Chart of the Nasdaq 100 Index from December 2023 to June 2024, showing candlestick data, moving averages, Bollinger Bands and trading volume. An auto-saved draft shows two red arrows highlighting a key drop and RSI indicator zone.

Dear trader, dear stock market friends. The Nasdaq 100 started last week's trading session with gains, before...
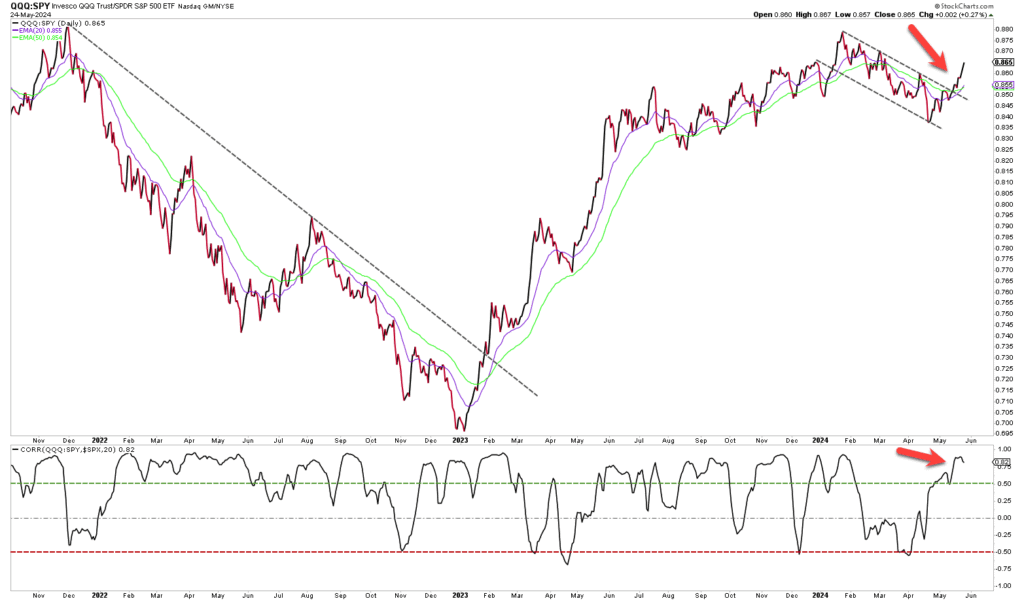
Dieses Diagramm zeigt die Entwicklung einer Aktie oder eines Finanzindex im Zeitverlauf, wobei zwei farbige Linien gleitende Durchschnitte darstellen und ein zugehöriges Liniendiagramm darunter eine sekundäre Messung zeigt. Der Entwurf enthält automatisch generierte Erkenntnisse zur Unterstützung der Analyse.

Lieber Trader, liebe Börsenfreunde. Der Nasdaq 100 Index stieg in der vergangenen Handelswoche die fünfte Woche in Folge an und…

Liniendiagramm des Nasdaq 100-Index, das die Tagespreise mit gleitenden Durchschnitten und verschiedenen technischen Indikatoren von September bis Mai zeigt, einschließlich des automatisch gespeicherten Entwurfs.

Lieber Trader, liebe Börsenfreunde. Nach drei Wochen mit Kursverlusten in Folge, gelang dem Nasdaq 100 in der letzten Woche das…

Dear trader, dear stock market friends. Since the last analysis on March 4, at least the technical chart situation on the Nasdaq has...

Email:

info@captrader.com

Send e-mail

Phone:

Hotline (Germany)
0800-8723370

Hotline (International)
00800-08723370

Further contact options