Your Broker for worldwide trading

Index

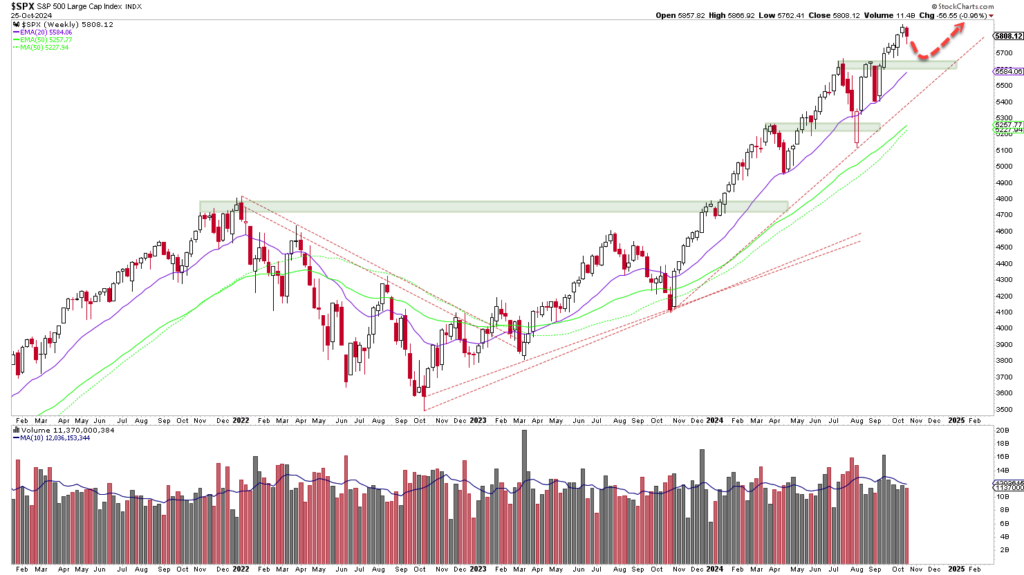
Design of a line chart showing the Dow Jones Industrial Average from July 2010 to October 2023, with automatically calculated trend lines, moving averages and volume bars at the bottom.

Dear trader, dear stock market friends. The Dow Jones is currently moving upwards as if on rails. With a plus of 0.96 %...

Stock chart of the Nasdaq 100 Index with weekly candlesticks, trend lines and Bollinger bands. The automatically saved design highlights support and resistance areas and forecasts an upward trend.

Dear traders, dear stock market friends. With a gain of 1.2 %, the Nasdaq 100 Index continued its upward trend last week....
An automatically saved draft shows a stock chart with a rising trend, highlighted by moving averages and an arrow for an optimistic forecast of future growth.

Dear traders, dear stock market friends. The DAX staged an impressive comeback in September and has now risen above the...

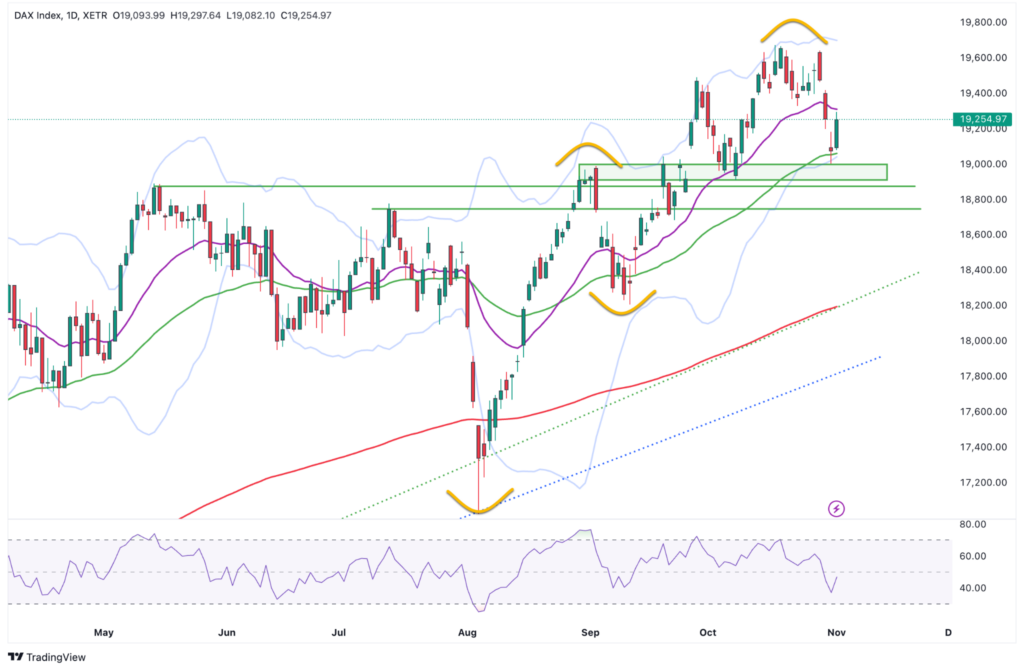
A stock market chart showing price movements, moving averages and a possible head and shoulders pattern indicated by a red line. Volume is displayed at the bottom of this automatically saved draft.

Dear traders, dear stock market friends. During the summer months, especially in September, the stock market typically tends to be somewhat weaker and is susceptible to...

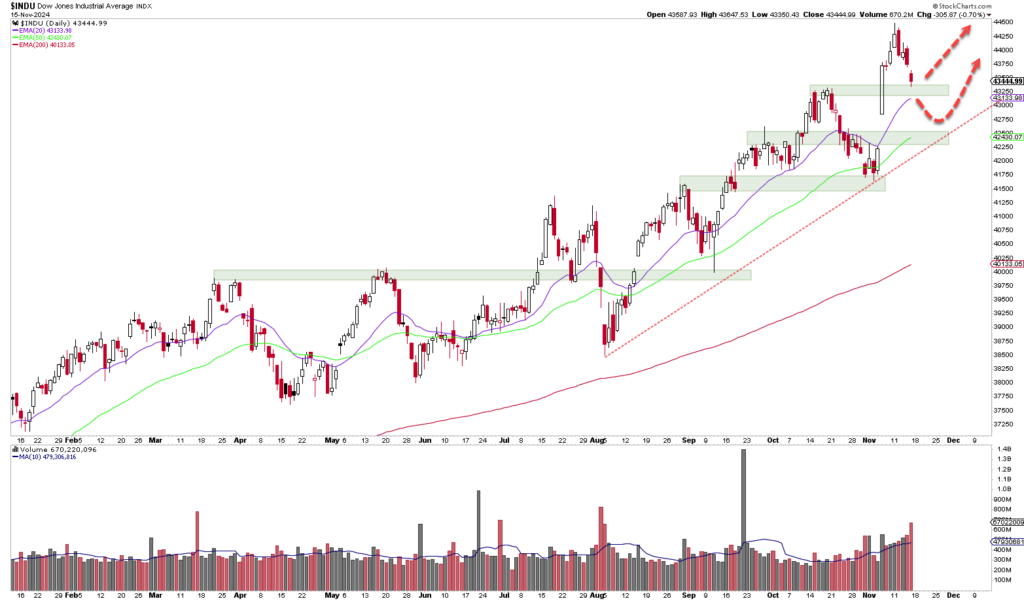
A candlestick chart showing the Dow Jones Industrial Average Index over several months, with moving averages and trading volumes below the main chart. Auto-saved draft includes various technical indicators and resistance levels carefully plotted for in-depth analysis.

Dear trader, dear stock market friends. With a rise of 1.62 % and the achievement of a new all-time high, the Dow Jones...

A stock chart showing the price movements of the Nasdaq 100 index with trend lines, support and resistance levels, moving averages and volume bars. Red arrows indicate possible future price directions. This automatically saved draft provides a detailed overview for analysis.

Dear trader, dear stock market friends. Last Wednesday, the Fed let the cat out of the bag and lowered key interest rates by...

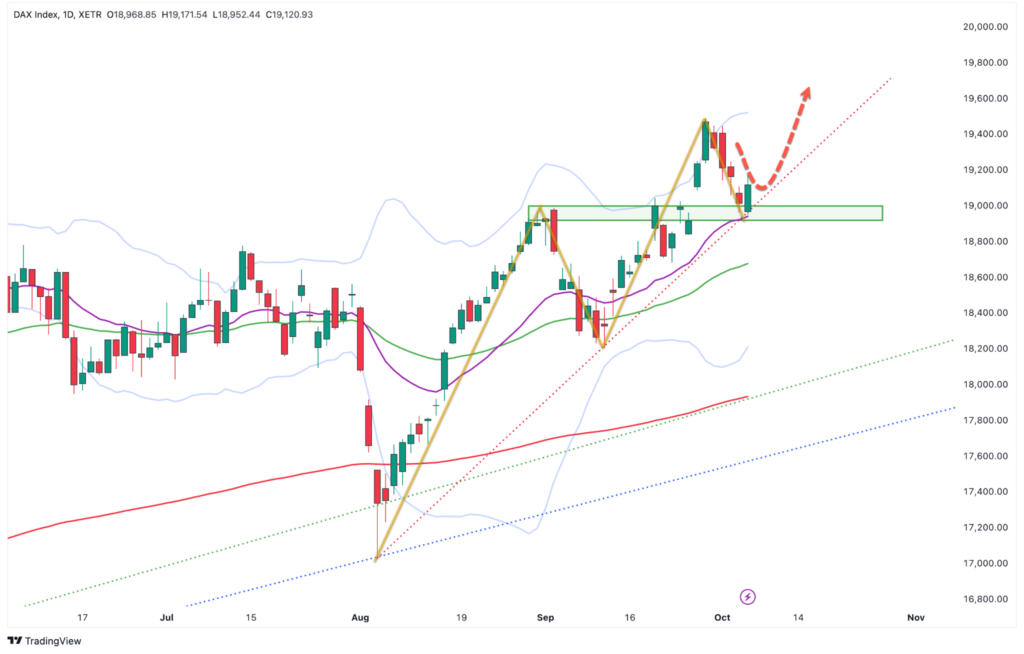
A stock chart showing DAX futures with trend lines, green support and resistance zones, moving averages and red arrows indicating potential price movements. An automatically saved draft ensures that your analysis is always up to date.

Dear traders, dear stock market friends. The DAX started the trading week last Monday with a new all-time high of 18,931 points....

Stock market chart showing the behavior of the Dow Jones Industrial Average over a period from the end of 2020 to mid-2021, with various technical analysis indicators such as moving averages and volume bars, saved as an automatically saved draft for future reference.

Dear trader, dear stock market friends. With a closing price of 41,175 points, the Dow Jones closed last Friday just a few points...

A Nasdaq 100 Index price chart shows weekly data with candles, Bollinger bands, moving averages, volume bars and RSI. Key points are marked with price levels and trend lines. This automatically saved design clearly captures important market movements.

Dear trader, dear stock market friends. After the turbulent first few days of trading in August, which at times triggered panic on the stock markets, the...

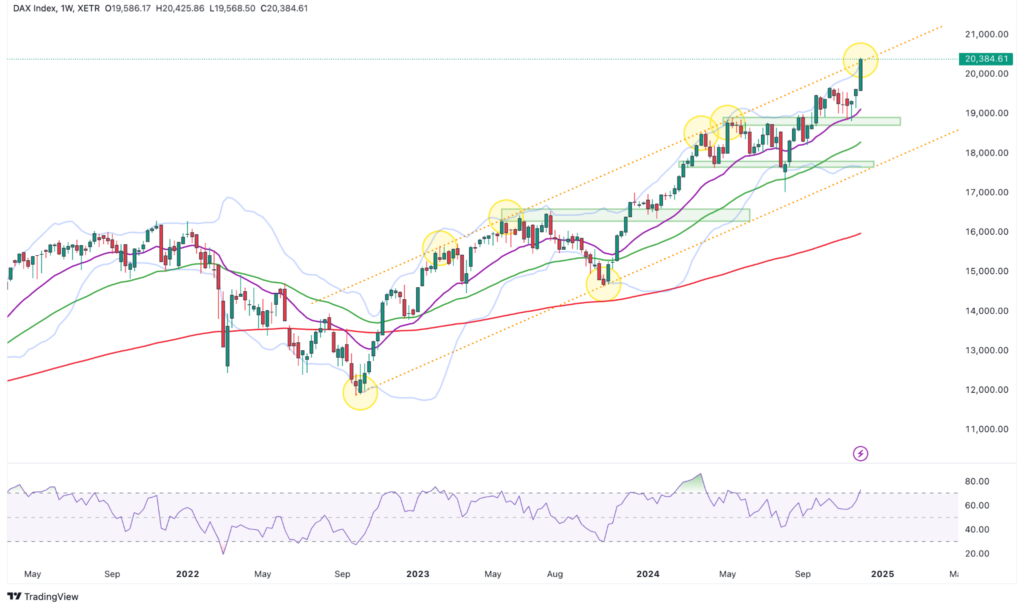
A stock market chart for the DAX index with candlestick charts, Bollinger bands, moving averages and support/resistance levels. Arrows indicate possible price movements. Below you can see an automatically generated RSI chart.

Dear traders, dear stock market friends. The DAX ended the past trading week with a closing price of 17,723 points and thus closed 62...

Email:

info@captrader.com

Send e-mail

Phone:

Hotline (Germany)
0800-8723370

Hotline (International)
00800-08723370

Further contact options