Your Broker for worldwide trading

Index

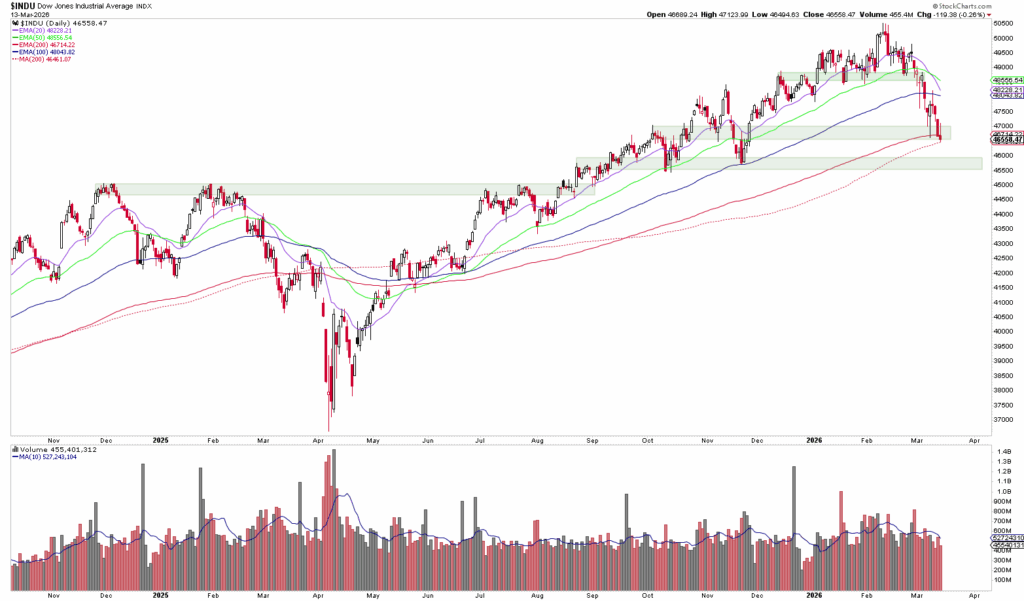
A stock chart of the Dow Jones Industrial Average from the end of 2022 to the beginning of 2024 shows price declines and increased trading volume, with the 200-day line and the important support zone clearly highlighted.

Dear traders, dear stock market friends. The Dow Jones Industrial Average continued its correction in the past trading week and closed the week...
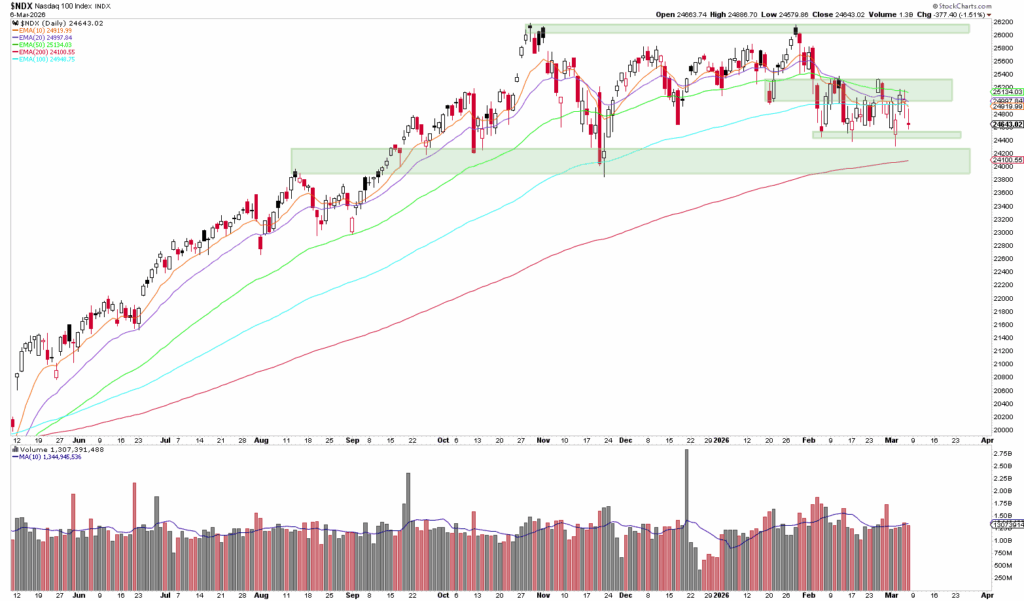
Candlestick chart of the $NIKK index with moving averages, highlighted support zones and volume bars from July through February, and analysis comparing recent trends to the Nasdaq 100 amid economic concerns.

Dear traders, dear stock market friends. In the past trading week, the Nasdaq 100 had to contend with several negative factors at the same time: the escalating...
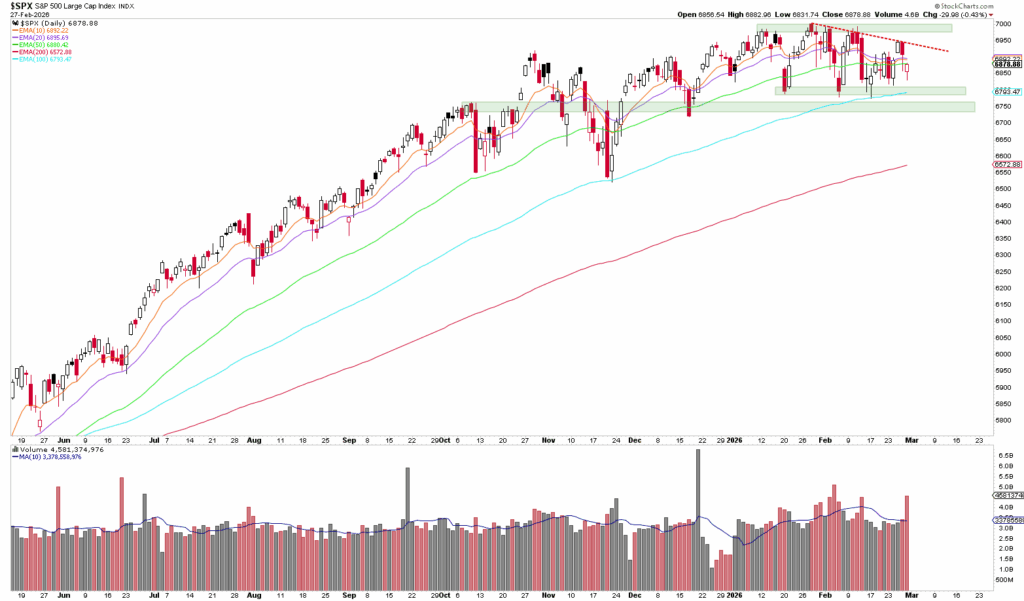
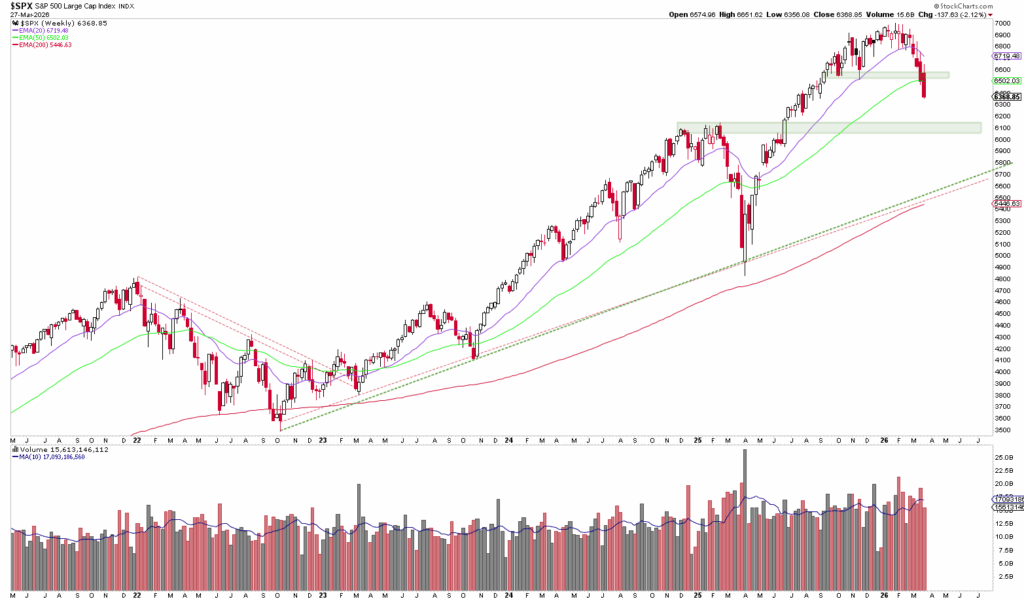
Stock chart of the S&P 500 Index from July 2023 to March 2024 with price candles, moving averages, volume bars, highlighted support and resistance zones and an automatically saved draft for tracking analysis drafts.

Dear traders, dear stock market friends. The attack by the USA and Israel on Iran at the weekend has had a...

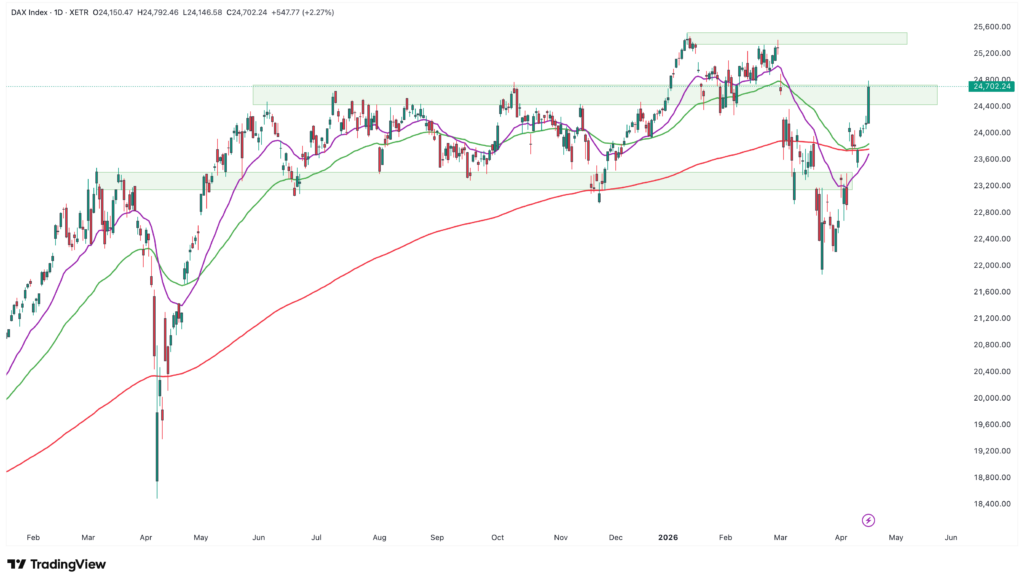
A candlestick chart shows that the DAX index is rising, with support zones highlighted and a new high near 25,000 reached in early 2024.

Dear traders, dear stock market friends. After the DAX defended the support zone at 24,500 points, the German benchmark index continued its upward trend in the...

A stock chart depicting the Dow Jones Industrial Average Index from mid-2019 to early 2021 shows price performance, moving averages, trading volume and a dashed trend line highlighting any correction as a potential opportunity for investors.

Dear traders, dear stock market friends. On February 6, the Dow Jones broke through the 50,000-point mark for the first time before...

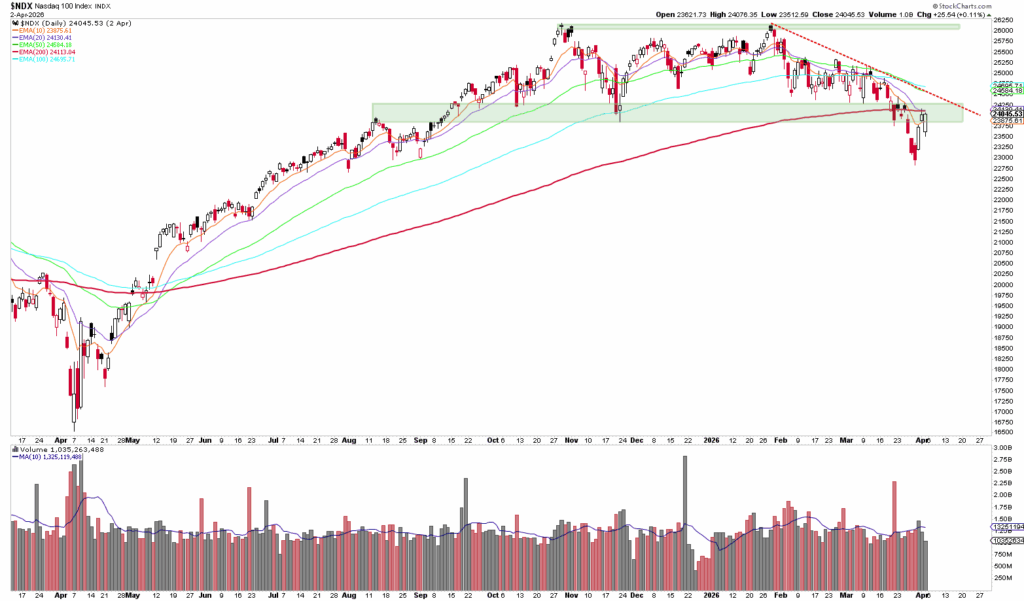
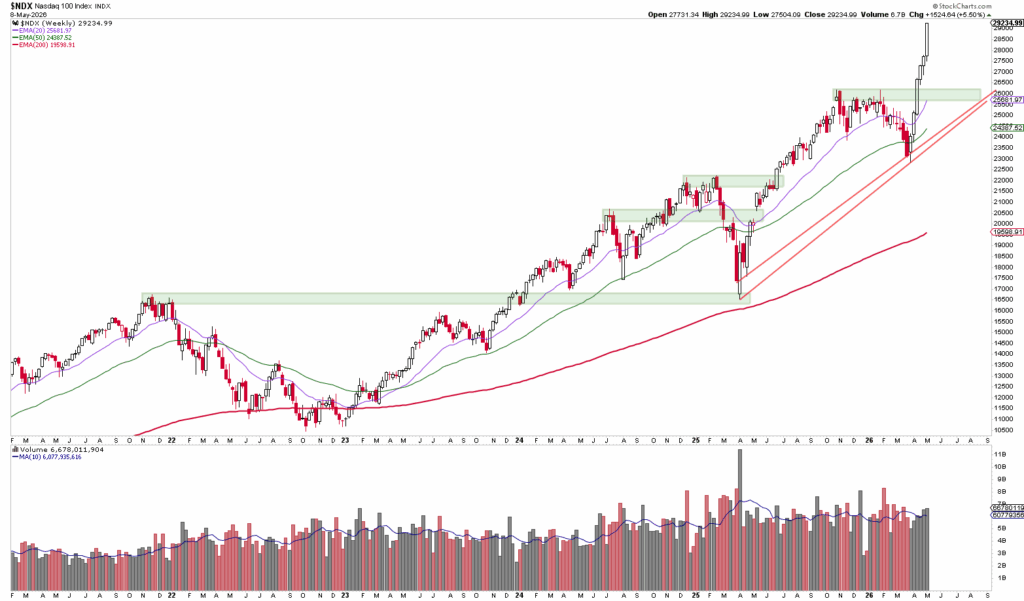
Candlestick chart of the Nasdaq 100 with several moving averages, highlighted support levels signaling a possible recovery, and trading volume bars below the main chart.

Dear traders, dear stock market friends. The relative weakness of the Nasdaq 100 against the S&P 500 and the Dow Jones continued...

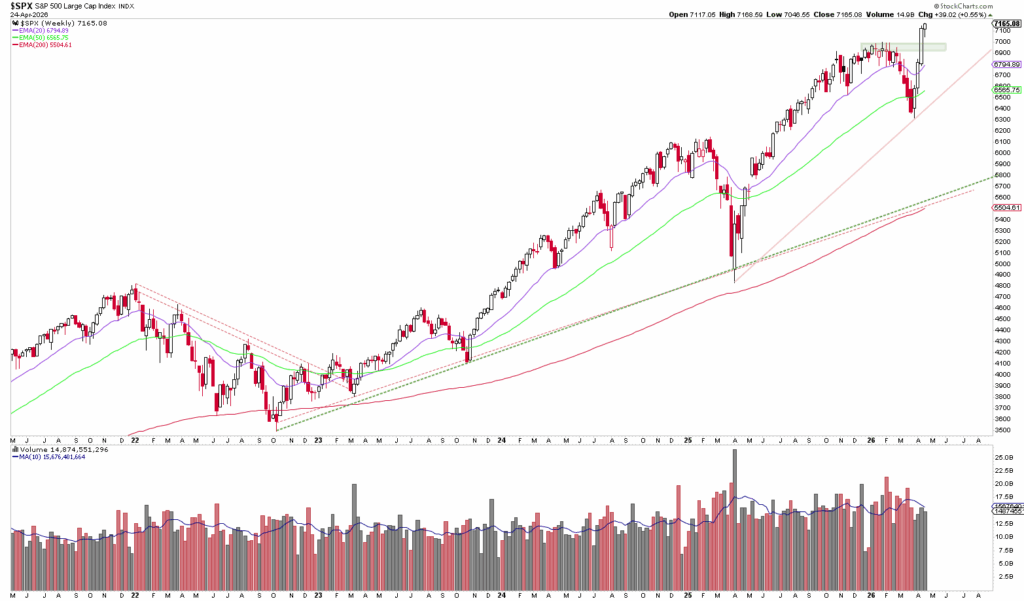
A stock chart shows the SPX price movement with candles, moving averages (20- and 50-day) and volume bars from June 2023 to January 2024, which is similar to an automatically saved draft of the market trends.

Dear traders, dear stock market friends. Last week, the S&P 500 rose above the 7,000-point mark for the first time in its history, albeit...

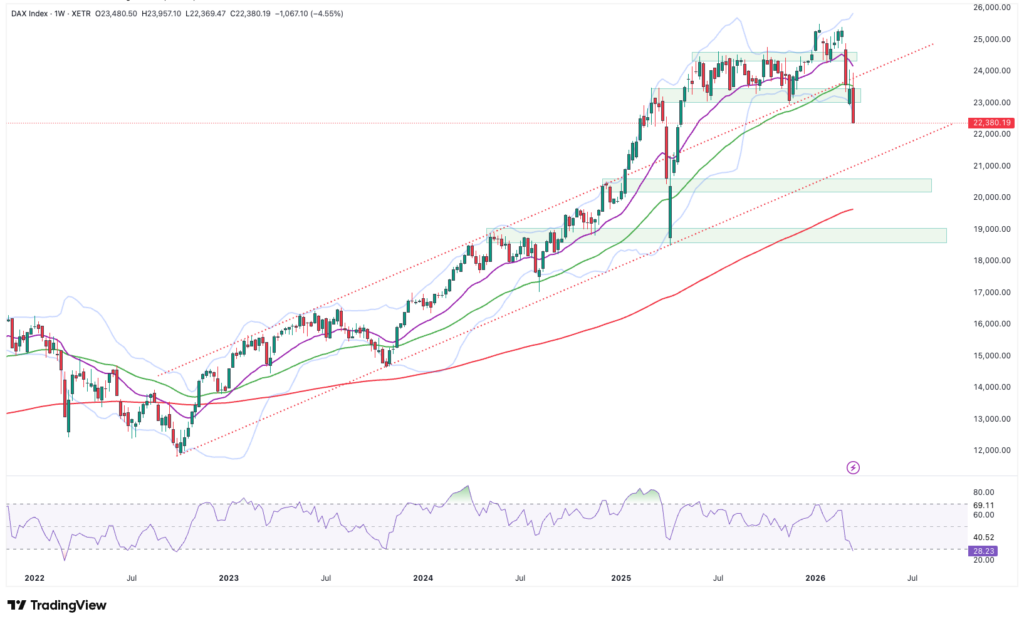
Line chart of the DAX index with price movements, moving averages, support zones and volume bars from May 2023 to February 2024 on a TradingView platform. Automatically saved draft is displayed for your analysis sessions.

Dear traders, dear stock market friends. After a strong start to the year, the DAX came under noticeable pressure in the past trading week. Not because of...

Line chart showing the performance of the Dow Jones Industrial Average Index from the beginning of 2020 to the end of 2021, with volume bars and moving average lines highlighting positive growth prospects and a general upward trend.

Dear traders, dear stock market friends. The Dow Jones is up 2.7 % since the beginning of the year and with this performance is clearly...

Stock chart of the Nasdaq 100 from May 2019 to February 2020, with daily candles, moving average, Bollinger Bands, volume bars, MACD indicator and relative weakness for additional meaning.

Dear traders, dear stock market friends. With a rise of 2.2 %, the Nasdaq 100 has been able to hold its own in the past trading week with...

Email:

info@captrader.com

Send e-mail

Phone:

Hotline (Germany)
0800-8723370

Hotline (International)
00800-08723370

Further contact options