The S&P 500 gained about 3.6 % last week – its best week since November. Sentiment has noticeably brightened, and some calm is slowly returning after the turbulent weeks in March. Nevertheless, a closer look at the charts, the VIX futures curve, and the oil market is worthwhile – as a few open questions remain.
S&P 500 - Recovery is underway
At the beginning of the year, the index was still trading above 7,000. Then came the geopolitical escalations in the Middle East, and the sell-off pushed the S&P temporarily down by almost 9 % from its highs. Currently, futures are trading around 6,816 – a good distance above the March lows and supported by the two-week ceasefire with Iran.
Technically, however, the index is still below the 50-day and 200-day averages, and we've had a „death cross" since the end of March. That sounds more dramatic than it is – but it shows that the recovery still has work to do. The 6,780 mark remains key: if it is sustainably broken, the picture will improve significantly.
VIX Term Structure - What Volatility Really Tells Us
Now it gets exciting. We've looked at the VIX futures term structure. vixcentral.com watched, and it tells an interesting story.
The VIX spot is currently around 21.31. This is neither panic nor complacency – more like „we're not sure what happens next." The futures curve rises evenly from there: the front month of April trades at 21.45, May at 22.07, June at 22.22, and so on up to November at 23.00. Classic contango – longer-dated contracts are more expensive than short-term ones.
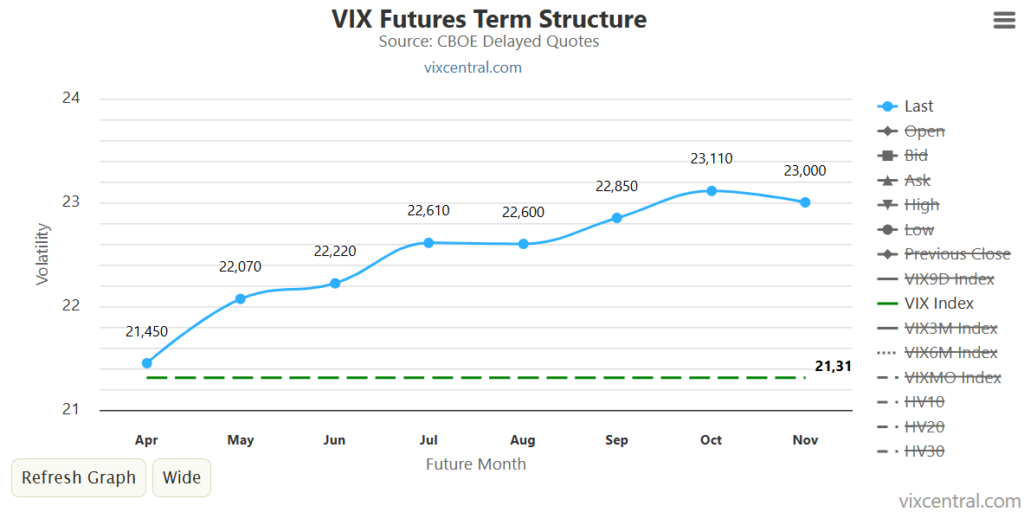
Why is this relevant? Because the steepness of the curve tells us something. The contango premiums between individual months are around 2.9 % (Month 1 to 2), then 0.77 % (2 to 3), and continue to flatten. Therefore, the market is not expecting a short-term volatility shock.
For anyone trading products like the VXX: The contango structure means that roll yield will continue to cost you money. Every month, expiring, cheaper front-month futures are swapped for more expensive following months – a structural headwind that is particularly painful in calm times. Those who are long here need a clear plan and tight timing. However, this effect can naturally be exploited by option traders, for example, by shorting the VXX via bear call spreads.
Crude Oil and OVX - The Elephant in the Room
And with that, we come to the topic that has shaped the entire market dynamic for weeks: oil. The connections are actually simple – but the effects are enormous.
The OVX – the crude oil volatility index – has completely changed in the last twelve months. A year ago, it was around 24, a level we would call „normal." Then came the Middle East conflict, and the OVX shot up to over 125 at one point. Currently, it's fluctuating in the range of 80 to 95 – still extremely high in historical comparison.
What does that mean specifically? The option prices on oil ETFs like USO are massively inflated. This implies: the market expects huge fluctuations in oil prices, in both directions. The ceasefire has calmed the situation somewhat, but the Strait of Hormuz remains a bottleneck whose security hangs by a thread.
Traders can profit from this high implied volatility by trading options strategies such as Iron Flies, Iron Condors, or Butterflies.
Snowflake and IGV - Growth is Punished
To conclude, here are two charts that perfectly illustrate the current market theme at the individual stock level.
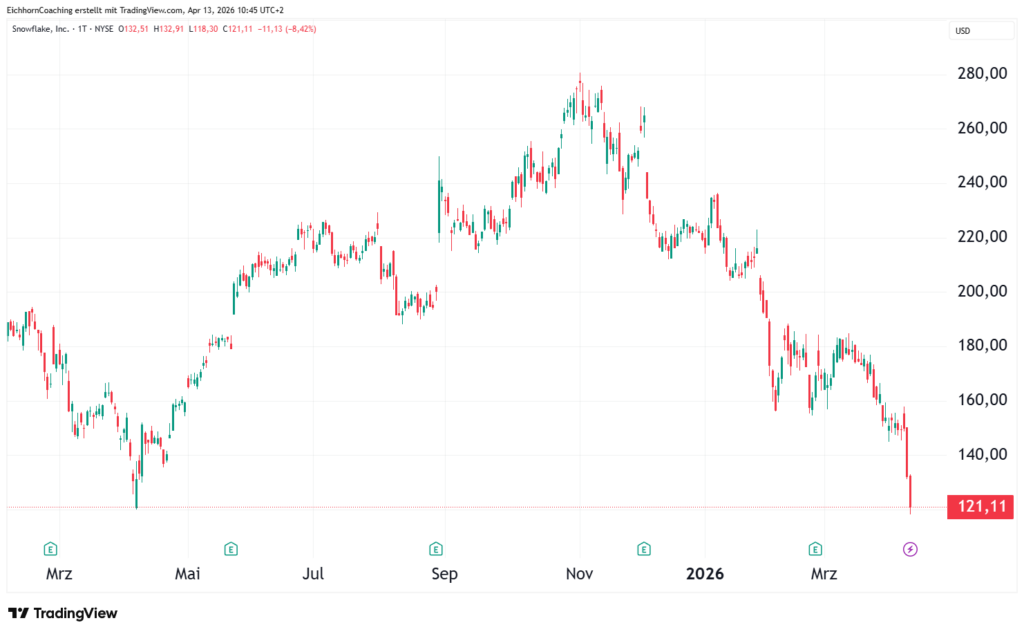
Snowflake (SNOW) notiert bei rund 121 USD und verliert am vergangenen Freitag über 8 %. Von den Hochs über 280 USD aus dem vergangenen Jahr ist das ein Rückgang von mehr als 55 %. Das Unternehmen investiert massiv in KI-Infrastruktur, aber der Markt will Ergebnisse sehen – und zwar jetzt. In einem Hochzinsumfeld werden teure Zukunftsversprechen gnadenlos abgestraft.
Example Cash-Secured Put: Sell-to-Open SNOW Put, Strike $100, Expiration May 15, 2026
- Current price: ~$119 (Closing price April 10)
- Strike: $100 (approx. 16 % out-of-the-money)
- Estimated premium: approx.$3.50– $5.00 per share (at current high IV)
- Cash security: $10,000 per contract (100 × $100 strike)
- Maximum profit: the earned premium, i.e.$350– $500 per contract
- Break Even $100 minus premium = approx.$95– $96.50
- Annualized Return on Capital Employed roughage 35–50 % (with ~5 weeks of operation)
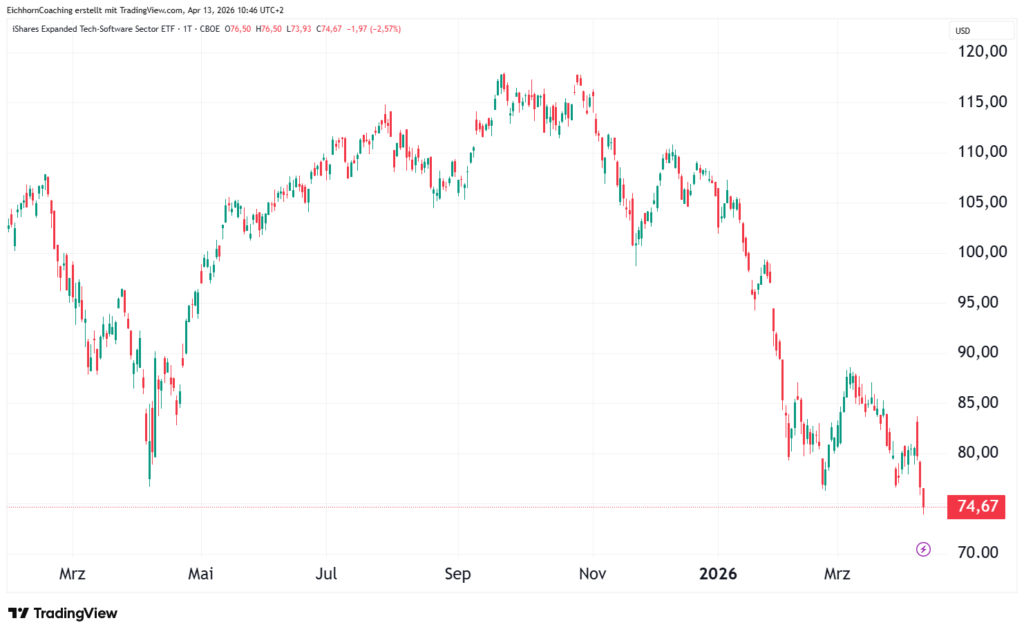
The situation is similarly drastic for the iShares Expanded Tech-Software Sector ETF (IGV). The chart shows a drop of around 37 % – from about $118 to the current level of just under $75. And this is not an obscure niche fund, but a broadly diversified software ETF. When a product like this takes such a hit, it shows how widespread the weakness in the tech sector has become.
Cash-Secured Put on IGV - At The Money
Trade: Sell-to-Open IGV Put, Strike $75, Expires May 15, 2026
- Current price: ~$74,67
- Strike: $75 (slightly in-the-money / almost at-the-money)
- Estimated premium: ca.$4.50– $6.00 per share (ATM puts on IGV are collecting significantly more than OTM at the currently elevated IV)
- Cash security: $7,500 per contract (100 x $75)
- Maximum profit: $$450–$600 per contract (if the IGV is above$75 at expiration)
- Break-Even: $75 minus premium = approx.$69.00– $70.50
- Annualized Return groceries 60–80 % (with ~5 weeks runtime)
The message is clear: the „AI growth at all costs" trade, which still dominated headlines in 2025, no longer works. Investors want profitability and cash flow – not PowerPoint slides about the AI revolution.
Almost the entire software market has gigantic premiums, which options traders could also use in the form of cash-secured puts. Of course, these trades are not a guaranteed profit, but the risk-reward ratio shifts significantly in favor of the option seller.
What we should focus on now
In the coming weeks, there are two crucial variables that can push the market in one direction or the other.
First, the ceasefire. The current ceasefire between the US and Iran is limited to two weeks. If it holds, the oil market could continue to stabilize, which would provide a tailwind for the overall stock market. If it fails, we will quickly be back to OVX values above 100 – and the S&P 500 will likely test its March lows again.
Second, the earnings season. Apple and Microsoft report at the end of April. If these two heavyweights can deliver – especially regarding the monetization of their AI investments – that could be enough to break the 50-day moving average at 6,780. If they disappoint, the fragile recovery will very quickly turn into a bull trap.
Conclusion
We are in a phase where the markets are technically weak, and geopolitical uncertainty is overshadowing everything. The VIX futures curve indicates that the market is no longer expecting a strong sell-off. The high OVX opens up many opportunities for option sellers. Additionally, there are high premium income opportunities in software stocks.
What does this mean for us as traders? Seize opportunities, observe premium levels, and wait for targeted chances. In such market phases, the best trades often arise – but only if you have patience and don't blindly jump into the market. Volatility is there, premiums are high – but you still need to have risk and money management under control.