The second quarter 2026 reporting season has now concluded, and with that, it is time once again for the REIT Q2'26 sector overview. Just like last time, I don't just want to report the numbers of individual companies, but also look at how the environment in the respective real estate sectors has evolved. This time, Residential, Net Lease, and Industrial REITs are in focus. Furthermore, I would like to share my latest article on the topic with you Alternative Asset Manager and REITs recommend. But now, enjoy reading!
Before we look at the individual REITs, however, there is no getting around interest rates this time.
Interest rates are rising again
The US Federal Reserve has set the target range for the Federal Funds Rate was raised by 25 basis points to 3.75 to 4.00 % yesterday evening. This was justified by the Fed with continued elevated inflation rates.
However, for investors in Real Estate Investment Trusts (REITs), it is not just the short-term key interest rate that is of interest. Even more important are often long-term interest rates, because many real estate companies finance (or can finance) themselves long-term via ten-year or even longer-term bonds.
And there, too, the environment has deteriorated significantly again in recent weeks and months. The yield on 10-year US Treasury bonds rose to briefly over 5 % yesterday, which has several consequences at once.
For bonds already issued, prices normally fall when market yields rise. The longer the maturity of a bond, the stronger this effect can be. The situation is different for newly incurred debt. Here, a company simply has to pay higher interest rates, which, especially for REITs with major pending refinancing needs, can quickly impact Funds from Operations (FFO) or Adjusted Funds from Operations (AFFO).
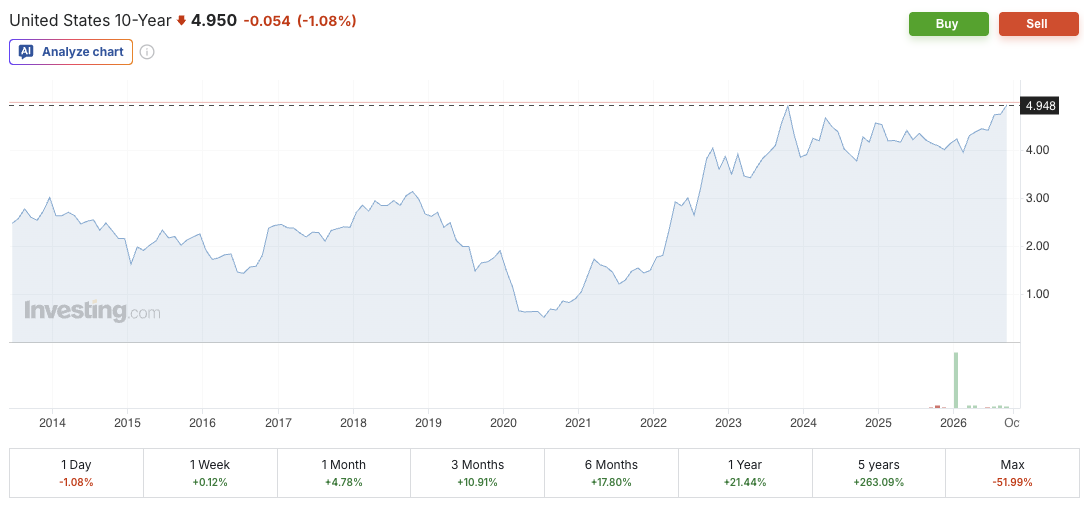
Yield on ten-year US Treasury bonds (source: investing.com)
Added to this is the competition for capital. When investors can achieve a yield of around five percent with a ten-year US Treasury bond, a REIT with a five-percent dividend yield initially appears less attractive than it did a few years ago. The REIT must then compensate for this difference through growth or trade at a correspondingly lower valuation.
That is of course a heavily simplified explanation; in reality it is much more complex, because higher interest rates affect each real estate sector differently:
- Net Lease and cell tower REITs, for example, are particularly interest-rate sensitive because their lease agreements often have very long terms and the annual rent increases (often tied to inflation) are relatively low. Already in the summer, a significantly stronger negative correlation between the prices of net lease REITs and corporate bond yields became visible again.
- In contrast, residential REITs also experience a positive effect. Expensive financing makes new apartment projects less attractive and thus curbs future supply. At the same time, mortgages remain expensive, meaning many households still cannot afford or are less able to afford to buy a home.
- The situation is similar with industrial REITs. Development is becoming more difficult, resulting in fewer new logistics spaces coming onto the market. For owners of existing properties, this is not necessarily a bad thing in the long run.
Residential REITs
The US housing market continues to be in a slow recovery. The large wave of new construction from recent years is now tapering off. In the first half of 2026, net absorption exceeded completions for the first time in about five years. At the same time, the average vacancy rate is beginning to slowly decline. However, this does not yet mean that the market is growing strongly again!
Especially in many Sunbelt markets, the high supply from recent years still needs to be fully absorbed. At the same time, demand remains rather subdued due to weak job growth. On the other hand, the continued poor affordability of homeownership ensures that many potential buyers remain renters for longer.
An interesting aspect now is that, of all places, some of the Sunbelt markets previously hit hardest by new construction are showing the fastest improvements in vacancy rates. At the very least, this suggests that the cyclical trough may slowly be behind us.
Camden Property Trust
Camden Property Trust (TWS-Ticker: CPT, ISIN: US1331311027) was already featured in the Q1 post. Normally, I try to rotate the selections more in these sector overviews, but simply too much has happened at Camden since then to leave it unmentioned.
Core FFO per share came in at $1.68 in the second quarter, slightly below the previous year's figure. The same-property NOI, excluding the now-sold California portfolio, dropped by 1.4 % because revenues remained virtually unchanged while costs increased by 2.4 %.
Operationally, I still think it is heading in the right direction. The Effective New Lease Rates were still down year-on-year at minus 3.3 %, but in Q1 they were still minus 5.5 %. The Renewal Rates increased by 2.8 %, which improved the Blended Lease Rates to just minus 0.2 %.
The occupancy rate also rose from 95.1 % in the first quarter to 95.7 % in the second quarter. The full-year forecast for core FFO remains between $6.60 and $6.90 per share, keeping the midpoint unchanged at $6.75.
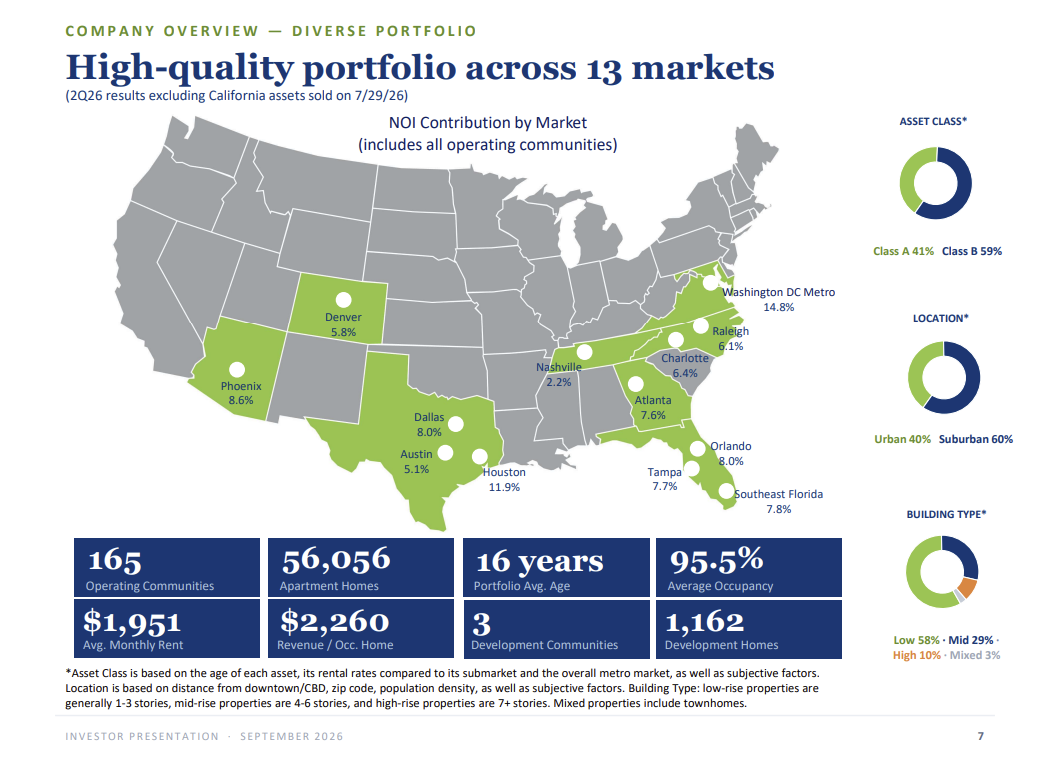
Portfolio diversification (Source: CPT Investor Presentation September 2026)
Meanwhile, there are even initial indications that new leases are actually reaching the long-announced turning point. In July and August, Camden already achieved positive new lease rates again on individual days at the portfolio level.
Even more exciting, however, is the capital allocation. Rather than simply waiting for the aforementioned sale of its California portfolio, Camden had already begun a realignment beforehand. Even before the closing, a total of approximately 693 million USD was deployed for share buybacks in the years 2025 and 2026. The average buyback price was roughly 105 USD per share. Management thus consciously repurchased its own shares at a time when they were trading significantly below the estimated value of the real estate portfolio. And that remains the case.
At the same time, Camden has already begun reallocating capital back into its core markets. By mid-July, seven apartment communities were acquired for approximately $645 million, along with two land parcels for another $45 million. The new properties are located in Atlanta, Orlando, Nashville, Dallas, Phoenix, Tampa, and Charlotte, among others. In total, approximately $690 million has thus already flowed back into the Sunbelt even before the completion of the California sale.
The actual sale of the eleven communities with a total of 3,620 apartments in California was completed on July 29 for approximately 1.625 billion USD. Around 900 million USD of the proceeds are to be used to repay short-term debt. Further acquisitions were also planned, allowing Camden to simultaneously strengthen its balance sheet and align its portfolio even more strongly with its core Sunbelt markets, where management expects stronger rental growth again in the coming years. It is precisely this combination that I find interesting!
At a price of $101.30 on September 16, the core FFO guidance of $6.75 corresponds to approximately 15 times core FFO. If the Sunbelt market does indeed normalize in the coming years, Camden should benefit disproportionately from this portfolio realignment.
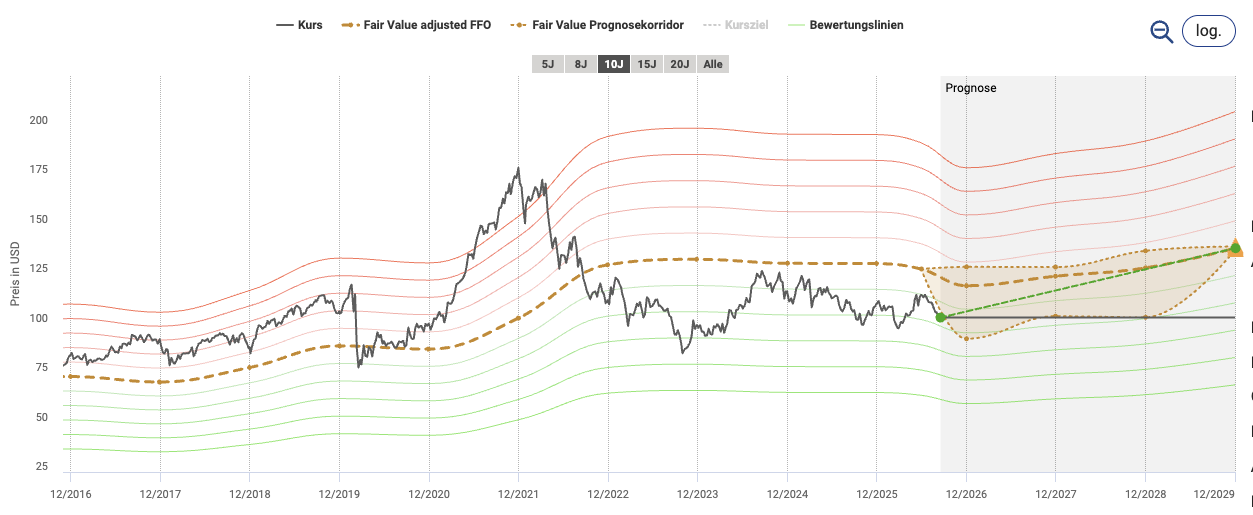
Fair Value Camden Property Trust (Source: aktienfinder.net)
Invitation Homes
Invitation Homes (TWS-Ticker: INVH, ISIN: US46187W1071) is not a traditional apartment REIT; rather, it owns and rents out single-family homes, which is why the company could be interesting in the current interest rate environment. Higher mortgage rates are naturally negative for a potential homebuyer. For a single-family home landlord, however, precisely this can lead to people renting for longer.
In Q2, Invitation Homes pointed out that renting a house in its markets is on average more than $1,000 per month cheaper than buying a comparable home.
This demand is also reflected in the figures. Core FFO per share rose by 5 % in the second quarter to $0.51, and AFFO per share increased by 5.9 % to $0.44. Same-store NOI climbed by 1.5 %, and the average occupancy rate stood at 97.1 %. Rental growth also turned positive again. New leases rose by 1.1 %, and renewals by 3.3 %, resulting in blended rent growth of 2.7 %.
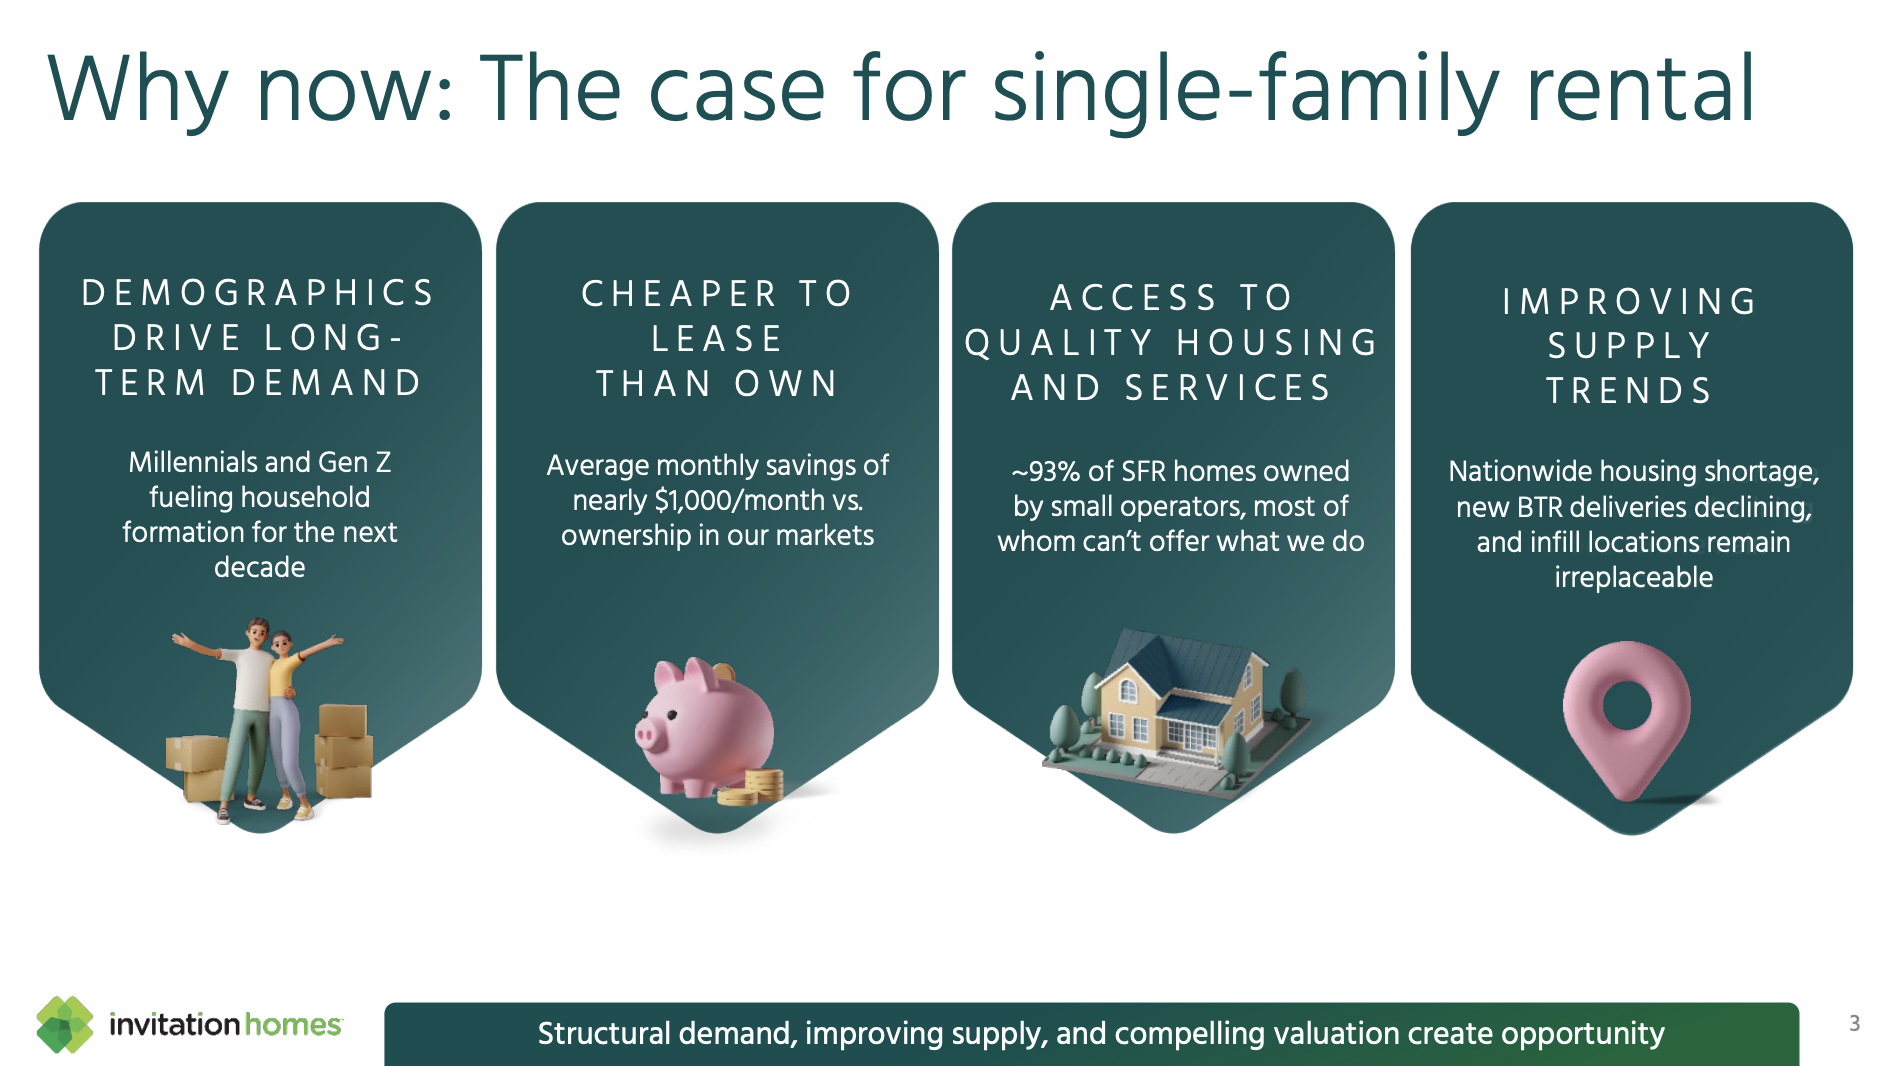
Simplified investment case regarding Single Family Rental (Source: INVH Investor Presentation June 2026)
Management simultaneously uses the difference between private house prices and the valuation on the stock exchange. Houses are sold where private buyers are paying attractive prices, while the proceeds partly flow into its own shares.
Since December 2025, Invitation Homes has already repurchased approximately USD 600 million worth of shares. At the same time, the full-year forecast was raised slightly. For 2026, the company now expects a core FFO of around USD 1.95 per share and an AFFO of approximately USD 1.65.
At a price of $27.21 on September 16, INVH thus trades at approximately 14 times the expected core FFO.
What I find interesting here is the certain hedging in both directions. If mortgage rates remain high, buying a house remains unaffordable for many people, and rental demand is likely to stay high. If, on the other hand, interest rates drop significantly at some point, private home prices tend to rise, and Invitation Homes could sell real estate more attractively.
Net Lease REITs
In hardly any other real estate sector is the influence of interest rates as immediately visible as in net lease REITs. The lease agreements of such REITs often run for ten, 15, or even 20 years. At the same time, many operating costs are borne by the tenant, and annual rent increases frequently range in only the low single-digit percentage.
While this makes the cash flows extremely predictable, it also makes them more comparable to a long-term bond. If the yield on a ten-year government bond rises, the expected return of a net lease REIT must also increase accordingly. This can happen through lower share prices, higher dividend yields, or faster AFFO growth.
Operationally, nothing at all needs to go wrong initially. The properties remain rented, and tenants continue to pay. Rather, the higher interest rate level becomes problematic for refinancings and external growth. For example, a real estate purchase with a seven percent initial yield is much more attractive when your own cost of debt is four percent instead of six percent.
NNN REIT
NNN REIT (TWS ticker: NNN, ISIN: US6374171063) is one of the most established representatives of this asset class. In Q2, the company once again did, quite unspectacularly, exactly what is expected of NNN.
AFFO per share rose by 5.9 % to $0.90. At the same time, NNN acquired new real estate for $291 million, with an initial cash cap rate of 7.3 % and an average lease term of 17.9 years. The occupancy rate rose to 99.1 %. Due to the strong performance, management raised the AFFO guidance for 2026 to $3.55 to $3.59 per share. At the same time, the expected acquisition volume was increased to $700 to $800 million.
NNN also delivered on dividends. In July, the quarterly dividend was increased by 3.3 % to $0.62. This means the company has now increased its payout for 37 consecutive years.
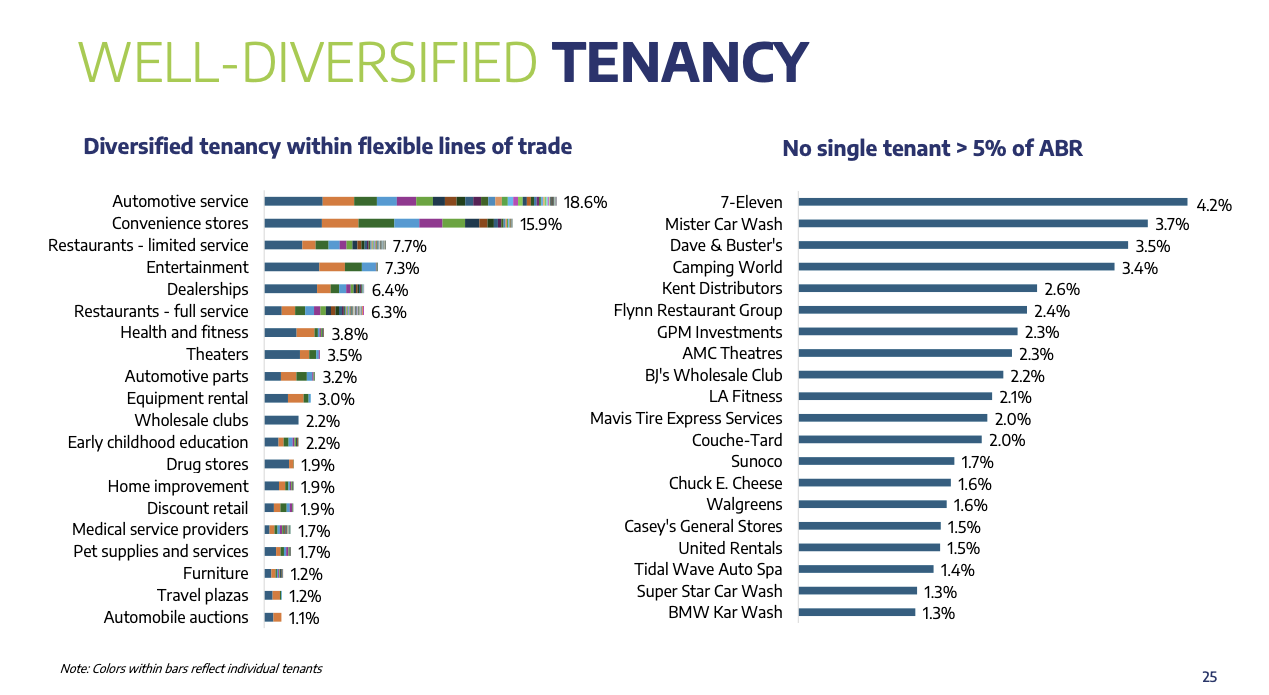
Tenant overview (Source: NNN Investor Presentation August 2026)
Nevertheless, the current interest rate environment remains relevant. The real estate that NNN acquires currently yields cap rates above seven percent. As long as the company can raise equity and debt at significantly lower costs, this generates additional AFFO per share. If, on the other hand, the cost of capital rises too sharply, this spread shrinks.
Add to this the long duration of the cash flows. At the end of Q2, NNN owned 3,774 properties with a weighted average remaining lease term of around 10.1 years. In a way, this makes NNN precisely what many investors look for in a net lease REIT. The growth is not spectacular, but in return, the cash flows are highly predictable and the dividend has been increasing for decades.
VICI Properties
VICI Properties (TWS-Ticker: VICI, ISIN: US9256521090) also fundamentally operates on the triple-net-lease principle, but owns completely different real estate than NNN. The portfolio consists predominantly of casinos, resorts, and other so-called experiential assets. These include well-known properties such as Caesars Palace, MGM Grand, and The Venetian in Las Vegas.
Operating results for Q2 were once again solid. AFFO rose 7.8 % year-over-year to just under $680 million. VICI earned $0.62 per share, representing an increase of 4.6 %. AFFO guidance for the full year is $2.45 to $2.47 per share.
At the same time, VICI has continued to grow. At the end of April, seven casino properties from Golden Entertainment were acquired for around $1.16 billion. This resulted in a new master lease with an initial annual rent of $87 million. In addition, there are further investments such as Club Med on St. Croix, through which VICI is attempting to gradually reduce its dependence on the two major gaming tenants.
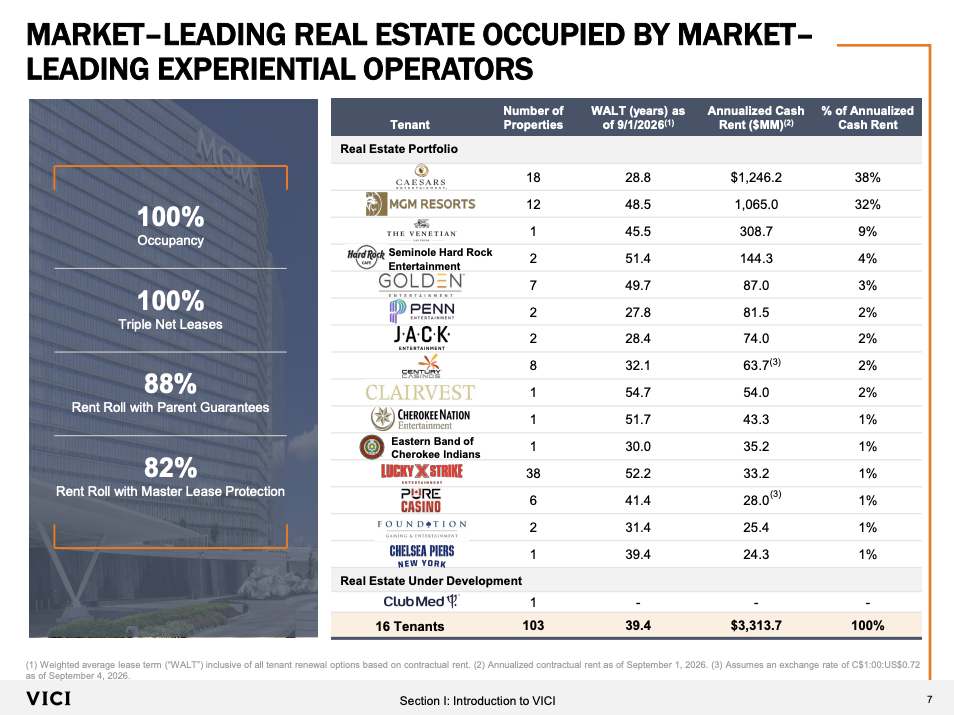
Tenant concentration in the VICI portfolio (Source: VICI Investor Presentation)
However, precisely this dependency is currently one of the points that I would watch particularly closely in the case of VICI. Caesars Entertainment is set to be acquired by Fertitta Entertainment for around 17.6 billion USD, including the assumption of roughly 11.9 billion USD in debt. The deal has not yet closed and still requires regulatory approvals, among other things. Nevertheless, the transaction is relevant for VICI because Caesars remains the REIT's largest tenant. As of September 1, around 38 % of the annualized contractual rent comes from Caesars, with another 32 % from MGM Resorts. This means that about 70 % of the total rent depends on just two companies.
The issue is less about whether Caesars pays its rent in the short term. VICI continues to have 100 % occupancy, all properties are leased via triple-net leases, and a large portion of the lease agreements feature parent guarantees or master lease protection.
More interesting is the trend in rent coverage. VICI itself has already pointed out that the profitability of individual regional Caesars properties has declined. At the same time, the Caesars Regional Master Lease protects VICI against short-term operational issues due to its long remaining term and the parent company's guarantee.
Caesars itself also paints a mixed picture. In the first quarter, the regional segment's adjusted EBITDA declined from 440 to 435 million USD, even though revenues increased by three percent. While Caesars portrayed the development more positively when adjusted for a special one-time effect from the previous year, the operating momentum remains something that VICI investors should keep an eye on.
The structure of the lease agreements also plays a role in this. The Caesars Regional and Las Vegas Master Leases are currently in their ninth lease year. Caesars rents generally increase annually by the higher of 2 % and the contractually defined change in the consumer price index. In Lease Years 11 and 16, a portion of the rent will also become variable and tied to revenue performance.
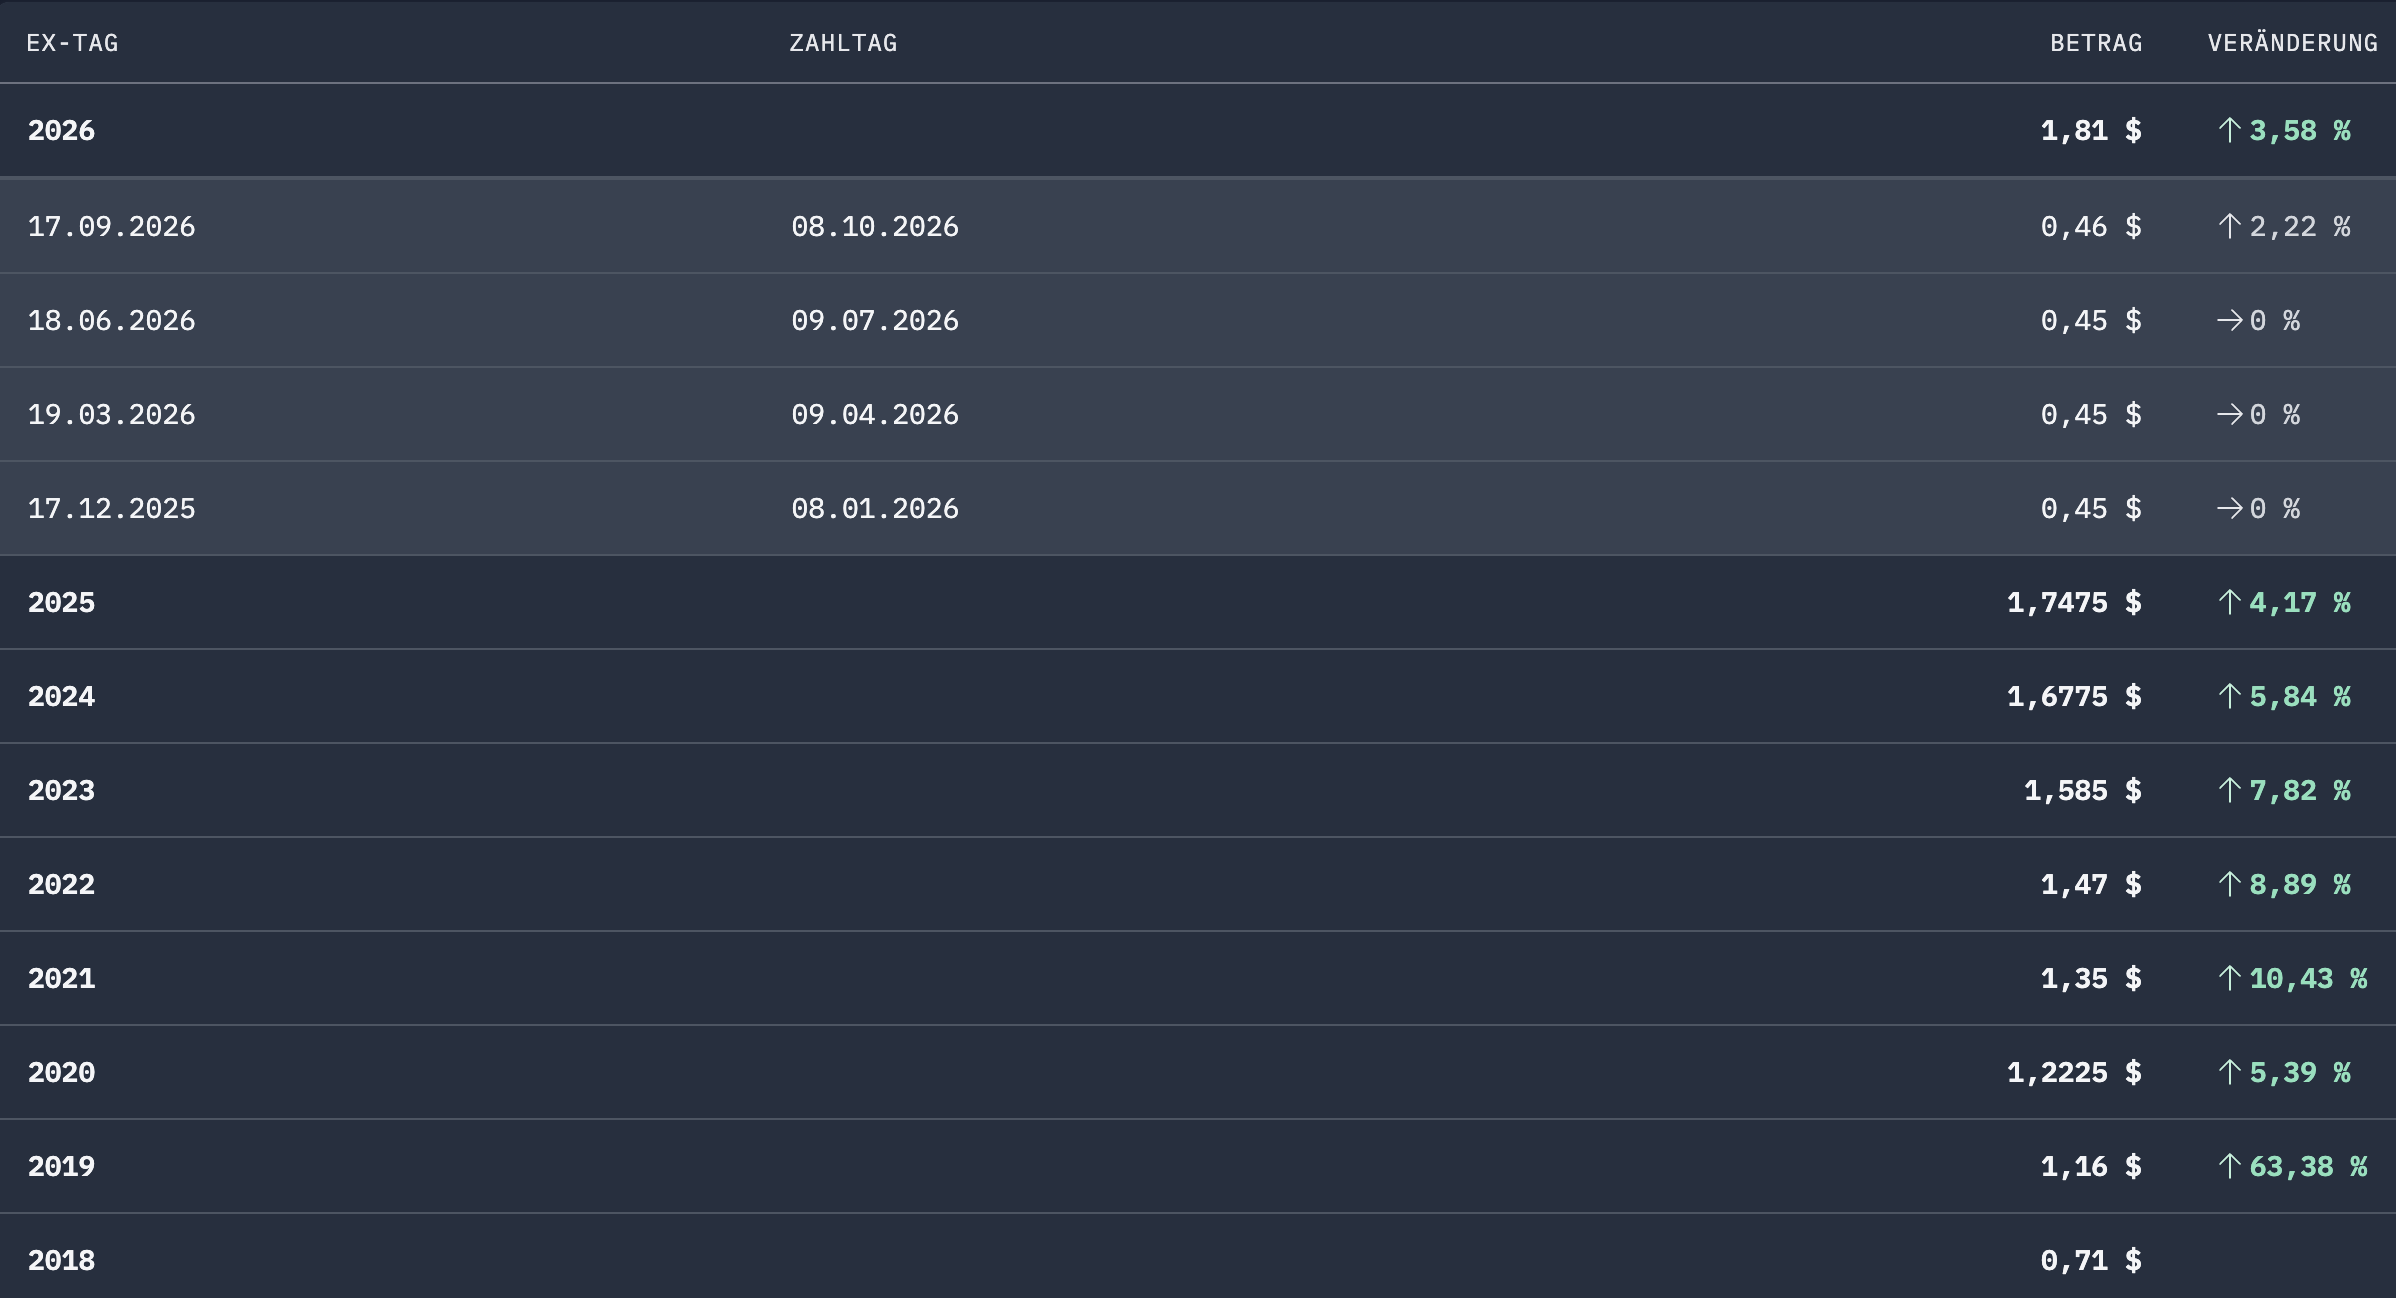
Dividend history VICI Properties (Source: DivvyDiary)
That is precisely where the real risk lies for me. If profitability at Caesars permanently declines, the rent coverage deteriorates first. Later, weaker revenue growth could also limit the growth of the variable rent components. Less rent growth, in turn, would slow down VICI's future AFFO growth and potentially jeopardize dividend coverage.
We are still a good way off from an acute dividend problem. Based on the midpoint of the current AFFO guidance of $2.46 and an annualized dividend of $1.84, the payout ratio is just under 75 %. The dividend is thus still solidly covered and was even increased once more by 2.2 % at the beginning of September to $0.46 per quarter.
Diversification is also progressing, at least slowly. A few years ago, Caesars accounted for a much larger share of rental income. At the beginning of 2026, it was around 39 %, and currently it is 38 %. Golden Entertainment now contributes three percent of annualized rents, and further investments outside the traditional casino segment are expected to reduce concentration further in the long term.
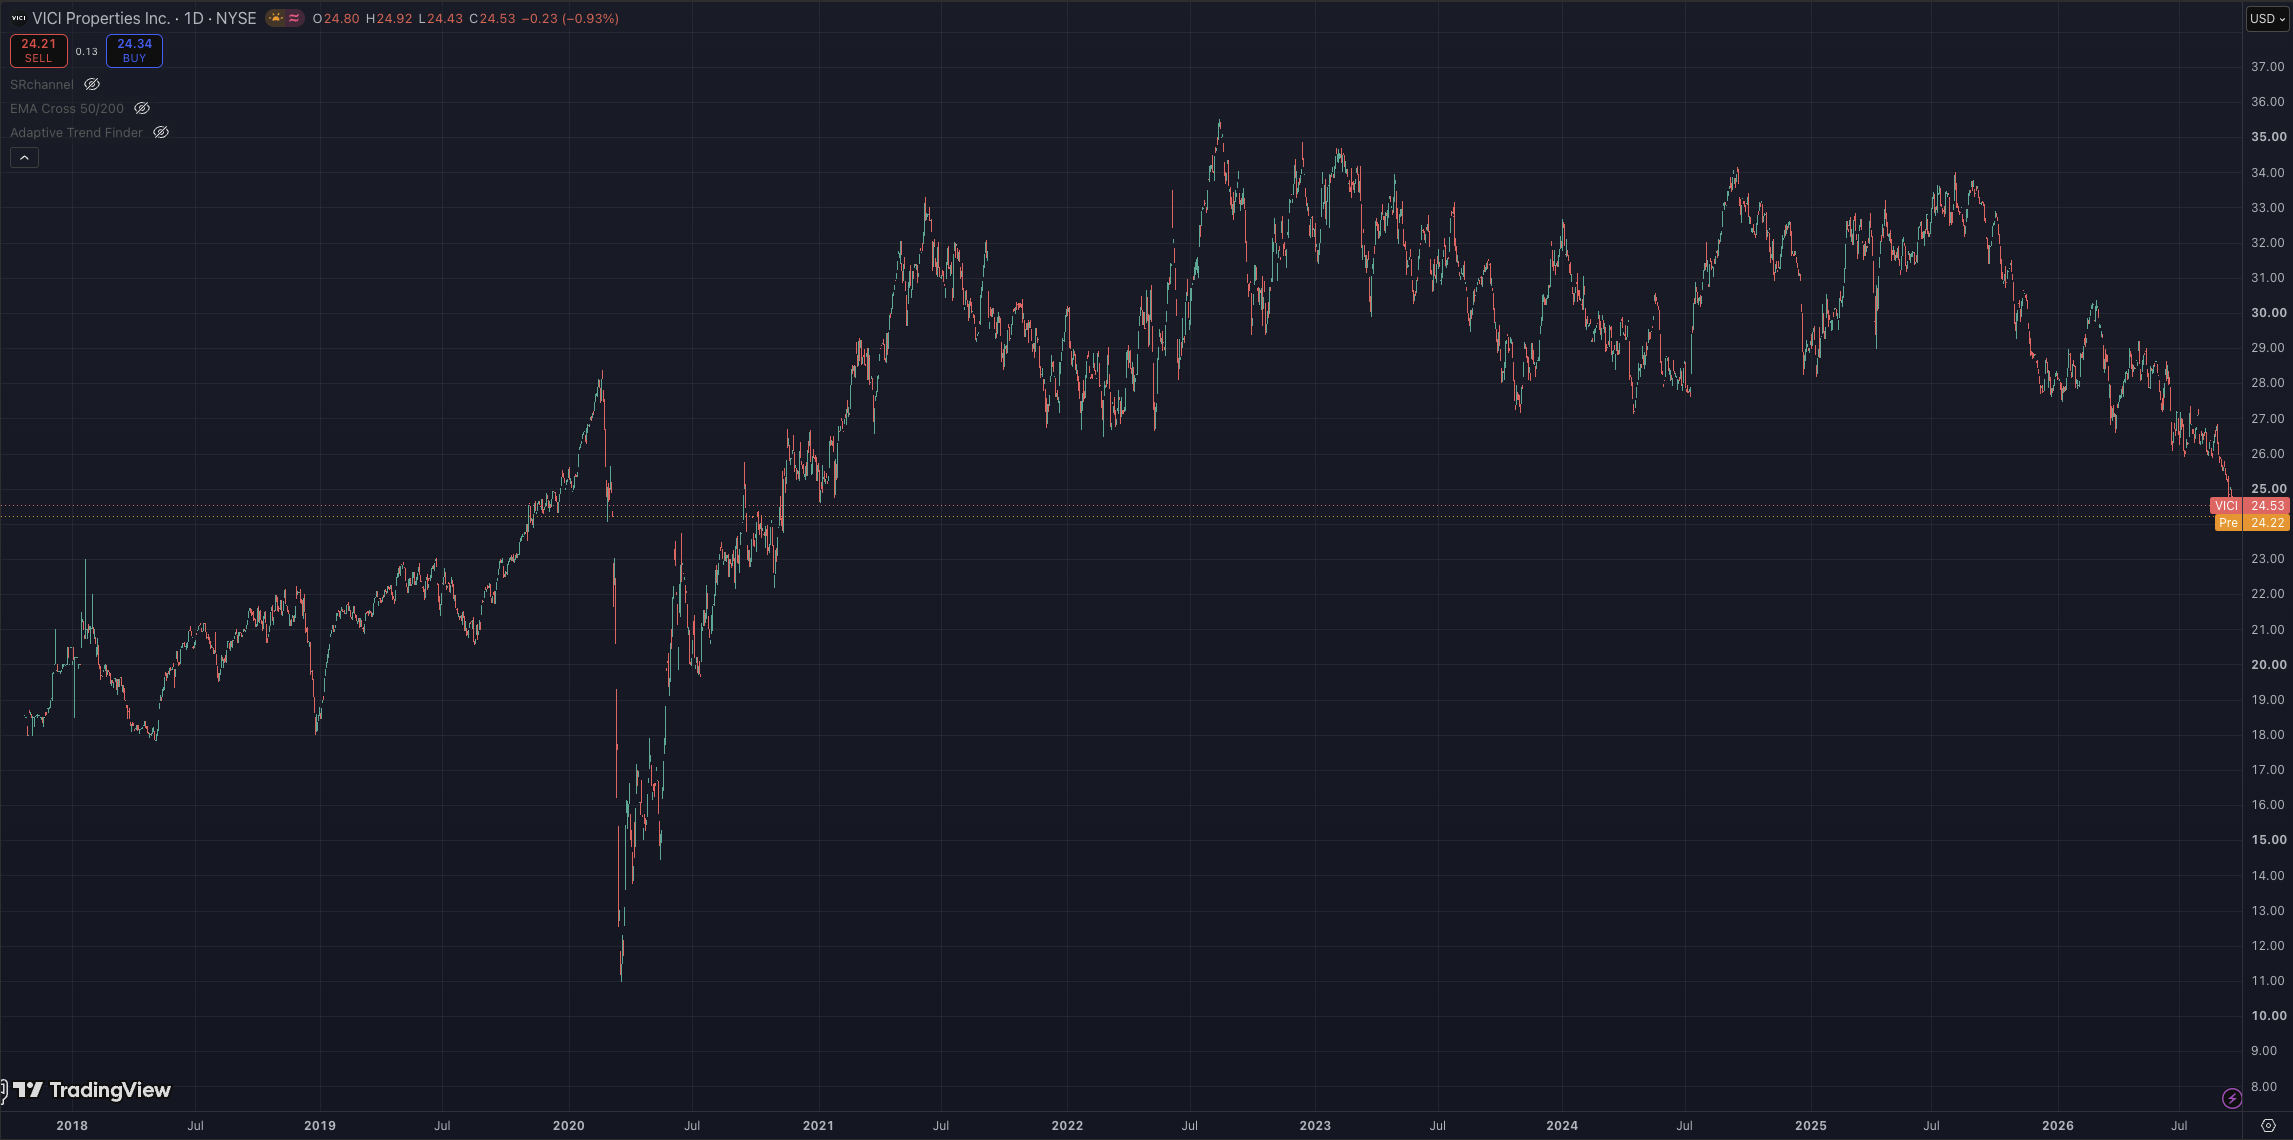
VICI Properties Chart (Source: TradingView)
Despite this continued solid operational starting position, the stock has lost significant value. Alongside the high tenant concentration, the interest rate environment is likely playing a major role. VICI possesses extremely long-term cash flows and therefore reacts to rising yields similarly to a long-term bond.
For me, two things are crucial right now. From a chart analysis perspective, it would be interesting to see if a bottom forms after the significant price decline. Fundamentally, on the other hand, I would primarily keep an eye on Caesars. The decisive factors are less about individual quarters and more about the trend in rent coverage and the question of how much VICI will be able to further reduce its dependence on Caesars and MGM in the coming years.
Industrial REITs
This time, the third sector is about industrial REITs. Higher interest rates affect this area in two ways. Of course, acquisitions and new development projects become more expensive. At the same time, however, the number of new projects is also decreasing, which limits future supply.
Precisely this development is now visible. After the new supply grew faster than demand for three years, supply and demand converged again in H1 2026. At the same time, the development pipeline has remained relatively low. High construction costs and financing costs simply make many new projects no longer attractive.
Rental growth has also improved again. Asking rents rose by 2.9 % year-on-year in Q2, after being only 2.1 % in Q1.
On the demand side, in addition to e-commerce, logistics, and manufacturing, new momentum is now coming from data centers and the expansion of AI infrastructure. Large warehouses in particular are benefiting in part from the fact that servers, cooling technology, and other equipment need to be stored and distributed somewhere.
EastGroup Properties
EastGroup Properties (TWS-Ticker: EGP, ISIN: US2772761019) is for me one of the highest-quality industrial REITs. The company predominantly owns smaller to medium-sized logistics and industrial properties in high-growth Sunbelt markets and develops a significant portion of its portfolio itself.
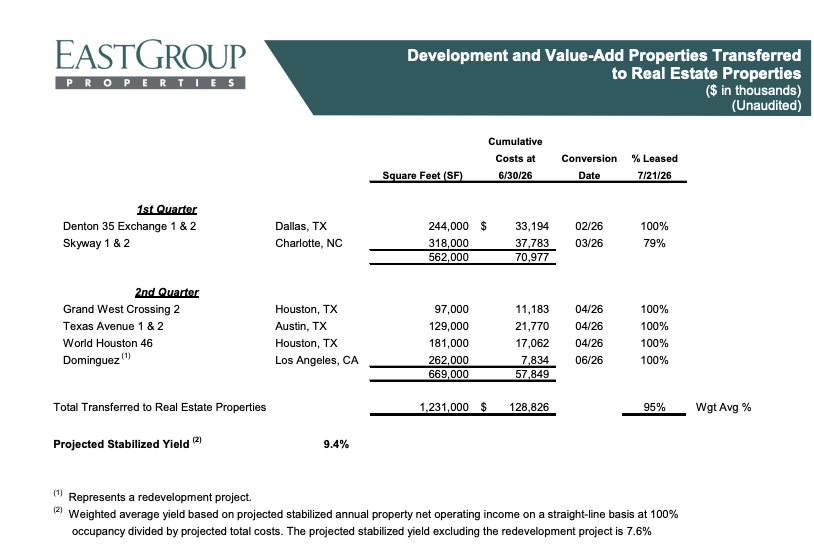
Development/Value-Add projects transferred to the EastGroup Portfolio
(Source: EGP Q2 2026 Financial Supplement)
The second-quarter figures turned out correspondingly strong. FFO per share increased by 6.8 % to $2.36. Same-property NOI on a cash basis even grew by 8.3 %. The average occupancy rate was 95.6 %.
What I find even more impressive are the rent increases. For new and renewed leases, straight-line rents rose by an average of 34,1 %!
EastGroup also remains active in project development. In the second quarter, four projects totaling 669,000 square feet were transferred into the operating portfolio, all of which were fully leased. At the same time, new projects were launched in Charlotte and Houston. At the end of Q2, EGP had a total of 17 development and so-called value-add projects in the pipeline, comprising approximately 3.2 million square feet and planned costs of just under $487 million.
For EastGroup, higher interest rates are therefore naturally also unpleasant in the short term. At the same time, these exact financing costs ensure that (even the) competitors start fewer new projects.
Added to this is a very solid balance sheet. Net Debt/EBITDA is around 3.0x, which is significantly below the leverage of many other REITs. However, you don't get this quality cheaply. EastGroup continues to trade at a significant valuation premium compared to many other industrial REITs.
At the same time, the payout is growing substantially. At the end of August, the quarterly dividend was increased by 12.9 % to $1.75.
Rexford Industrial Realty
Rexford Industrial Realty (TWS-Ticker: REXR, ISIN: US76169C1009) is almost the counterpart to EastGroup within this sector. While EGP continues to grow operationally and is valued accordingly, Rexford is still in the middle of normalizing its market.
The company focuses exclusively on industrial real estate in infill Southern California. At the end of the second quarter, the portfolio consisted of 409 properties with nearly 50 million square feet of space.
Nevertheless, the core FFO per share increased by 6,8 % to USD 0.63. However, this is partly due to accretive share buybacks, as the total core FFO only grew by 1,2 %. The operating business looked quite mixed. Same-property cash NOI increased by 1,5 %, while net effective NOI fell by 0,5 %. The average same-property occupancy rate was 95,7 %.
The headwind is more clearly visible in the leasing spreads. Cash rents fell by 19,5 % for new leases and by 8,1 % for renewals. Across all leases, the decline was 11,3 %. Management is responding to this with a very aggressive capital allocation.
Meanwhile, real estate valued at 1.5 to 2 billion USD is scheduled to be sold for 2026. As recently as Q1, the guidance had been merely 400 to 500 million USD. Part of the capital is to be used for debt reduction, and another part will flow into share buybacks.
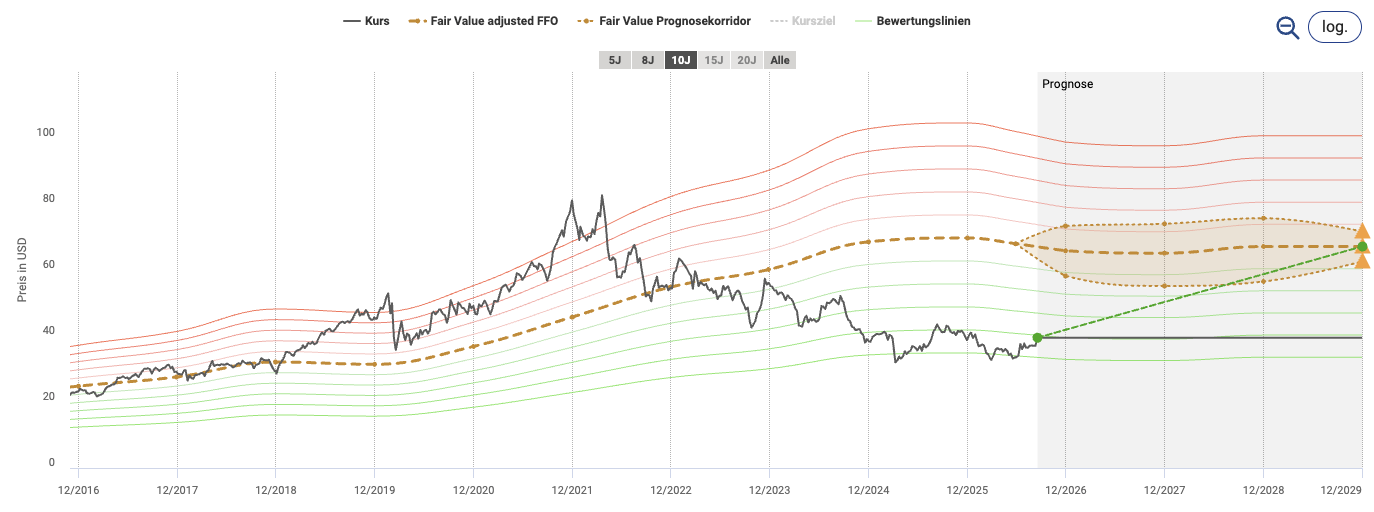
Fair value Rexford Industrial Realty (Source: aktienfinder.net)
In Q2, REXR already spent around 100 million USD on share buybacks, and a new 1 billion USD buyback program was approved after the end of the quarter. At the same time, proceeds from the sales are to be used, among other things, to repay debt maturing in 2027. Instead of refinancing old debt at high interest rates while simultaneously buying new properties, the company is selling individual assets at private market values, reducing debt, and buying back its own shares when they are valued lower than the underlying real estate. Incidentally, net debt to adjusted EBITDAre stood at 4.5x at the end of Q2.
Rexford is therefore significantly more speculative than EastGroup. Rent growth is currently weak and Southern California first needs to recover further operationally. In return, you get a significantly lower valuation and a management that is actively exploiting the discount to the private real estate market.
Options trading
As is well known, I also actively trade options myself, predominantly as a writer. Due to the recent movement in interest rates, there has been some more movement in REIT prices again. The Volatility (VIX) is still just over 15 again, and accordingly the premiums are lower.
- Camden Property TrustFor CPT, there are opportunities at the money Short Puts mit Strike of $100 in November '26 that provide decent premiums (slightly higher spread) or longer-term short puts with Strike of $100 or less in September '27
- VICI PropertiesAt VICI, actually only long-term ones are suitable in the money Short Puts with Strike of $25 or lower in June '27 (increased spread)
- Rexford Industrial RealtyFor REXR, selling short puts is an option with Strike of $35 in December '26 ones that bring in some premium (increased spread)
- NNN REITFor NNN, selling short puts is suitable with Strike of $40 in December '26 to those who provide some premium
- Invitation HomesFor INVH, slightly longer-term short puts with Strike of $25 in April '27 those that provide some premium (increased spread)
- EastGroup PropertiesFor EGP, it is recommended to Bull Put Spreads mit Strike of $195 and $190 in December '26 to
Conclusion
In the Q2 2026 REIT sector overview, it became clear once again why you shouldn't simply look at interest rates across the board when it comes to REITs. Of course, rising interest rates are initially negative. New debt becomes more expensive, existing bonds lose value, and investors' yield requirements increase.
However, what happens after that depends heavily on the respective real estate sector. In the case of residential REITs, the operational recovery is proceeding more slowly than many investors expected a year ago, but it is now at least becoming visible. Completions are declining, vacancies are starting to fall, and REITs like CPT have already seen their first positive days in new leasing. At the same otherworldly, single-family homes remain largely unaffordable, which benefits companies like Invitation Homes, for example.
For Net Lease REITs, the relationship with interest rates (and rate hikes) is much more direct. NNN and VICI continue to deliver solid operating results, but their long-term and easily predictable cash flows face stronger competition from bonds. When ten-year Treasuries offer yields around five percent, the yield requirements for such REITs also rise. Without correspondingly higher growth, this tends to create pressure on valuation multiples.
By contrast, an interesting side effect is emerging with industrial REITs. High financing costs are slowing down new development projects and thereby ensuring that future supply remains small(er). EastGroup is already benefiting from strong leasing spreads and a highly profitable development program. Rexford is still earlier in the cycle and is attempting to leverage the valuation discount for its own shareholders through property sales, debt reduction, and share buybacks.
In the end, the balance sheet remains the deciding factor for me this quarter as well. A company like EastGroup, with a net debt-to-EBITDA ratio of around 3x, can handle a further rise in interest rates much more comfortably than a highly indebted REIT with major refinancing needs in the coming two years.
The recent interest rate hike does not automatically make REITs less attractive. Rather, it ensures that the differences between individual companies become greater and more visible again. And that is actually not a bad starting point for stock pickers.