


Looking back at the DGI model portfolio, I provide a transparent insight into the development of the individual stocks in the portfolio in Q2 2026, determine the total return, and highlight the outperformers and underperformers in the portfolio. I also discuss the recent changes in the portfolio.
Facts and figures for Q2 2026
At the beginning, I look at the total portfolio level before I dedicate myself to individual stocks in the next chapter. The DGI model portfolio was started with an initial capital of 100.000 Euro equipped. As of June 30, 2026, approximately 86,500 Euros or over 85 percent of the total amount invested.
The following chart shows the consistently positive development of the dividend staircase. Since the portfolio was launched, the companies invested in the depot have transferred around €5,000 to my cash account in total.

Taking all investments into account, I'm proceeding with a Liquidity reserve from around 20,500 Euros into the second quarter. The unrealized gains amount to over 18,500 Euros. All relevant depot components are summarized here in a table:
| Start-up capital 22.03.2024 | 100.000,00 |
| Invested capital | 86.323,90 |
| Unrealized capital gains | 23.446,35 |
| End value 06/30/2026 | 109.770,24 |
| Free starting capital 06/30/2026 | 13.676,10 |
| Dividends received | 4.994,19 |
| Total liquidity reserve 06/30/2026 | 18.670,29 |
The current Personal dividend yield 3 percent. This result corresponds to a moderate increase of 10 basis points compared to the last quarter. As a reminder, the calculation methodology: Only the actual dividends received are divided by the total invested capital. Thus, in the second quarter, the distributions from annual payers (Münchener Rück, Brenntag) and semi-annual payers (Ahold Delhaize, Rio Tinto, Diageo, LVMH) are taken into account.
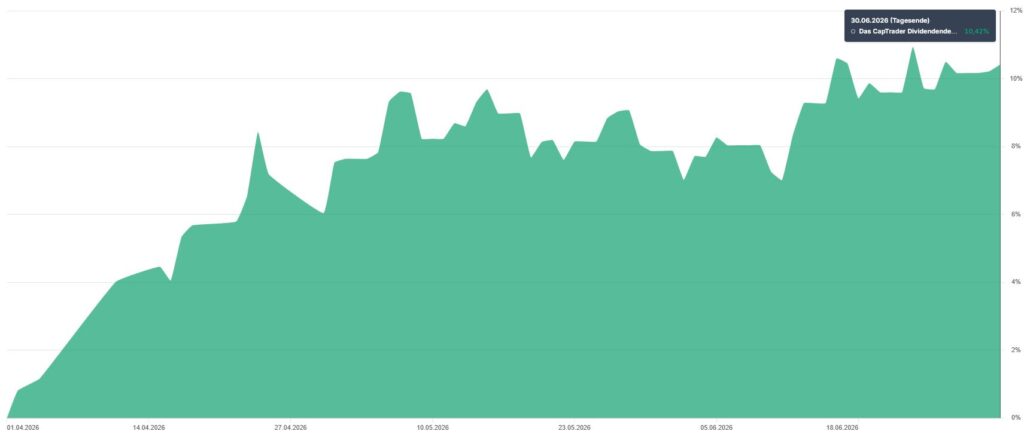
In the second quarter of 2026, the model portfolio recorded a value increase of 10.4 percent. Here I consider the Total Return, i.e. realized and unrealized capital gains and dividends received.
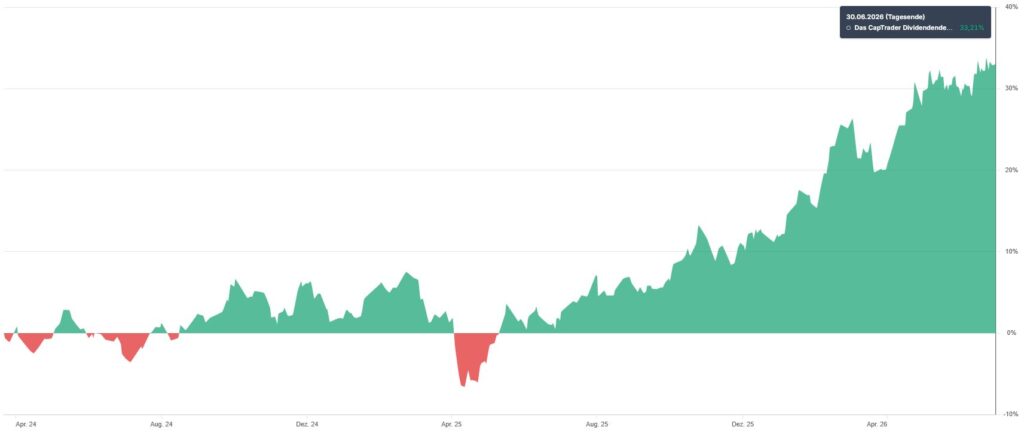
Given the short time frame—the portfolio was launched in March 2024—this review of its performance does not yet provide much insight. The goal is for the individual stocks in the portfolio to realize their full potential over the long term—at least ten years. That’s why we’ll move right on to the next chapter and discuss the individual stocks.
Deep-dive single stocks
As of mid-year, a total of 27 Assets in the custody account, which are exclusively individual values. In the second quarter, I 6 subsequent purchases made, which I list chronologically below:
| Purchase date | Company (Ticker) | Total investment in € | Quantity |
|---|---|---|---|
| 05.05.2026 | LVMH (MC.PA) | 450,00 | 1 |
| 13.05.2026 | Roper Technologies (ROP) | 268,87 | 1 |
| 03.06.2026 | Tractor Supply (TSCO) | 624,37 | 25 |
| 05.06.2026 | Munich Re (MUV2.DE) | 445,00 | 1 |
| 18.06.2026 | Comcast (CMCSA) | 490,77 | 25 |
| 25.06.2026 | Microsoft (MSFT) | 616,17 | 2 |
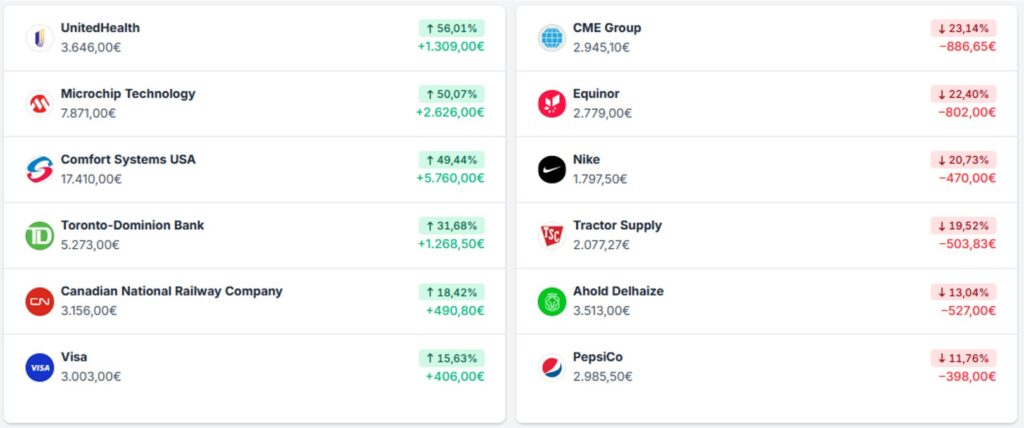
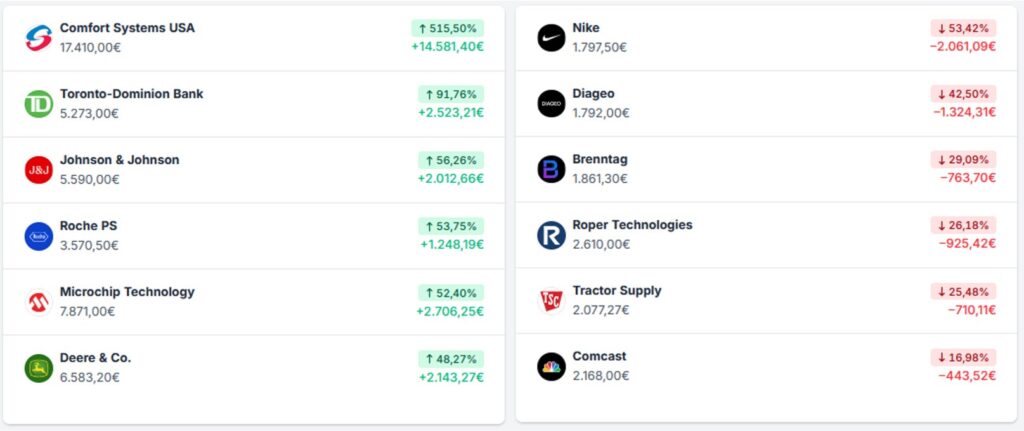
As in every quarterly report, you will find the „admirable“ below“ Top performer and "unfortunate" Stragglers in the second quarter of 2026 and since the inception of the DGI model portfolio, calculated in Euros as the base currency:
Diversification & Allocation
In my investment strategy, the Portfolio diversification a proven way to adequately manage unsystematic risks and, in addition to controlling position size, is an integral part of my Risk management represent. Let us now take a closer look at the status of diversification according to different characteristics such as sectors, countries or company sizes.
I pragmatically bypass the fundamental question of whether to use the current market value or the originally invested capital as the basis for calculation by showing both versions.
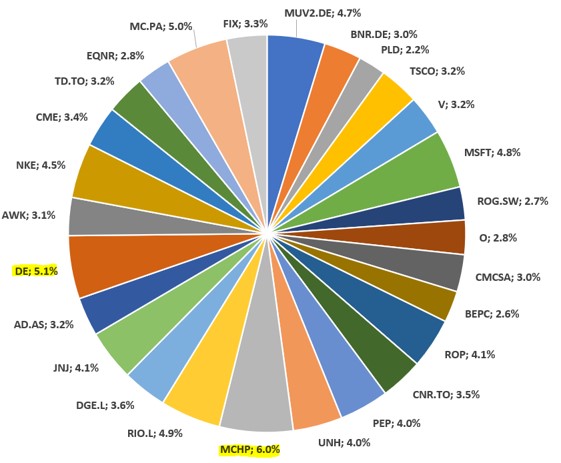
Let's first consider the composition of the portfolio based on the Individual values, So the situation is as follows: I will continue to keep an eye on the rule that no company should account for more than five percent of the invested capital. At the current time, Deere (marginally) and Microchip Technology continue to „violate“ this self-imposed guideline:
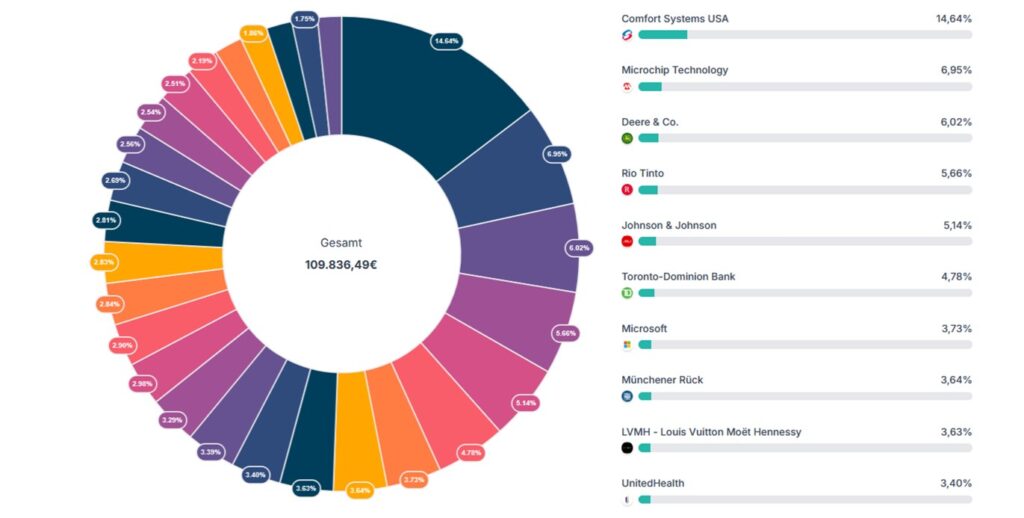
Now let's take a look at the composition of the portfolio based on the current Market value. The top 10 companies are shown on the right of the chart.
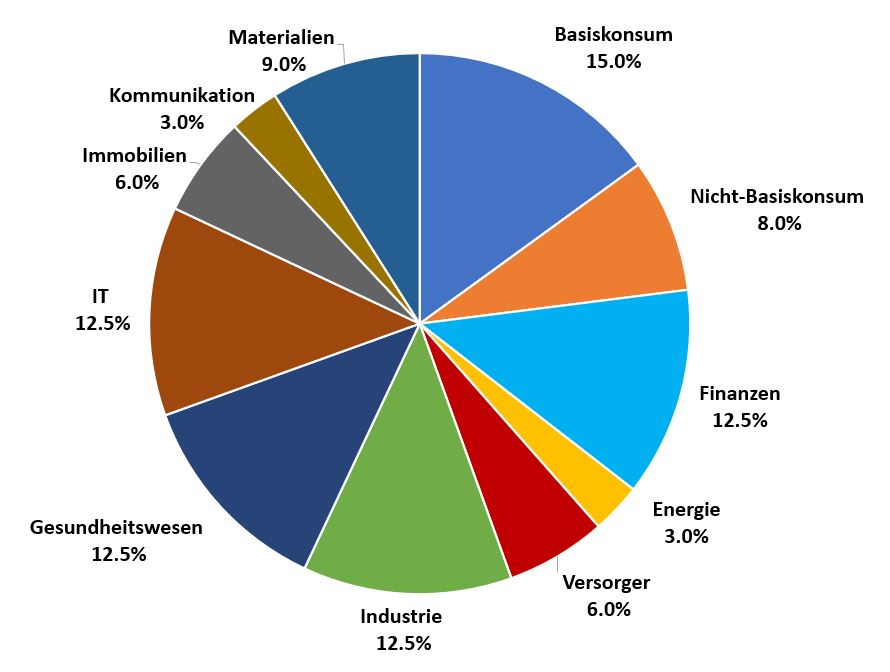
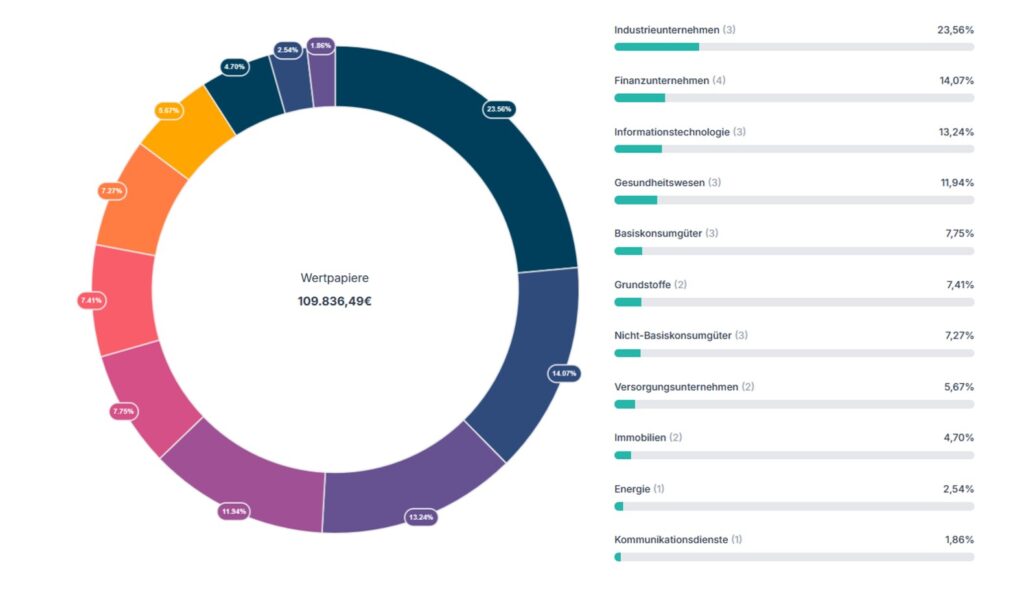
Based on the„Global Industry Classification Standard“I invest in the eleven sectors along the diverse value chains of the different industries that are important to our economy. Therefore, it makes sense to examine the current status in comparison to the target status. Stubbornly adhering to the Target allocation, which I will illustrate in the next graph, does not seem necessary to me for the time being, as I am not yet fully invested:
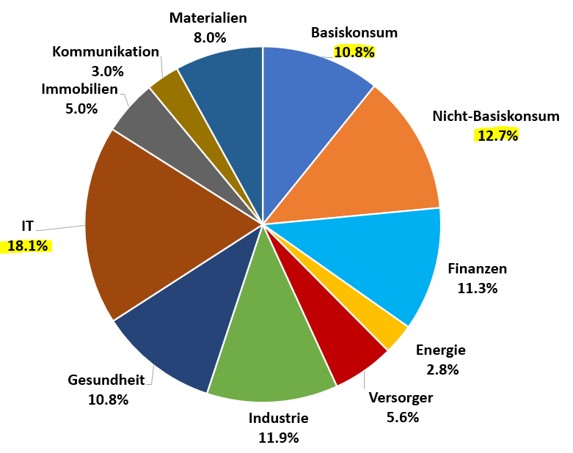
This results in the following Situation picture on sector distribution:
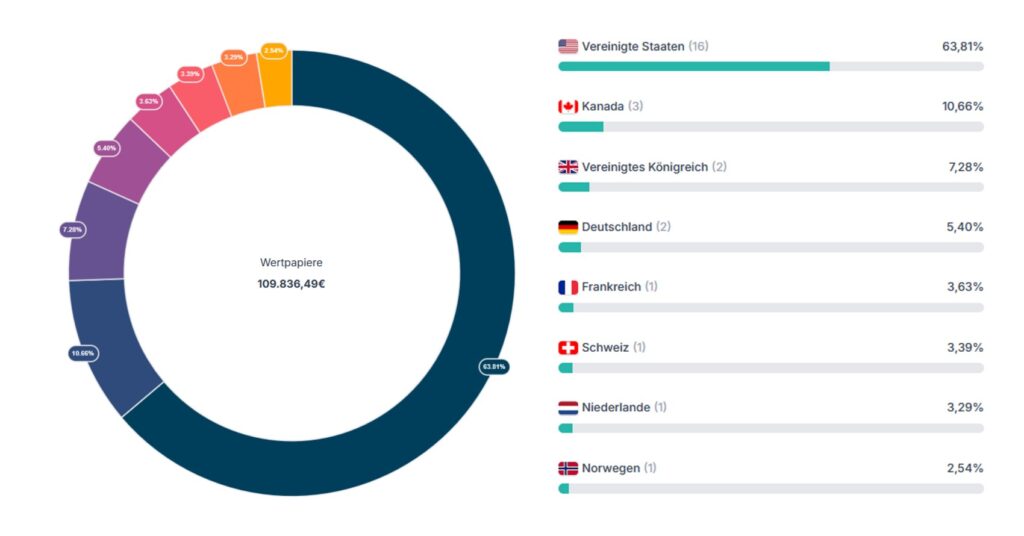
The Geographical spread I consider diversification across different countries and currency areas to be an essential part of risk management. There are no fixed limits on how much I want to invest in which country. My thoughts on this are quite simple: just because a company like Microsoft has its corporate headquarters in the United States, this by no means implies that the company automatically generates its operating revenue solely in its home country. Now, let's turn to Country allocation:
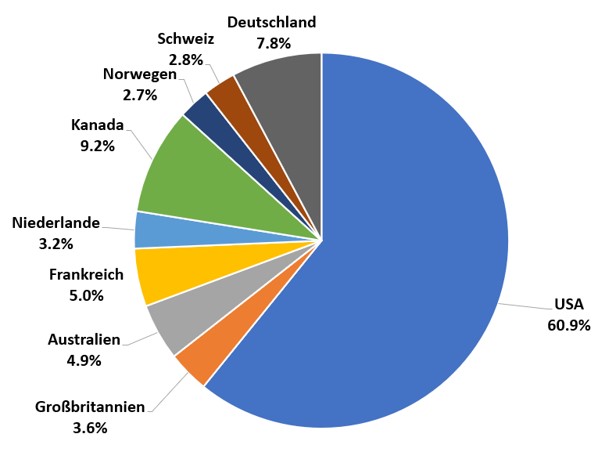
Since Rio Tinto is listed as a British company in Parqet, there's a difference in the representations between market cap and the chart above.
Outlook
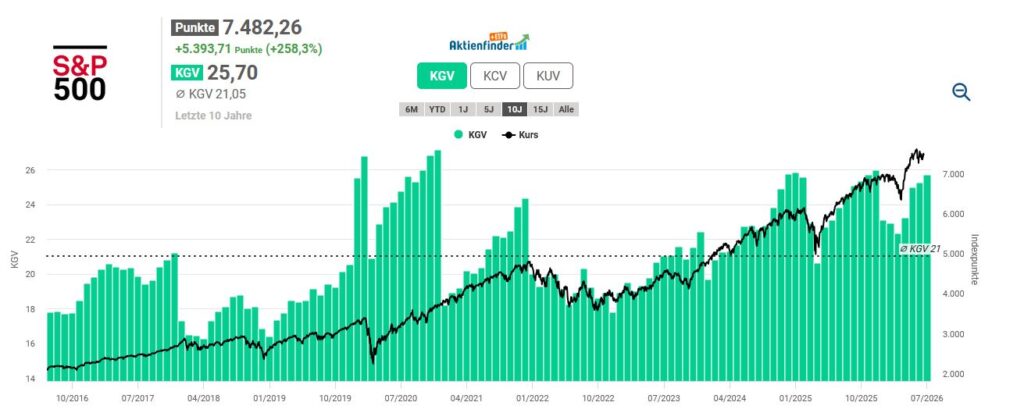
With every quarterly report, I look at the index level using the S&P 500 to get an initial sense of the current valuation based on the price-to-earnings (P/E) ratio. I am aware of the valid reasons why the P/E ratio at the index level should be interpreted with caution. Distortion by outliers, disproportionate influence by heavyweights („Big Tech“ or „AI Boom“), changes in index compositions in historical comparison, and so on. Nevertheless. Currently, the P/E ratio of 25.7 is almost five points above the ten-year average. This means despite this, the S&P 500 remains significantly overvalued overall during the selected period.
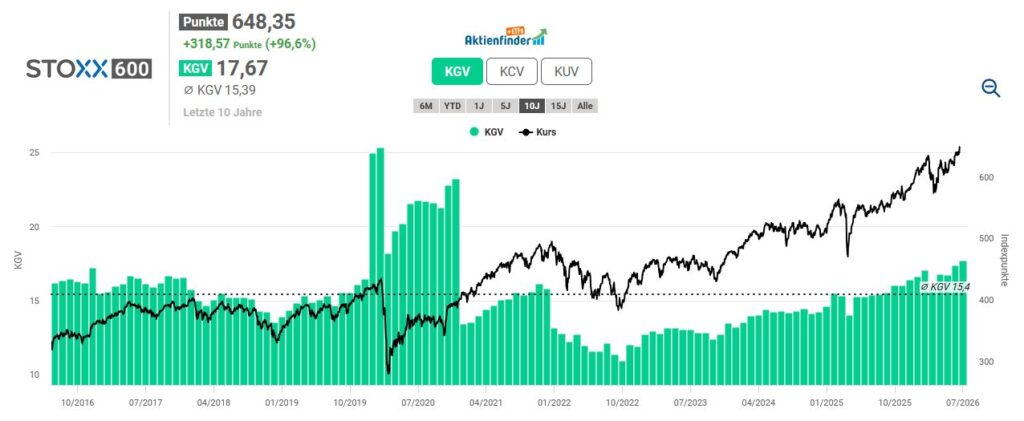
The STOXX Europe 600, which reflects the market situation in Europe, comprises the 600 largest listed companies in Europe and, unlike the EURO STOXX 50, is not limited to the Eurozone. Important countries such as Denmark, Great Britain, Norway, and Switzerland are included in this index. On average over the last ten years, the STOXX Europe 600 was valued at a P/E ratio of 15.4. It is currently at 17.7, indicating a Überbewertung hindeutet.
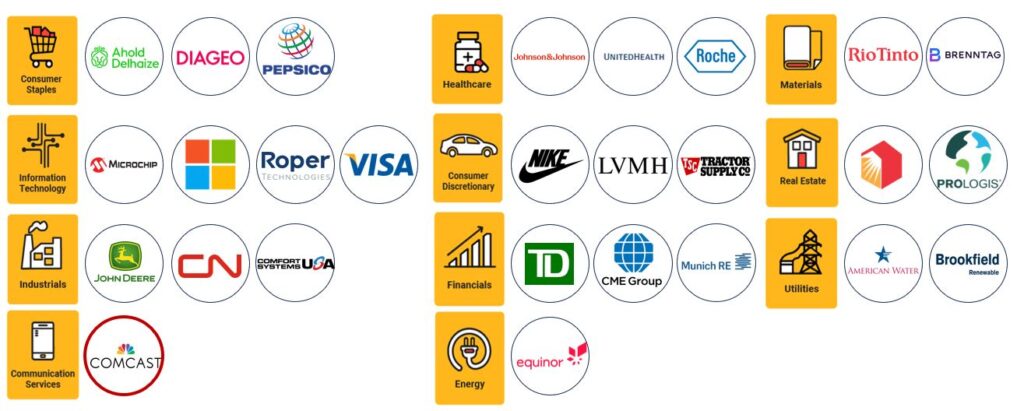
Unchanged, with 27 investments in the depot across relevant industries, I see myself sufficiently represented. Broken down into the eleven sectors, the following distribution of companies emerges:
The second quarter of 2026 was a quarter of contrasts. For much of the period, central banks, geopolitical tensions, and the usual quarter-end adjustments set the tone. In summary, they left behind a market landscape that can best be described as fractured. Beneath the surface of the indices, a noticeable shift occurred: away from the previous leaders of the rally and towards sectors that had previously been in the shadows.
The question that continues to occupy the market is: How quickly can the massive investments in AI infrastructure actually be translated into sustainable profits? There is a fine line between the hyperscalers, who are making these investments, and the infrastructure companies that benefit from them along the value chain, testing investors' patience. Because at some point, the question of the tipping point inevitably arises: When does euphoria turn into disillusionment? A look at the Fear & Greed Index illustrates how quickly sentiment can swing between greed and fear. Ultimately, the result is the aforementioned fragmented market environment, which favors sector rotation.
Since the rally in recent months has been largely led by AI and semiconductor stocks, and massive gains have been made in some of these, a correction in these stocks is initially not surprising and can even be seen as a healthy signal for the broader market.
It is also striking that it was not only the technology sector that was weak. Other non-defensive sectors, such as non-cyclical consumer goods, also came under pressure. This suggests that investors wanted to take less risk in high-growth and cyclical market segments in the short term. On the flip side, defensive sectors or those that had not performed as strongly until now were winners. Healthcare, utilities, real estate, and some industrial stocks performed significantly better. Capital is flowing out of previous winners into areas that are either more favorably valued, offer more stable cash flows, or are benefiting from a broader market rotation.
On an individual stock level, these rotational movements were clearly reflected. A prime example of the return of defensive quality is UnitedHealth. After an extremely difficult year in 2025, with sharply increased treatment costs, regulatory headwinds, lawsuits, and a massive stock price slump, the health insurance giant achieved a convincing turnaround in 2026. In mid-June, the stock was trading near its year-high, having recovered quite clearly from its low in the summer of 2025, even though the ongoing investigation by the U.S. Department of Justice remains a lingering concern. Microchip Technology, on the other hand, stands on the winning side as one of the beneficiaries of the AI infrastructure boom. After a painful correction in 2024 and 2025, the semiconductor specialist is increasingly turning towards the data center: new innovations and partnerships are placing the company at the heart of infrastructure expansion, and the data center solutions business is expected to roughly double in 2026. The latest figures were accordingly strong, and the stock was clearly in positive territory for the year. This semiconductor stock is by no means immune to the volatility typical of the industry.
On the downside, two values were representative of the weaker corners of the market. Equinor felt the turnaround in the commodity market immediately: The Norwegian oil and gas group had initially benefited from the high oil prices caused by the war. Unlike many competitors, Equinor has no direct exposure to the Middle East and was able to fully profit from the high prices. However, with the ceasefire and the significant drop in WTI and Brent prices from mid-June, this tailwind reversed, and energy stocks came under pressure. Tractor Supply, in turn, is emblematic of the weakness in non-essential consumer goods: The US retailer, which targets rural clientele, is suffering from a strained consumer climate in rural areas, tariffs, and higher logistics costs. Over the past twelve months, the stock has lost around 40 percent, clearly lagging behind the overall market and recently trading near its multi-year low. In mid-June, further lowered price targets caused additional selling pressure.
For months, and especially in recent weeks, central banks, geopolitical tensions, and quarter-end adjustments have been dominant forces in the market. Risk management is at the core of every market phase: the opportunity to participate, but not to bet everything on one stock or one industry. Building a liquidity reserve in times of sunshine and using it during periods of market turmoil remains a fundamental component of an anti-cyclical approach to investing in individual stocks.
On October 5th, I will be a guest again at Live Webinar at CapTrader. Starting at 8 PM I will give an update on the DGI-Musterdepot and report on how the 3rd quarter of 2026 went for the portfolio. Here you can register for the free webinar.

