Welcome to another blog post. Realty Income is probably one of the most well-known companies. Real Estate Investment Trusts (REITs) It is truly a company that exists and has, for good reason, been dubbed "The Monthly Dividend Company". I have already provided a more detailed overview of the company on CapTrader. The article from 2024 can be found here. here. Since then, although there has been no complete restart in terms of operations, the environment has changed significantly.
Perhaps the most important change concerns interest rates. Ten-year US Treasury bonds are now again yielding around 5.1 %%, while Realty Income offers just under 6 % dividend yields at a share price of approximately $55. At the same time, the US Federal Reserve raised the benchmark interest rate by another 25 basis points in September and further increases are likely. For a net lease REIT with long-term leases and more than $30 billion in debt, this is anything but insignificant.
In addition, there is a second issue. Realty Income has grown so much that classic real estate acquisitions are no longer enough to significantly increase AFFO per share. That is exactly why the company is building new growth paths. These include private capital, joint ventures, new funding sources, and now also a significantly larger step towards data centers.
In this article, therefore, I would like to discuss less about whether $Realty Income is fundamentally a good REIT; in my opinion, that is quite clear. What I find more interesting is the question of whether the current valuation adequately takes into account the interest rate pressure and where, in a company of this size, further growth should come in the future.
Business model and strategy
Realty Income (ticker symbol: O, ISIN: US7561091049) is one of the largest publicly traded REITs in the world. The business model is nevertheless relatively simple. The company purchases properties that are rented out to individual tenants on a long-term basis. Most contracts are triple-net leases, in which the tenant assumes not only the rent but also property taxes, insurance, and a large portion of ongoing maintenance costs.
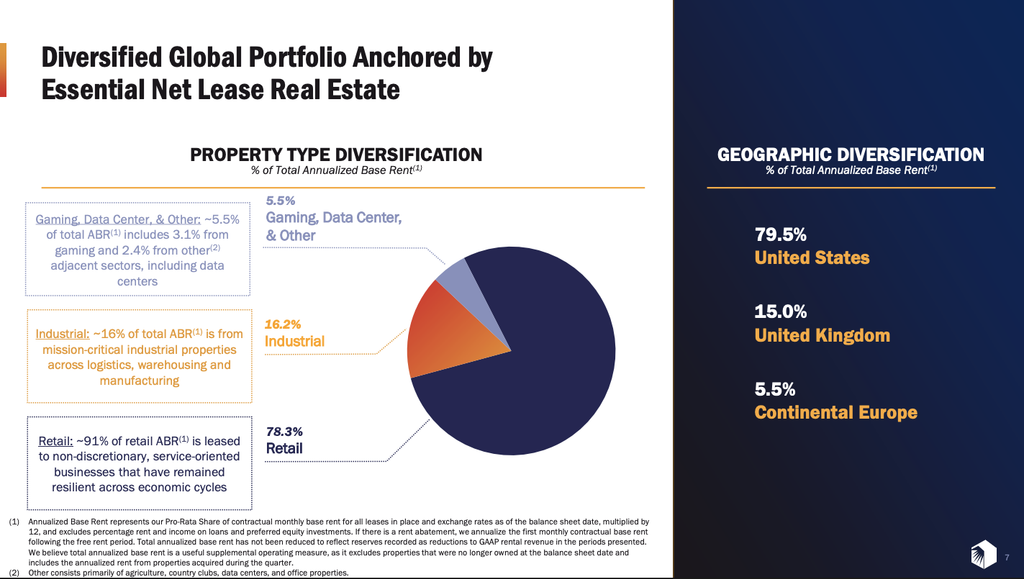
At the end of Q2 2026, the portfolio consisted of 15,588 properties. The occupancy rate was 98.8 %%, and the weighted average remaining lease term of the lease agreements was 8.6 years. Approximately 78% % of the annualized base rent continues to come from the retail sector, with another approximately 16 coming % from the industrial sector. Gaming, data centers, and other adjacent sectors make up the rest.
It is precisely these long lease agreements that make cash flow very predictable. At the same time, they are also the reason why Net Lease REITs react particularly sensitively to changes in long-term interest rates. In many contracts, rents only increase moderately, whereas capital costs can be more volatile.
Current business development
Operations at Realty Income continue to be going well. In the second quarter, AFFO per share rose from $1.05 to $1.09. For the full year, management now expects AFFO per share to be $4.44 to $4.45. This has lifted the guidance slightly compared to the Q1 level.
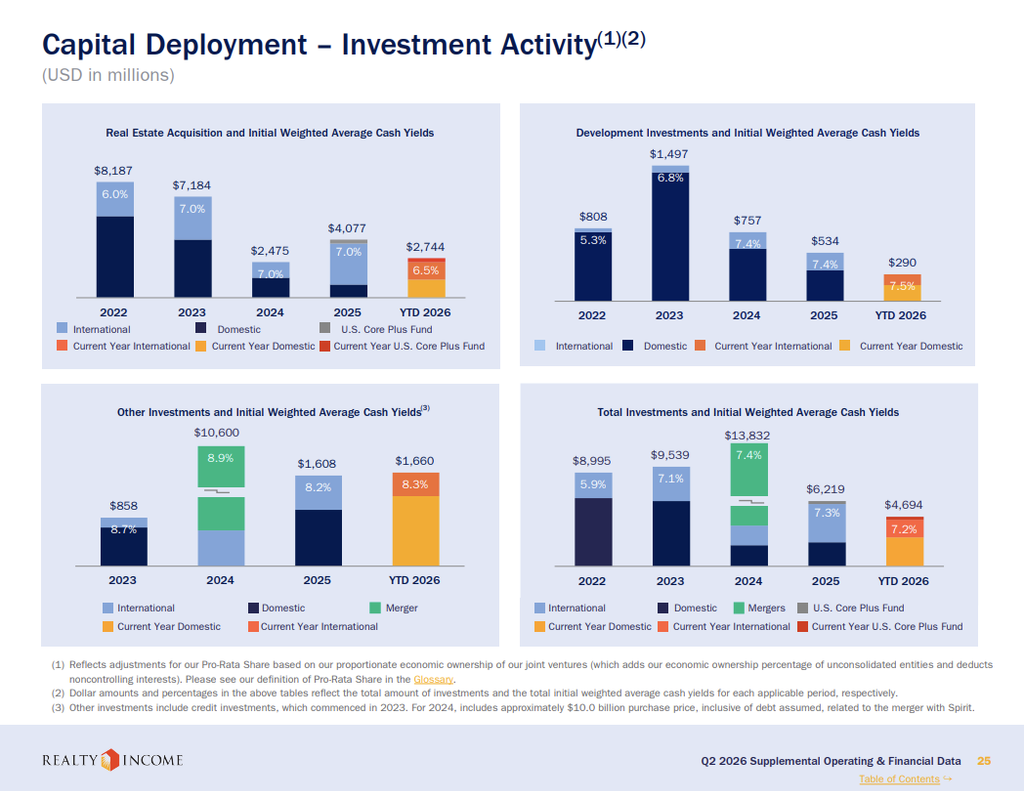
Realty Income remains very active in terms of investment volume as well. For 2026, 10 billion USD in investments are now expected. Around 2.6 billion USD were invested in Q2 alone. The initial weighted cash yield was 7.3 %. In the first half of the year, the investment volume was around 5.3 billion USD.
At first glance, this sounds like classic Realty Income. You take in capital, buy real estate, and slowly increase the AFFO per share. The problem now lies in the scale. With an Enterprise Value of around 89 billion USD, Realty Income has to invest a lot of capital to ensure that new investments become visible at the corporate level and have a positive impact on value.
In competition with government bonds
It is at this point that the current interest rate environment becomes interesting. Realty Income is trading at approximately $55 in mid-October. The monthly dividend, which was recently increased to $0.2715, corresponds to $3.258 annually, which is an increase of 10.3%. Dividend yield from just under 6.0 %.
By contrast, a ten-year US government bond currently yields approximately 5.1 %%. The pure yield differential of the Realty Income dividend compared to a ten-year Treasury bond is thus only about 0.9 percentage points (a few days ago it was as low as 0.7). This is not particularly much for a stock with price, corporate, and real estate risks.
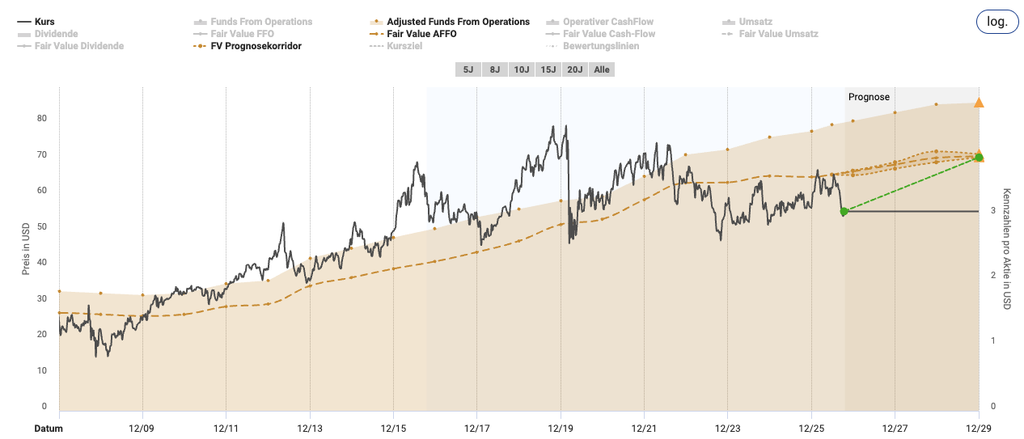
The comparison is, however, only so simple at first glance. A Treasury pays its coupon and ultimately returns the nominal amount. Realty Income, on the other hand, can increase its dividend and let AFFO grow per share. Therefore, I consider the comparison with the AFFO yield to be more meaningful. With an AFFO guidance of $4.44 to $4.45 and a price of approximately $55, the AFFO yield is slightly higher than 8 %. The P/AFFO ratio is accordingly around 12.4.
Real Estate Income therefore retains a portion of its cash flow within the company and does not pay out the full AFFO as a dividend. Nevertheless, the spreadsheet illustrates very well why the valuation of Net Lease REITs comes under pressure as Treasury yields rise. The higher the "risk-free" alternative returns, the higher either the current earnings, growth, or the valuation discount of a share must fall.
Balance sheet and indebtedness
In almost every one of my REIT articles, sooner or later I end up on the balance sheet. With Realty Income, this is actually one of the most important points in the entire investment case.
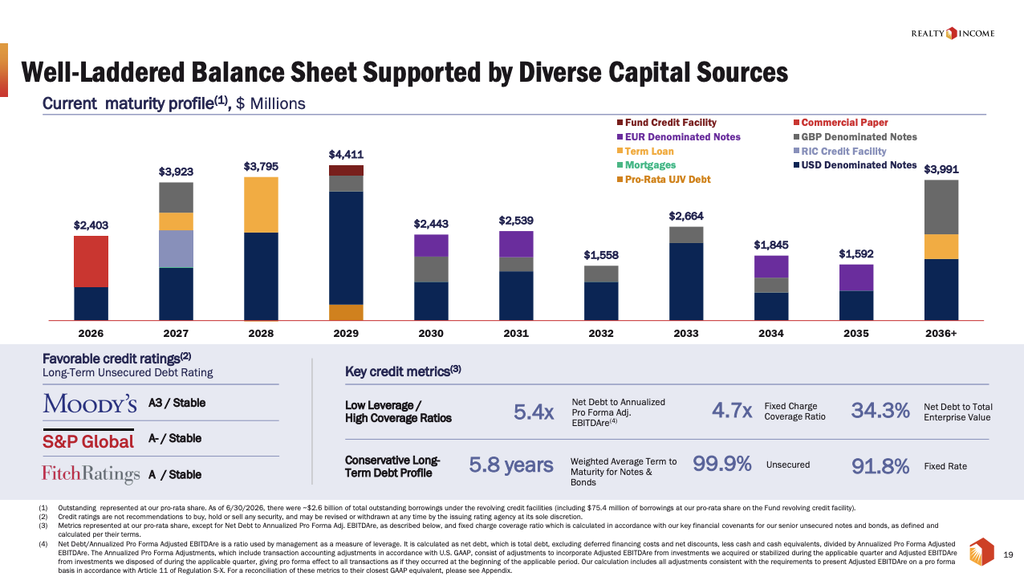
- Net Debt / Annualized Pro Forma Adjusted EBITDARe at 5.4x
- Fixed Charge Coverage Ratio at 4.7x
- 91.8% % of the debt is fixed-term
- weighted average interest rate on a pro-rata basis of around 3.84 %
- weighted residual maturity of the notes and bonds of 5.8 years
- Ratings from Moody's A3, S&P A and since August 2026 from Fitch A
The overall picture remains solid. In particular, the high ratio of fixed-income debt protects Realty Income in the short term from a sudden increase in financing costs. A 25 basis point increase in the Fed’s interest rate does not mean that the total debt of about 31 billion USD will suddenly increase by 25 basis points.
Debt and maturities
Things get even more exciting with the so-called Maturity Ladder. At the end of the second quarter, the pro-rata debt stood at around 31.2 billion USD. Based on the then maturity profile, around 2.4 billion USD were due in 2026, around 3.9 billion USD in 2027, around 3.8 billion USD in 2028, around 4.4 billion USD in 2029, and around 2.45 billion USD in 2030 for refinancing or repayment.
| Due date | Volume | Blended Rating |
| 2026 | 2.40 billion USD | 3,77 % |
| 2027 | 3.92 billion USD | 2,93 % |
| 2028 | 3.79 billion USD | 3,58 % |
| 2029 | 4.41 billion USD | 3,83 % |
| 2030 | 2.45 billion USD | 3.73 % |
| after that | 14.19 billion USD | 4,19 % |
However, what is even more interesting than a single maturity year is the entire refinancing wave between 2027 and 2029. In these three years, based on the Q2 figures, a total of around 12.1 billion USD will be due. The weighted average interest rate for these three blocks currently stands at only about 3.46 %.
This makes it possible to very well quantify the magnitude of the refinancing risk. If Realty Income were to gradually % refinance these 12.1 billion USD at an average of 5.0%, the annual interest expense after full refinancing would be approximately 187 million USD higher than today, purely on a calculation basis. At an average of 5.5, that % would be approximately 247 million USD in additional annual interest costs.
This forecast is also explicitly not a forecast. It assumes, among other things, that the entire volume will be replaced with new external capital and ignores property sales, new equity, joint ventures, currency effects and further growth. The currency range is also out of scope, because Realty Income does not only refinance in USD but now also in EUR. However, the forecast shows why a difference of one or two percentage points for a company of this size can quickly become relevant.
If the approximately $187 million from the % 5 example is taken into account solely in relation to the approximately 937 million shares that have recently been issued, this amounts roughly to $0.20 per share. At 5.5 %, this would be approximately $0.26. Such an effect would of course not occur all at once, but would be spread over several years and could be partially compensated by higher rents, new investments and additional revenue.
At the same time, one should not read the Q2 figures statically. Realty Income has already taken further measures since the end of the quarter. In July, the credit lines were expanded to a total of 5.5 billion USD and the commercial paper programs were also raised to 5.5 billion USD. In August, a new package of convertible bonds was also added. The actual refinancing structure may therefore look different than the mere Q2 maturity ladder suggests.
Impact of the Fed rate hike on interest rates
The Fed % raised the target range for the Federal Funds Rate in September by 25 basis points to 3.75 to 4.00, as mentioned above. For Realty Income, this has an immediate impact primarily on variable financing, commercial paper, and new debt. The significantly larger effect will come over time as low-interest senior loans expire and have to be replaced with higher market rates.
The Federal Funds Rate itself is not the interest rate at which Realty Income would purchase a ten-year bond. What is crucial, however, is the corresponding Treasury yield plus Realty Income’s credit spread. That is why the recently significantly increased yields at the long end are at least as relevant for the REIT as the actual Fed decision.
Real Estate Income has an important advantage here. Due to strong ratings, the company can finance itself more cheaply than many smaller competitors. In the spring, for example, $800 million in senior notes with a coupon of 4.75 % and a maturity of 2033 were placed. The effective yield to maturity was around 5.05 %. Through a cross-currency swap for part of the issue, the effective blended coupon subsequently % fell to around 4.16. A term loan of $694 million through 2036, also concluded in 2026, comes with an effective blended borrowing rate of around 4.34 after the swap %.
This example also shows why a simple calculation using the formula "Treasury yield plus credit spread" can only be a rough approximation. Realty Income can combine different maturities, currencies, bond types, and derivatives, thereby choosing the financing channel that is most favorable for the company.
The new financing costs are nevertheless clearly above many of the old debts. Part of this negative impact can be offset by the size and access to the capital market; however, it will not disappear. And that is exactly why the question is becoming increasingly important: can Realty Income finance growth with less traditional external and public equity?.
Where is this growth supposed to come from?
That brings us to the second major issue. Realty Income is now huge. On the one hand, this is an advantage because the company can handle large transactions and raise capital worldwide. On the other hand, growth becomes increasingly difficult with increasing size.
An investment of over 500 million USD can have a significant impact on the AFFO for a smaller REIT. At Realty Income, this is now almost commonplace. The company therefore has to invest ever larger volumes while ensuring that the returns on these investments are above its own capital costs.
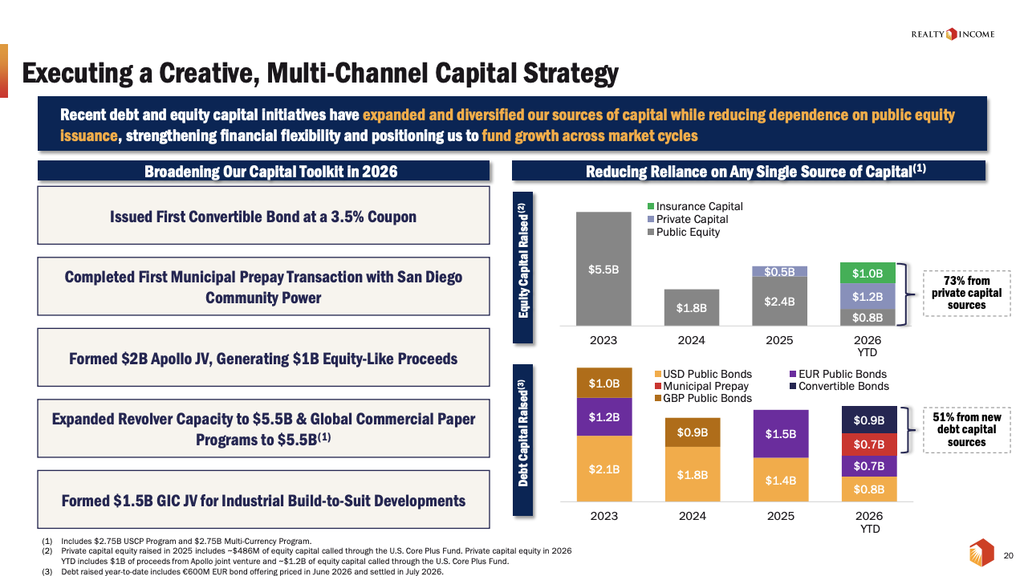
This is where the classic model eventually reaches its limits. Spending money on new shares is expensive at a low P/AFFO multiple. Debt financing has also become significantly more expensive. If both are simultaneously less attractive, Realty Income essentially needs a third source of capital. This is where Private Capital and Joint Ventures come into play.
With this, Realty Income is trying to expand its capital base and no longer finance every property % with 100% equity. For me, this is not just an additional growth project but a direct response to the changing interest rate and valuation environment.
Private Funds and RIM
In my view, the most important strategic difference from the past is Realty Income Investment Management, or RIM for short. At its core, the idea behind it is to use one's own real estate platform to attract foreign institutional capital.
The principle is relatively simple. An institutional partner provides a large portion of the equity, Realty Income also invests and often handles sourcing, underwriting, and asset management. This allows the company to manage more properties and earn on transactions without having to put every dollar on the balance sheet itself. Additionally, management fees are significantly less capital-intensive than traditional direct ownership of real estate.
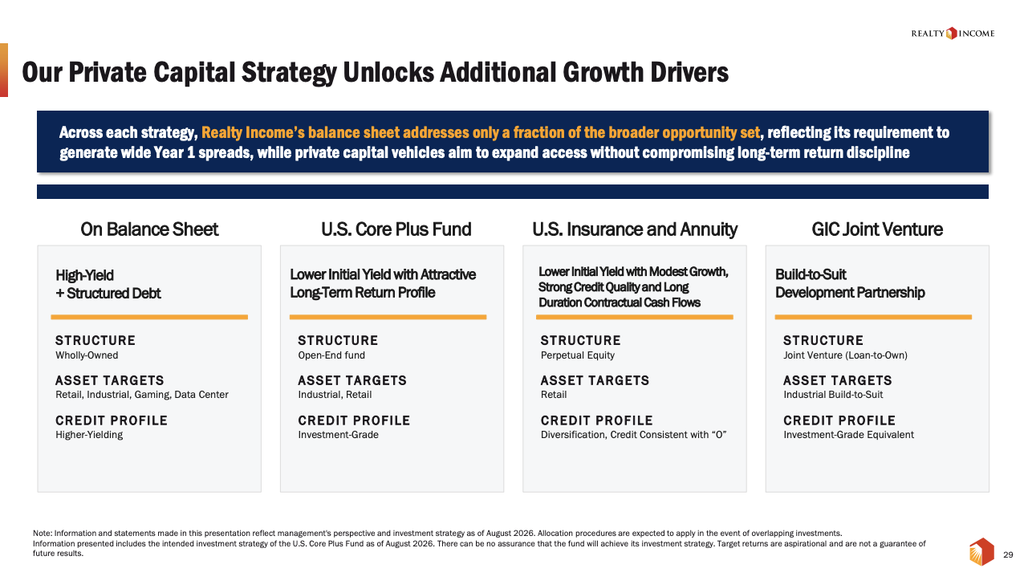
Realty Income itself cites four advantages for this. AFFO per share can grow faster through more balanced revenue, the addressable market becomes larger, dependence on public equity decreases, and different investors can be reached through separate vehicles.
Several structures are distinguished in the Q2 material. These include the U.S. Core Plus Fund, insurance and annuity capital through Apollo, and build-to-suit joint ventures with GIC. For example, the Core Plus Fund can also invest in real estate, the initial yield of which for Realty Income would be too low on its own balance sheet but would grow more strongly in the long term.
An interesting model from the company. In a purely illustrative example, the so-called effective cap rate for a property with a 7.5 % cap rate increases to 10.1 as a result of the fund structure %. The return on equity in this example rises from 8.8 % to 12.8 %. These are not explicitly promised returns; however, the calculation shows why Realty Income is investing so heavily in this platform.
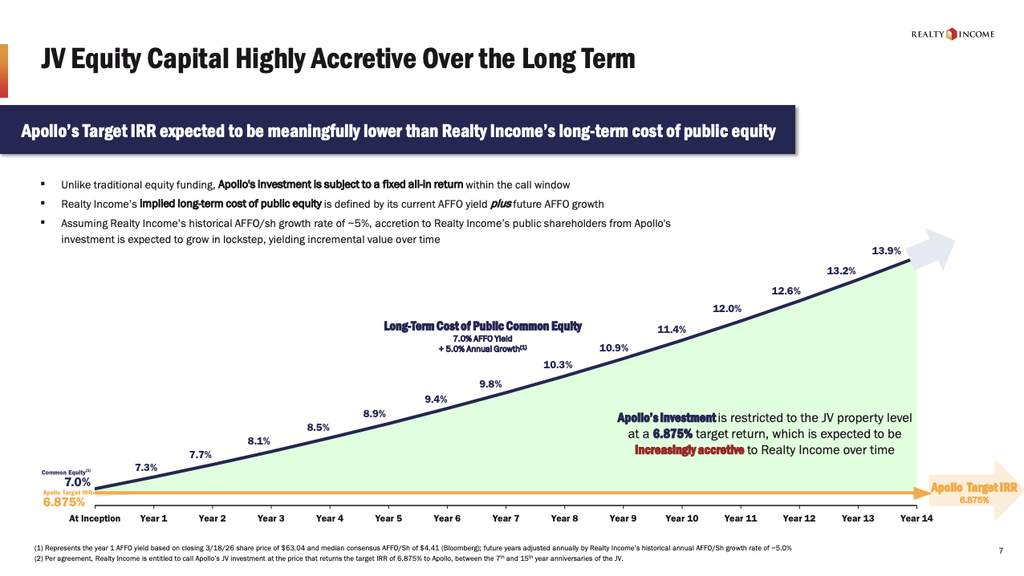
With Apollo (TWS ticker: APO, ISIN: US03769M1062), the strategy has now become very concrete. APO has provided $1 billion for a 49 percent stake in a joint venture with around 500 existing U.S. retail properties. Realty Income retains operational control and earns management fees on the entire portfolio. The capital is also treated as permanent equity by the rating agencies.
This is particularly interesting from a financing perspective. In the separate Apollo presentation, Realty Income explicitly compares this form of institutional equity to the long-term costs of issuing new common shares. The logic behind it is simple. Instead of always spending more equity at a low valuation, Realty Income can raise long-term partner capital without having to increase its debt accordingly. At the same time, the company remains economically involved with its 51 percent stake and earns additional management fees. This makes the structure significantly more capital-efficient for suitable assets than a classic 100 percent acquisition on its own balance sheet.
With GIC, there is a $1.5 billion build-to-suit platform for industrial real estate. In September, a further major partner joined: KKR (TWS ticker: KKR, ISIN: US48251W1045). KKR invests in a European net-lease portfolio, while Realty Income retains the majority stake and management. This transforms a traditional net lease REIT into an increasingly diversified real estate and capital management platform.
More growth through data centers?
Data centers are now more than just a small side project. Realty Income has already invested in a build-to-suit project with Digital Realty in 2023. However, the step announced in the summer of 2026 is significantly larger.
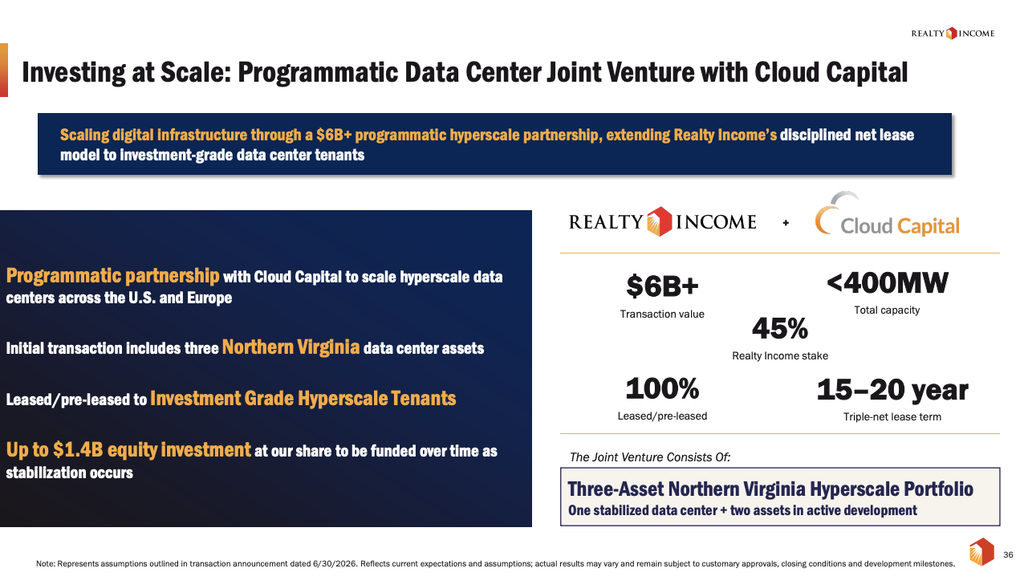
Together with Cloud Capital and a global institutional investor, a joint venture for hyperscale data centers was established. The three initial assets in Northern Virginia have a total value of more than 6 billion USD. Realty Income is expected to % hold approximately 45% and invest up to 1.4 billion USD in equity over time.
The three data centers together have a capacity of just under 400 MW and are fully leased or preleased. The tenants are investment-grade hyperscalers and the lease agreements are expected to run between 15 and 20 years.
What I find important in this context is that Realty Income does not want to become a data center developer itself. The technical and operational expertise comes from the specialized partner. Realty Income, on the other hand, brings its capital base, its underwriting, and its experience with long-term triple-net leases. The basic principle remains therefore similar to that of a classic retail property, only that the tenant is a hyperscaler this time and the asset is significantly more capital-intensive.
This is interesting for growth because the global data center market is significantly larger than many traditional net-lease niches and requires enormous investment amounts at the same time. This opens up an additional opportunity for Realty Income to deploy large volumes without having to continuously expand its existing retail portfolio.
Dividend and Payout Ratio
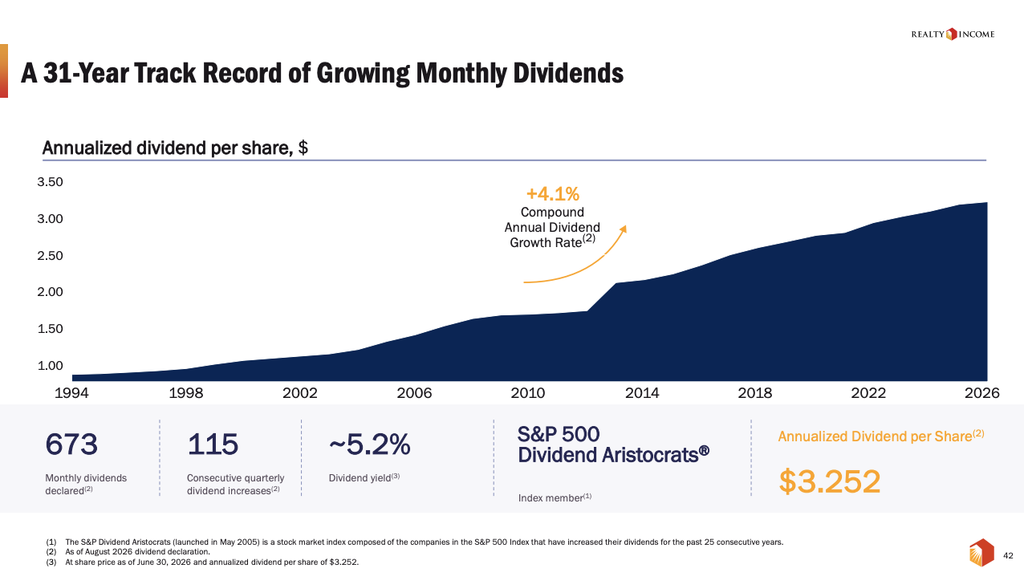
Of course, Realty Income’s dividend cannot be overlooked, as it is an essential component of the total returns. In September, the monthly dividend was increased for the 136th time since the IPO. Since October, 0.2715 USD per share per month have been paid. Annualized, this amounts to 3.258 USD.
With the average AFFO guidance of $4,445, the payout ratio is therefore around 73 %. The dividend is therefore still amply covered. At the same time, the relatively small increase also shows that investors should not expect double-digit dividend growth from Realty Income in the near future.
The investment case consists, rather, of a high ongoing dividend plus moderate growth. That is precisely why the competition from bonds is so relevant at the moment. If the Treasury is already % offering more than 5%, Realty Income must show that from just under 6 % dividend yields over the years, a significantly higher total return can actually be achieved.
Evaluation and outlook
At a price of around $55 and an AFFO guidance of $4.44 to $4.45, Realty Income is currently valued at approximately 12.4 times the AFFO. The AFFO yield is around 8.1 %, and the dividend yield is just under 6 %.
From a historical perspective, this is definitely not a high valuation. At the same time, I wouldn’t simply start using the old average multiple today and automatically derive a large potential for price growth from it. The interest rate level has changed structurally. As long as ten-year US government bonds yield 5% % or even more, a lower multiple for a slowly growing net lease REIT is entirely understandable.
Therefore, what is crucial is not so much whether Realty Income is once again trading at 18 or 20 times AFFO. What matters to me is whether the company can sustainably increase the AFFO per share again in the mid-single digits. If that succeeds and the dividend remains at around 6 %, even without a major multiple expansion, a decent total return would be possible.
This is where the importance of the new growth paths lies. Private capital, joint ventures, and data centers must prove that they not only generate big headlines but actually enable additional growth per share. If that succeeds, Realty Income would be less dependent on constantly issuing new shares at attractive prices.
Options trading
I myself am also active as an options trader, but almost exclusively as a so-called "stager". Therefore, I am naturally also interested in REITs like Realty Income, which are suitable for additional cash flow or for a low entry point through an investment.
Attention: The earnings season is about to begin! Realty Income will report its Q3 results on November 2, 2026.
Due to the low level of inflation despite the current increase Volatility (VIX) the premiums are unfortunately not as attractive as in volatile times.
Realty Income
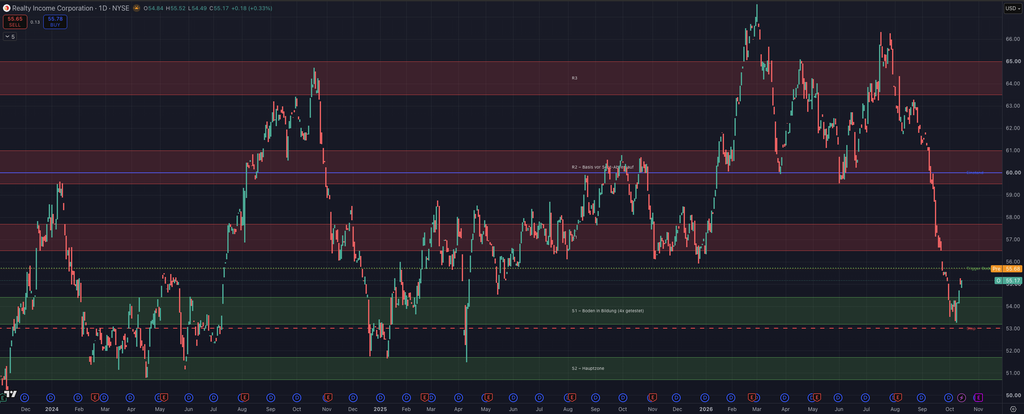
For Realty Income, the following opportunities are available: Short Puts for example, with a shorter duration ATM Strike from $55 in December '26 or longer continuously with Strikes $52.50 in September '27 or January '28
Conclusion
Realty Income remains for me one of the more qualitative names in the Net Lease sector. The occupancy rate is high, the tenant base is broadly diversified, the balance sheet is investment grade, and the dividend continues to be well covered.
Nevertheless, the investment case today is different from the zero-interest-rate phase. A dividend yield of just under 6 % appears less spectacular when ten-year US government bonds simultaneously % yield more than 5. In addition, there are more than 30 billion USD in debt, of which several billion per year will have to be refinanced in the coming years. The old average interest rates of only around 3 % will not be able to continue rising indefinitely.
In the short term, Realty Income protects its high ratio of fixed-income debt. In the long term, however, the company must demonstrate that it can offset higher financing costs through investment spreads, rental growth, and new revenue sources.
That is exactly why I find the development towards private capital, joint ventures and data centers so exciting. Realty Income is trying to transform itself from a pure real estate company into an increasingly broader net-lease capital platform. This can reduce dependence on public equity and open up new markets.
Whether that is enough in the end to generate stronger AFFO growth despite the enormous size of the company will be the crucial question of the coming years for me. With a P/AFFO of around 12 and a dividend yield of just under 6 %, part of the interest rate problem is already priced in in my view. A self-fulfilling prophecy, Realty Income is no longer in the current interest rate environment.