Volatility is one of the most important key figures in trading options and share indices. It describes the intensity of price fluctuations and thus provides valuable information on current market sentiment and investor expectations. The comparison between the implied volatility (IV) - i.e. the market expectation contained in the option prices - and historical volatility (HV), which is based on actual price movements in the past.
In this article, we show how volatility can be systematically analyzed using the Trader Workstation (TWS) and how traders can use this information to make informed trading decisions.
Important volatility indices at a glance
In order to better assess volatility, the major share indices have their own Volatility indices. They provide a quick overview of how much fluctuation risk the market is currently pricing in:
- VIX - S&P 500
- VXN - Nasdaq 100
- RVX - Russell 2000
- VXD - Dow Jones Industrial Average
- VDAX New - DAX
- VSTOXX - Euro Stoxx 50
- VXEWZ - Brazil
- VXEEM - Emerging Markets
These indices perform similarly in many market phases. For example, if the VIX (based on the S&P 500) rises sharply, the VXN (Nasdaq 100) often follows suit.
An example from practice
Particularly in special market phases, it is worth comparing the indices in detail. During the tariff conflicts in April 2025, for example, the VIX rose very sharply. By contrast, the VXN, which measures the volatility of the Nasdaq 100, rose significantly less.

This had noticeable consequences for options traders: Selling short put options in the S&P 500 options area was much more advantageous in this situation (volatility high), as higher premiums could be achieved here.
Volatility indices on individual shares
Not only large share indices, but also individual companies have their own volatility indices. These can be viewed with the TWS chart function or other common analysis tools and offer a further level for detailed volatility analyses:
- VXAZN - Amazon
- VXAPL - Apple
- VXGS - Goldman Sachs
- VXGOG - Google
- VXIBM - IBM
These indices open up additional opportunities to make more informed trading decisions, especially for traders who focus on individual stocks.
TWS enables volatility analysis for all equities
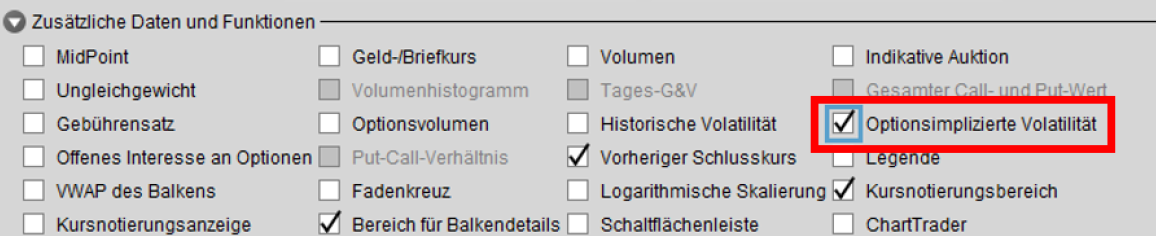
In the CapTrader TWS, volatilities can be analyzed directly for all stocks, regardless of whether a separate volatility index is available. For the analysis, the following settings must be made in a chart in the TWS:
Check the box under "Edit -> Chart parameters -> Option-implied volatility":
The respective implied volatility for the respective share is then displayed below the price chart:
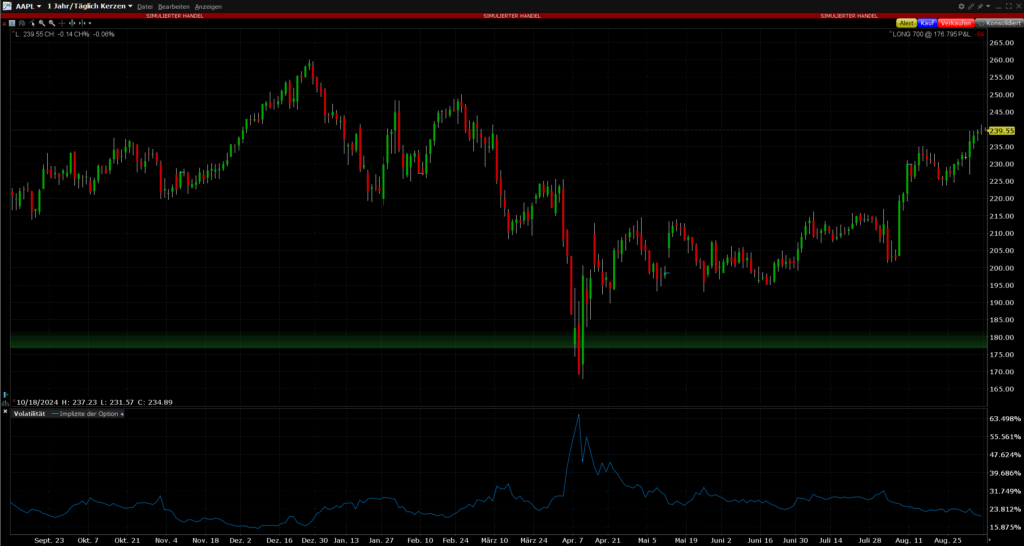
The display of implied volatility also works for shares outside the USA, for example for Nestlé (NESN) or Mercedes-Benz (MBG). Logically, the shares must be tradable with options, otherwise there is no implied volatility, as this is calculated from options.
When is volatility low or high?
One of the basic rules in options trading is to sell options preferably in phases of high implied volatility (IV). The reason for this is the well-known reversion-to-mean effect: after extreme swings, implied volatility tends to return to its long-term average.
Traders benefit twice over in such an environment. Firstly, option premiums are significantly more attractive in times of high IV. Secondly, the probability increases that volatility will fall again - a fall that puts additional pressure on option prices and thus paves the way for faster profits.
YouTube tip: VIX Workshop - How to trade volatility?
However, it is important not to view the absolute value of implied volatility in isolation. It is hardly comparable from share to share. For example, a share price of USD 100 does not allow a general statement to be made as to whether a share is "cheap" or "expensive". For Coca-Cola (currently around USD 70), this would be a high value, while for Netflix (currently over USD 1,200) it would be very low.
A relative valuation system is therefore necessary. An objective and widely used indicator for this is the Implied Volatility Rank (IV Rank), which sets the current volatility in relation to the company's own history and thus creates a sound basis for comparison.
The Implied Volatility Rank (IVR) shows at a glance how the current implied volatility (IV) can be classified in a historical context - i.e. whether options are more expensive or more favorably valued compared to the past.
The calculation is made by setting the current IV in relation to its high and low points in the last twelve months:
IVR = (current IV - 1-year low) / (1-year high - 1-year low) × 100
An IVR of 80 % means that the current implied volatility is close to the upper end of last year's range. Options are historically expensive in this environment - an attractive scenario for option writers who can profit from high premiums. An IVR of 10 %, on the other hand, signals very low volatility, so that the risk/reward ratio for option sales is usually less attractive.
The calculation can either be carried out manually or automated directly in the Trader Workstation (TWS). The IVR can be added there as a separate column. For example, you can create a watchlist with different stocks, which can then be filtered or sorted according to the IVR. To do this, add the following column to the TWS:
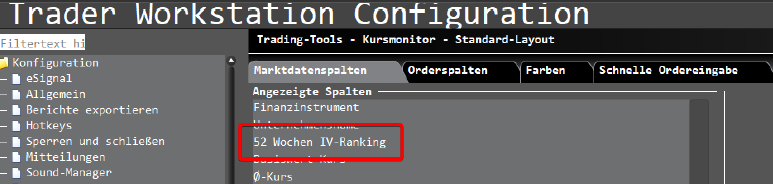
It is important to note here: A high IV rank indicates that the implied volatility is currently close to the upper end compared to the last 52 weeks. However, this does not mean that volatility cannot rise further. The IV rank merely shows the relative position in a historical context - it is no substitute for a forecast of future developments.
Conclusion - Volatility analysis with TWS
The Trader Workstation (TWS) not only enables a precise analysis of volatility at individual stock level, but also offers an objective instrument, the Implied Volatility Rank (IVR), to reliably classify the current level of implied volatility. A practical approach is to create a personal watchlist of preferred stocks and filter these regularly - once a week, for example - according to the IVR. In this way, promising starting points for further analysis and targeted option strategies can be identified.