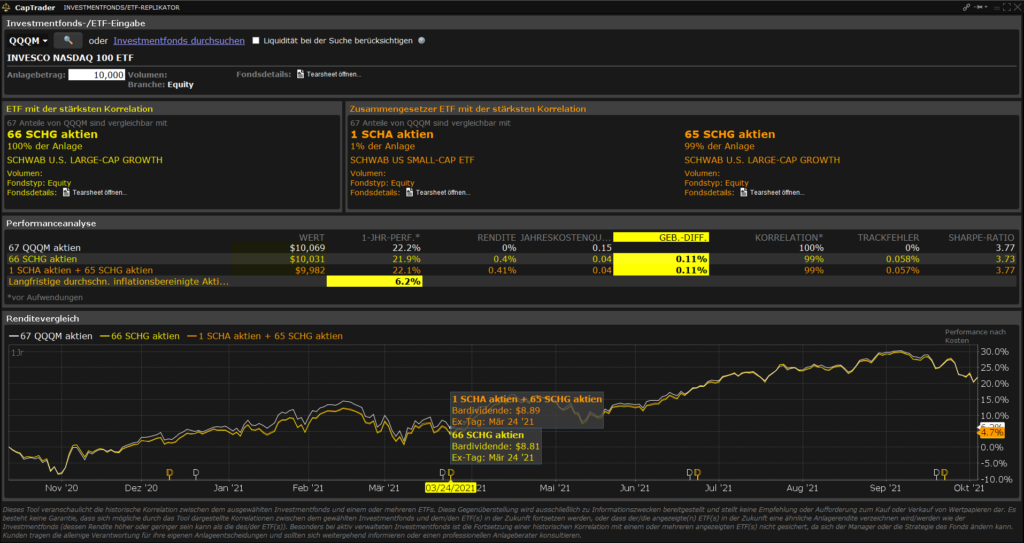
Use the mutual fund / ETF replicator to find individual or compound ETFs that have similar performance attributes to a mutual fund or ETF, but with lower fees and overall lower costs.
You have the possibility with the tool to scan the market for mutual funds or ETFs whose performance almost matches the performance of the value you entered.
Also, the replicator recommends you a number of shares with which you can achieve the performance. View the comprehensive performance analysis and see the fee difference and correlation percentage between the original and replicated contracts.
To open the mutual fund/ETF replicator
- In Trader Workstation TWS Mosaic: Use the "New Window" item at the top left and select > More Advanced Tools > Mutual Funds / ETF Replicator.
- In the classic view of the Trader Workstation TWS: Click on "Analysis Tools" in the upper left corner and select Mutual Funds/ ETF Replicator.
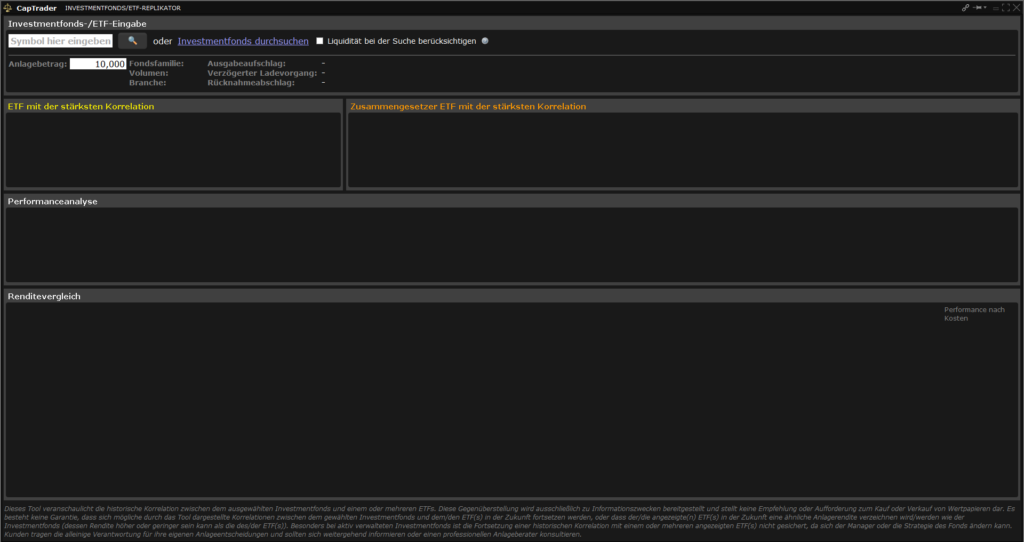
Enter an ETF or mutual fund in the search box or click "Search mutual funds".
You also have the option to consider liquidity in your search. Liquidity indicates how easy it is to buy or sell a security without negative price effects and is relevant for trading in periods of increased volatility.
Also enter the amount you wish to invest. This will be used to calculate the number of shares of the displayed contract that would be required to create a comparable investment.
Interpret results
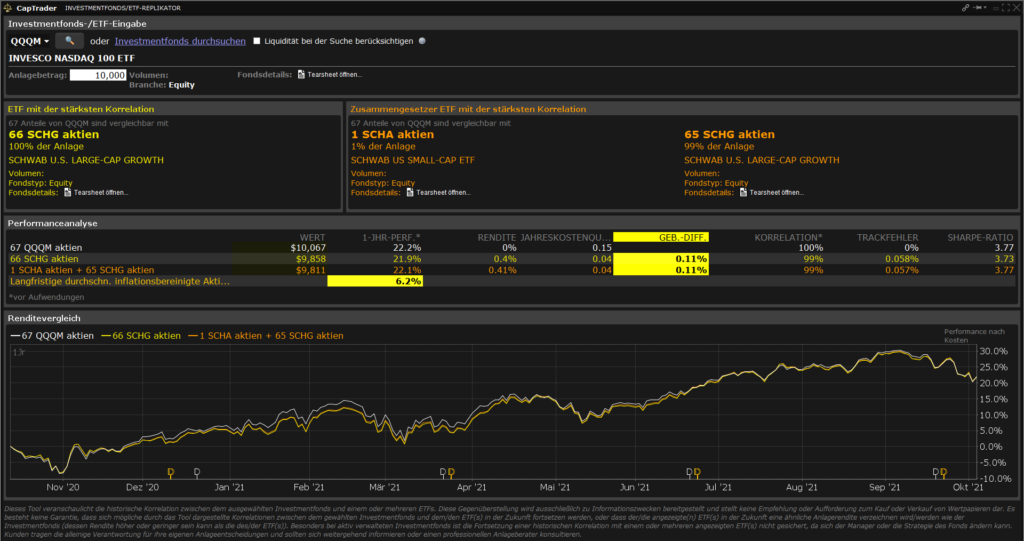
You will get displayed in the screen the ETF with the strongest correlation and the composite ETF with the following data:
- ETF symbol
- The number of shares based on the amount you choose to invest.
- In the case of the Composite ETF, the investment percentage indicates what proportion of the investment amount is allocated to the individual ETF.
- Full fund name
- Fund size
- Fund type
Check performance profile
The performance analysis table provides information on the historical comparison of the investment funds and the ETF. The focus here is on the percentage that can be saved in management fees.
- The VALUE shows you the total value of the investment when the specified number of pieces is created.
- 1-JHR-PREF gives the 1-year performance of the mutual fund and the recommended amount of the ETF.
- YIELD/ RETURN indicates the 1-year dividend yield of the mutual fund and the recommended amount of ETFs.
- ANNUAL COST QUOTE indicates the expected annual cost of the mutual fund and ETF.
- -DIFF. Gives the expected difference of the management fees of the mutual fund and the ETF.
- CORRELATION indicates how closely the daily return of the comparable ETF correlates with the return of the selected mutual fund.
- TRACKFEHLER gives you the tracking error calculated by comparing the daily return of the mutual fund and the ETF over the period of one year.
- SHARPE-RATIO is the ratio used to measure the excess return (risk premium) per unit of variance.
Yield comparison
It will show you the mutual fund in graphical comparison to the ETF along with the returns net of all costs over a one year period.
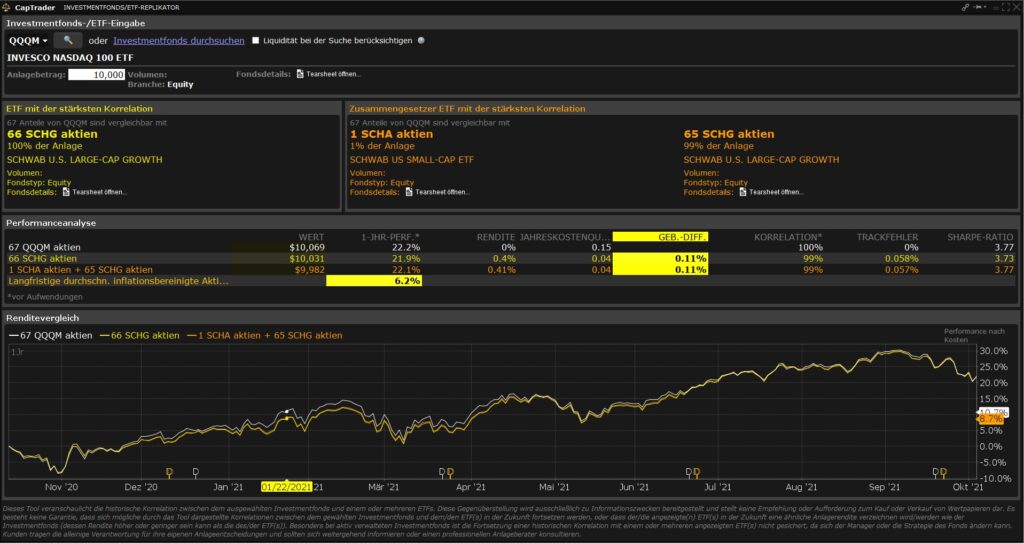
If you hold the mouse over an investment fund in the chart, you can see the daily interest percentage broken down.
Hold the mouse over the "D" symbol on the graph to view cash dividends as well as the ex-tag.