Your Broker for worldwide trading

Dow Jones

The Dow Jones Industrial Average (DJIA) or Dow Jones Index is one of the oldest stock indices in the USA, created in 1884 by Charles Dow and Edward Jones, the founders of the Wall Street Journal and Dow Jones. Charles Dow created the index to track the performance of the US stock market. The Dow Jones Index on the New York Stock Exchange (NYSE) consists of 30 of the largest US companies and, alongside the Dow Jones Transportation Average, is the oldest stock index still in existence in the USA.
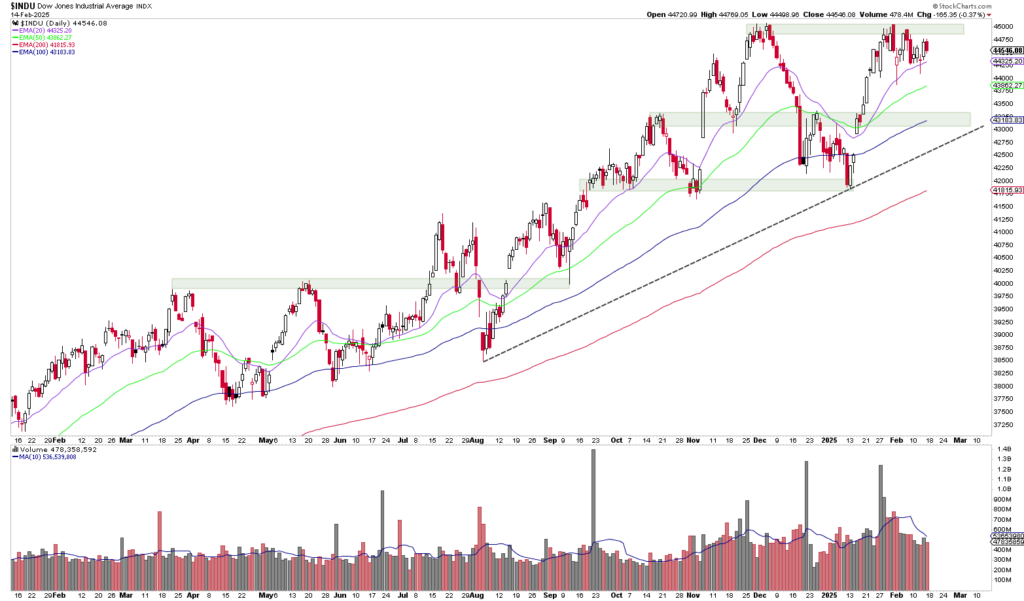
A stock chart shows an upward trend with candlestick patterns and Bollinger bands. Red arrows mark important points. Below is a bar chart of the trading volume.

Dear trader, dear stock market friends. After a very strong year overall in 2024, the Dow Jones has allowed itself a break since the beginning of...
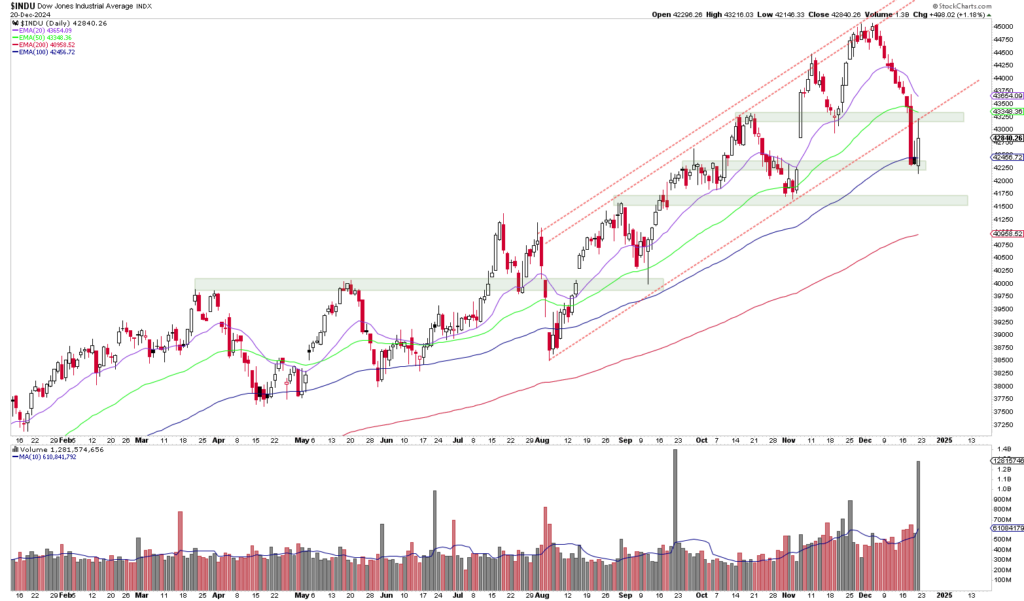
A stock market chart shows a candlestick pattern with trend lines and volume bars, which indicates fluctuations in the Dow Jones Industrial Average over several months.

Dear trader, dear stock market friends. The past trading week was characterized by strong sell-offs on the stock markets. The Dow Jones closed almost...
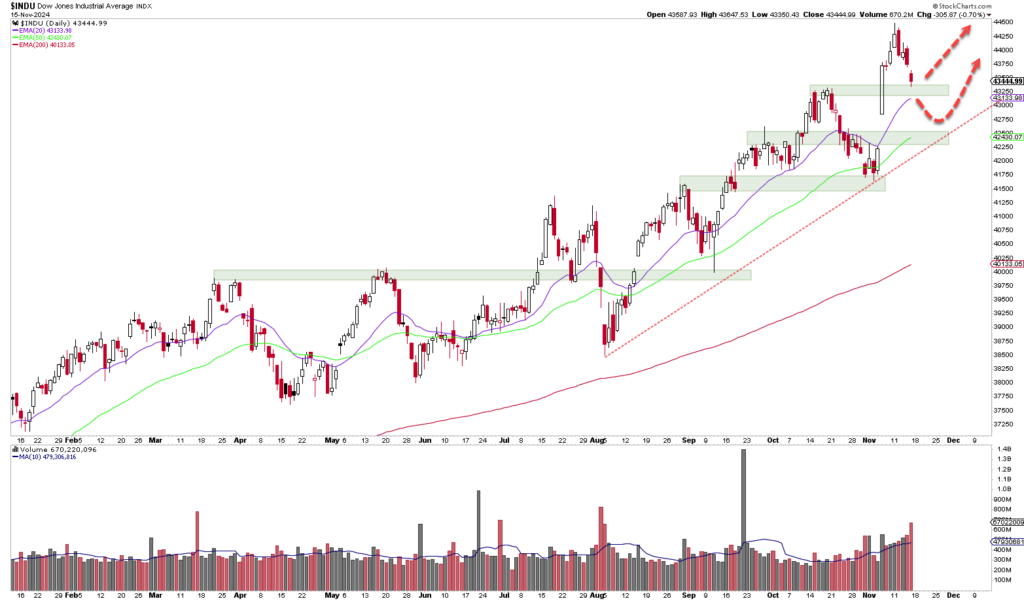
A stock chart showing the Dow Jones Industrial Average with trend lines, moving averages and volume bars. The chart highlights possible future movements with arrows and shaded areas and resembles a carefully crafted blueprint.

Dear trader, dear stock market friends. After the initial very bullish reaction to the outcome of the US election the week before last, the...

Design of a line chart showing the Dow Jones Industrial Average from July 2010 to October 2023, with automatically calculated trend lines, moving averages and volume bars at the bottom.

Dear trader, dear stock market friends. The Dow Jones is currently moving upwards as if on rails. With a plus of 0.96 %...
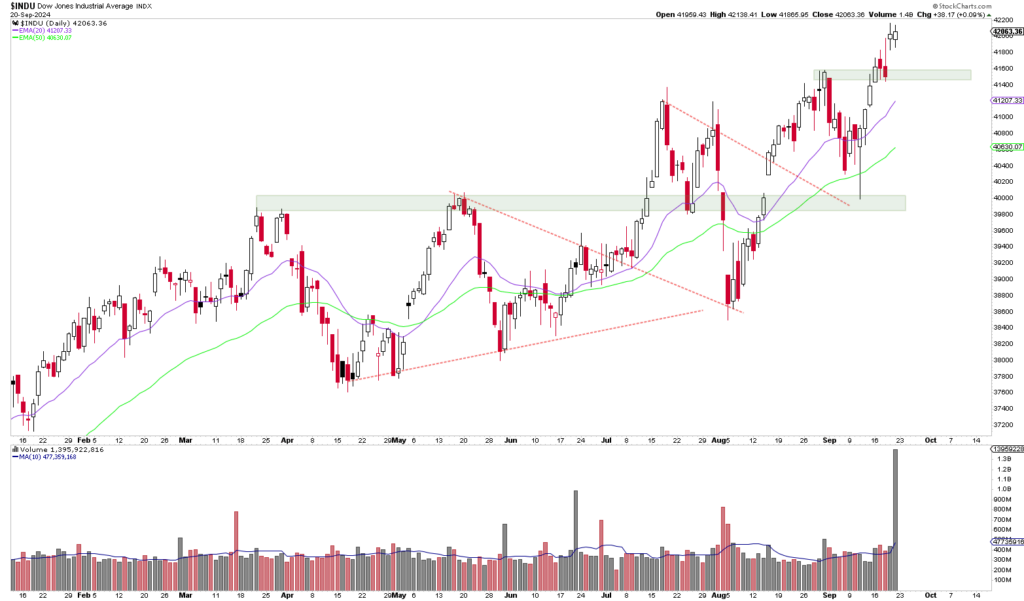
A candlestick chart showing the Dow Jones Industrial Average Index over several months, with moving averages and trading volumes below the main chart. Auto-saved draft includes various technical indicators and resistance levels carefully plotted for in-depth analysis.

Dear trader, dear stock market friends. With a rise of 1.62 % and the achievement of a new all-time high, the Dow Jones...
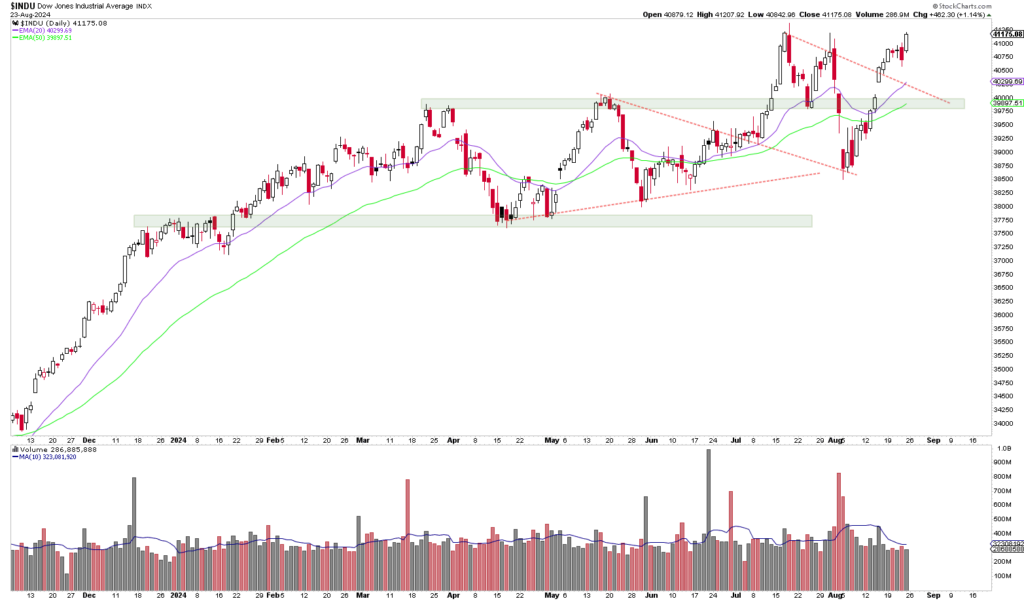
Stock market chart showing the behavior of the Dow Jones Industrial Average over a period from the end of 2020 to mid-2021, with various technical analysis indicators such as moving averages and volume bars, saved as an automatically saved draft for future reference.

Dear trader, dear stock market friends. With a closing price of 41,175 points, the Dow Jones closed last Friday just a few points...
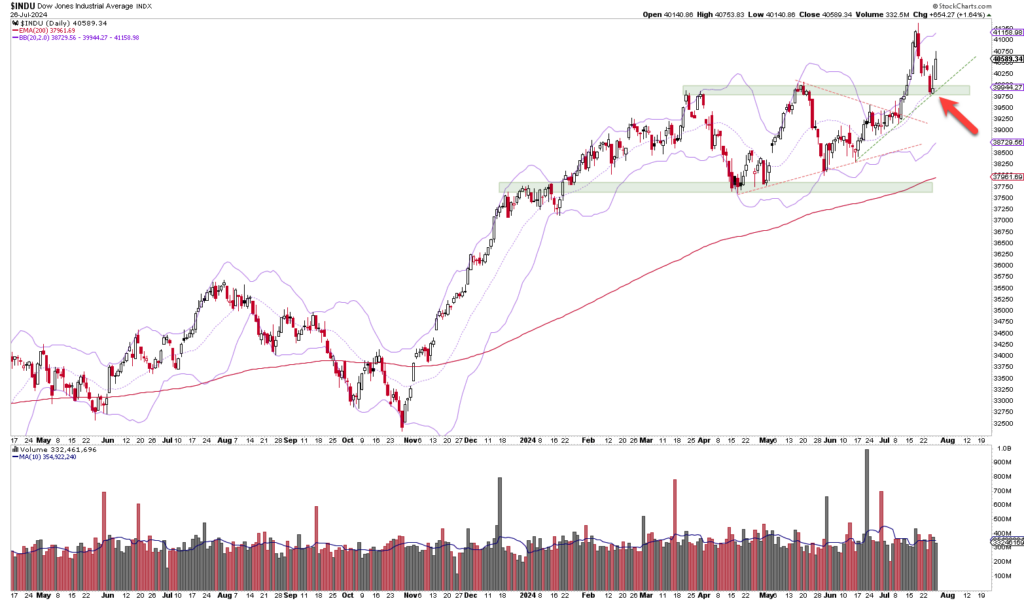
A stock market chart that shows the Dow Jones Industrial Average Index from May 2021 to August 2022 and automatically integrates candlestick patterns, volume bars, Bollinger bands, support/resistance levels and a 200-day moving average.

Dear trader, dear stock market friends. While the S&P 500 and the Nasdaq 100 ended the week on a negative note, the...

A stock chart for the Dow Jones Industrial Average (DJIA) that shows its performance with candlestick charts, Bollinger bands, a moving average line and volume bars from May through July, with an auto-saved draft for seamless updates.

Dear trader, dear stock market friends. The Dow Jones Index showed some fluctuations last week, but the bottom line is that it...
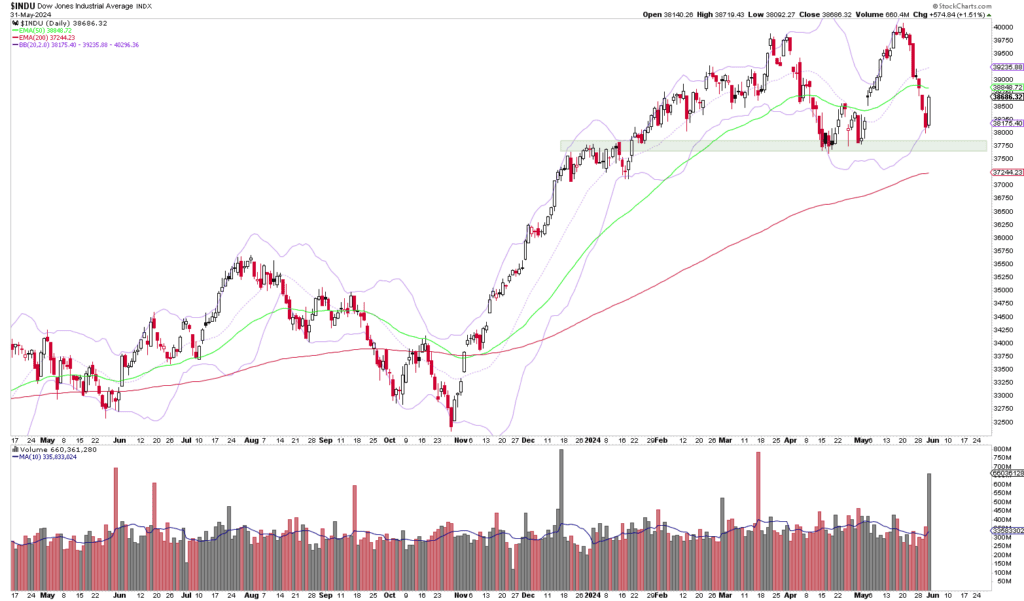
Ein Börsenchart, der den Dow Jones Industrial Average Index über einen Zeitraum von einem Jahr zeigt, mit Candlestick-Mustern, Volumenbalken am unteren Ende und verschiedenen gleitenden Durchschnitten. Dieser automatisch gespeicherte Entwurf liefert wertvolle Erkenntnisse für strategische Anlageentscheidungen.

Lieber Trader, liebe Börsenfreunde. Mit einem Schlusskurs von 38.686 Punkten und einem Anstieg von 572 Punkten beziehungsweise 1,5 % im…

Liniendiagramm, das den automatisch gespeicherten Entwurf des Dow-Jones-Industrial-Average-Trends mit Anmerkungen, gleitenden Durchschnitten und Volumenbalken von 2008 bis 2023 zeigt

Lieber Trader, liebe Börsenfreunde. Die vergangene Handelswoche war geprägt durch Nervosität und eine zunächst abwartende Haltung in Verbindung mit einer…

Email:

info@captrader.com

Send e-mail

Phone:

Hotline (Germany)
0800-8723370

Hotline (International)
00800-08723370

Further contact options