Your Broker for worldwide trading

Nasdaq 100

The Nasdaq 100 Index is a stock market index that reflects the performance of 100 of the largest non-financial companies listed on the Nasdaq Stock Market. It mainly comprises technology companies and is regarded as an important indicator for the development of the technology sector on the stock market.

Dear traders, dear stock market friends. The Nasdaq has had one of the most turbulent trading weeks of the year. Even before the central bank meeting last...
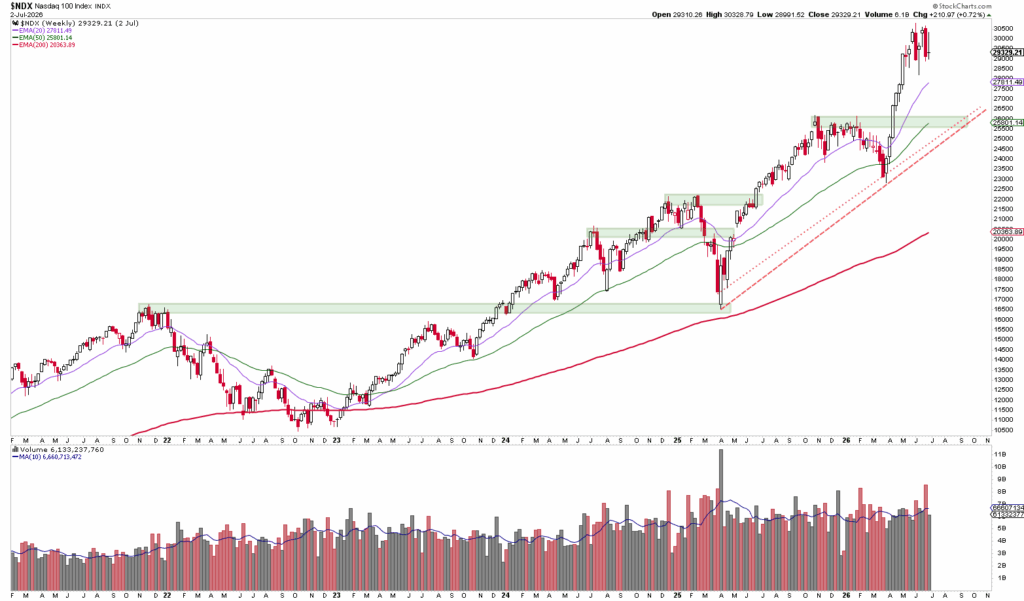
Dear traders, dear stock market friends. After the record-breaking rally in the Nasdaq 100 in the first five months of the year,…
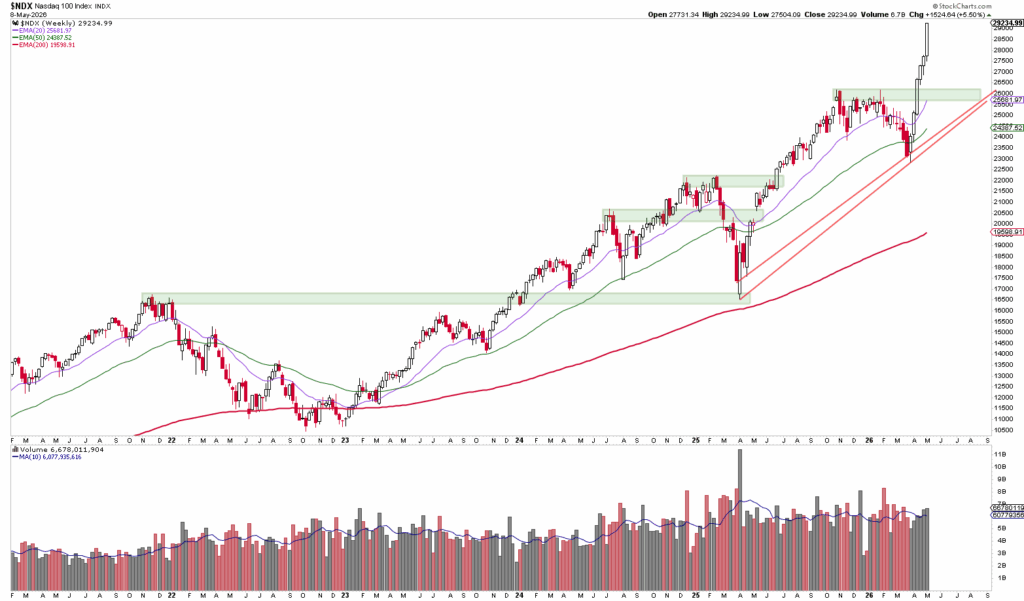
Dear traders, dear stock market friends. Technology stocks have once again taken the lead on the US stock market in recent weeks. The Nasdaq 100 was able to…
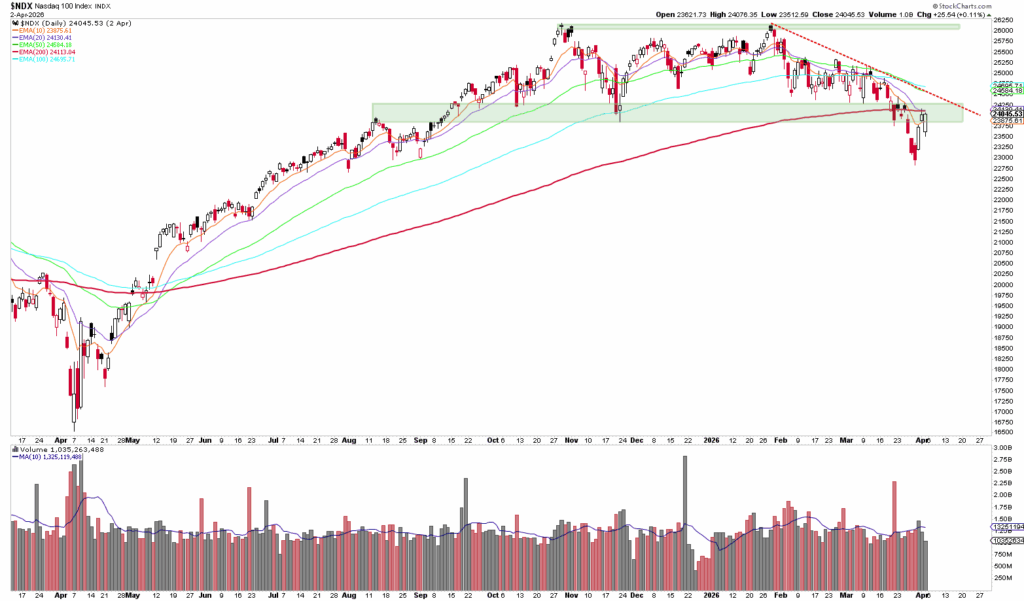
Stock chart with daily candles, moving averages, volume bars, and a downtrend from February to April, with highlighted resistance and support zones.

Dear traders, dear stock market friends. The Nasdaq 100 managed a rebound last trading week after five consecutive weeks of losses,…
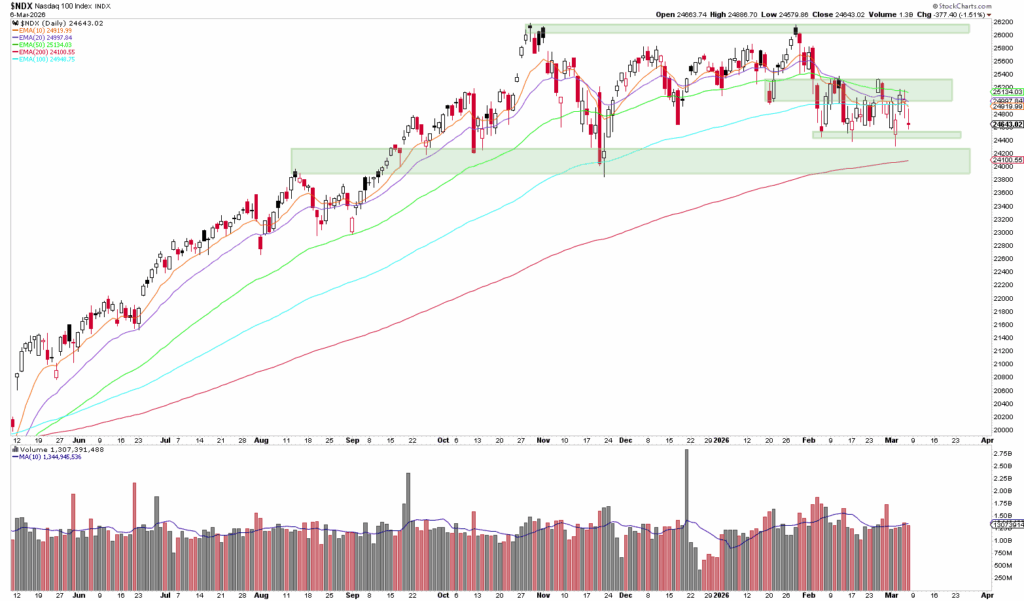
Candlestick chart of the $NIKK index with moving averages, highlighted support zones and volume bars from July through February, and analysis comparing recent trends to the Nasdaq 100 amid economic concerns.

Dear traders, dear stock market friends. In the past trading week, the Nasdaq 100 had to contend with several negative factors at the same time: the escalating...
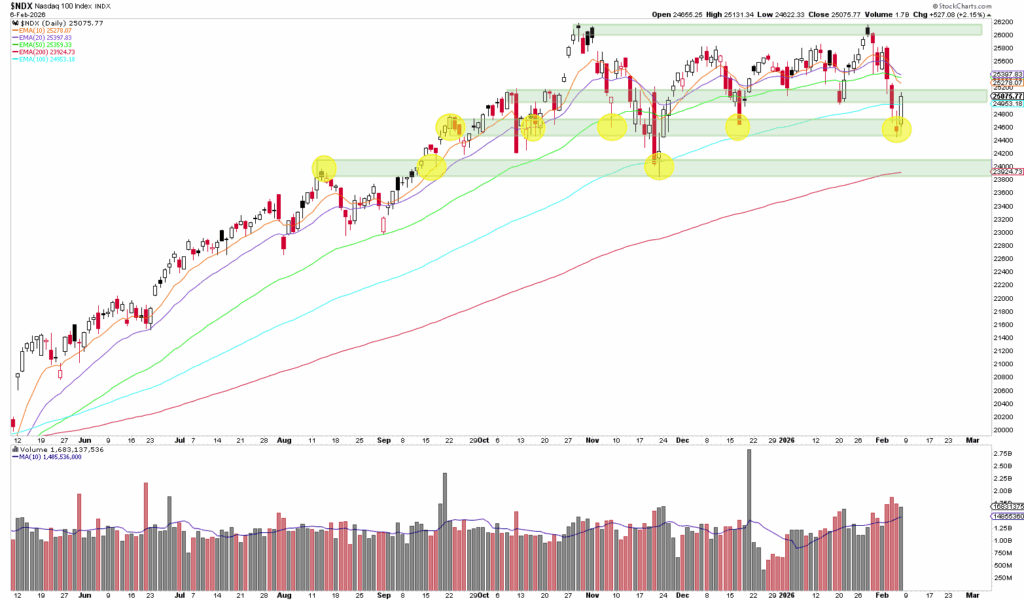
Candlestick chart of the Nasdaq 100 with several moving averages, highlighted support levels signaling a possible recovery, and trading volume bars below the main chart.

Dear traders, dear stock market friends. The relative weakness of the Nasdaq 100 against the S&P 500 and the Dow Jones continued...

Stock chart of the Nasdaq 100 from May 2019 to February 2020, with daily candles, moving average, Bollinger Bands, volume bars, MACD indicator and relative weakness for additional meaning.

Dear traders, dear stock market friends. With a rise of 2.2 %, the Nasdaq 100 has been able to hold its own in the past trading week with...

Candlestick chart showing the price movements of the Nasdaq index over time with Bollinger bands, a 50-day moving average and highlighted support and resistance zones.

Dear traders, dear stock market friends. While the Dow Jones reached a new all-time high last week, the Nasdaq 100 came under pressure...

A price chart of the Nasdaq 100 with candles, a moving average line, shaded support zones and four red arrows indicating the bounce off important support levels near the 25,000 point mark during an uptrend.

Dear traders, dear stock market friends. The Nasdaq 100 ended the past trading week with a loss of 0.2 %, closing...

Line chart of the $NIKK index from September 2019 to October 2020, showing price movements, volume bars, moving averages, and turbulence as well as recoveries in marked support and resistance zones - similar to the Nasdaq 100.

Dear traders, dear stock market friends. An eventful week lies behind us: the Nasdaq 100 closed last Friday at 24,817.95 points,...

Email:

info@captrader.com

Send e-mail

Phone:

Hotline (Germany)
0800-8723370

Hotline (International)
00800-08723370

Further contact options