Your Broker for worldwide trading

Nasdaq 100

The Nasdaq 100 Index is a stock market index that reflects the performance of 100 of the largest non-financial companies listed on the Nasdaq Stock Market. It mainly comprises technology companies and is regarded as an important indicator for the development of the technology sector on the stock market.
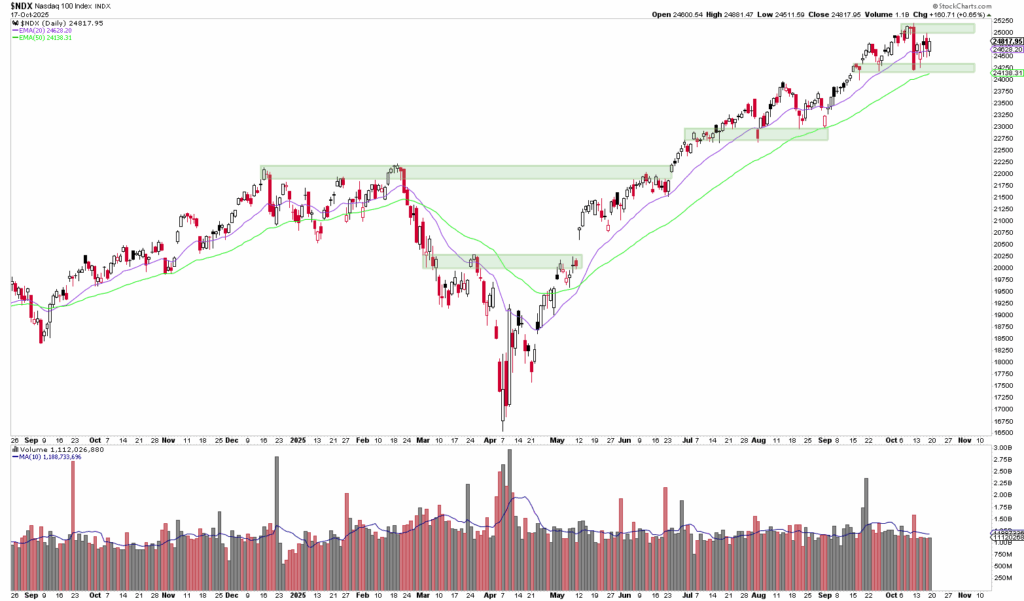
Price chart of the Nasdaq 100 with candles, moving averages, highlighted support zones and volume bars at the bottom showing an increase in trading volume at the right end amid the recent interest rate reversal.

Dear traders, dear stock market friends. The positive sentiment on the stock markets has continued in the past trading week. The Nasdaq 100...
A share chart shows the price development with candles, moving averages, highlighted support/resistance zones and volume bars from the end of 2022 to September 2023.

Dear trader, dear stock market friends. After the stock markets initially trended weakly at the start of the week and continued their corrections, this was followed on Friday...

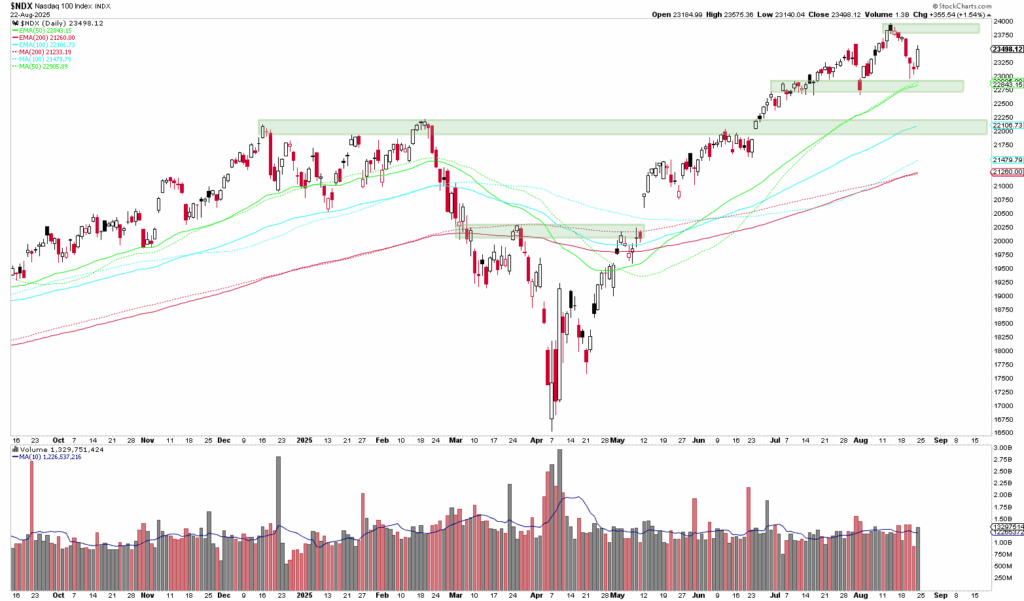
A stock chart shows the price and volume development of the Nasdaq 100 Index with highlighted resistance zones and moving averages over one year.

Dear traders, dear stock market friends. With a score of 23,272 points, the Nasdaq 100 closed last Friday with another...

Candlestick share chart with moving averages and volume bars; the price reaches a new high with increased trading volume, indicated by a red arrow.

Dear traders, dear stock market friends. The Nasdaq-100 continued to soar in the past trading week and closed the week at 22,534...
Line chart of stock prices for $NEE from late 2023 to mid-2024, showing upward and downward trends, moving averages and trading volume bars below.

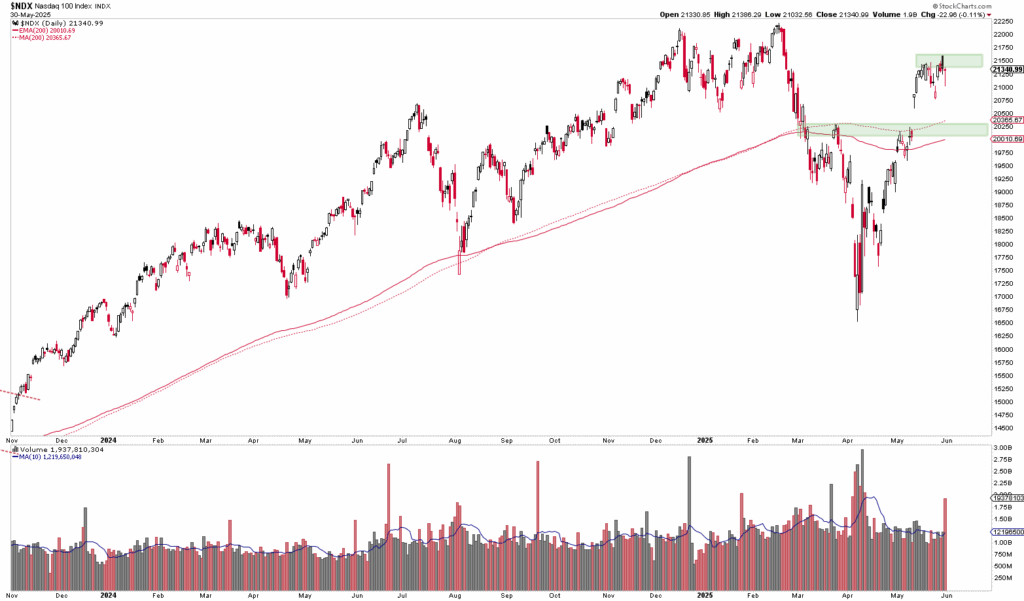
Dear traders, dear stock market friends. The Nasdaq 100 Index rose 9.2 percent in May, its best monthly performance since the beginning of...
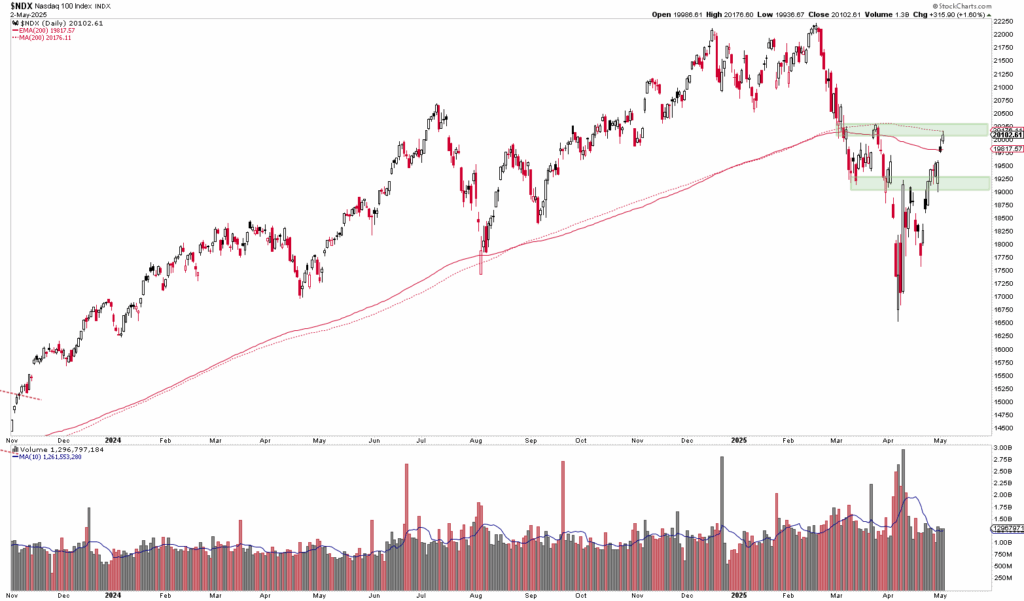
Stock price chart showing a sharp decline followed by a partial recovery, with two moving averages and highlighted resistance areas and trading volume bars below.

Dear traders, dear stock market friends. The Nasdaq 100 has staged a brilliant comeback in the last two weeks....
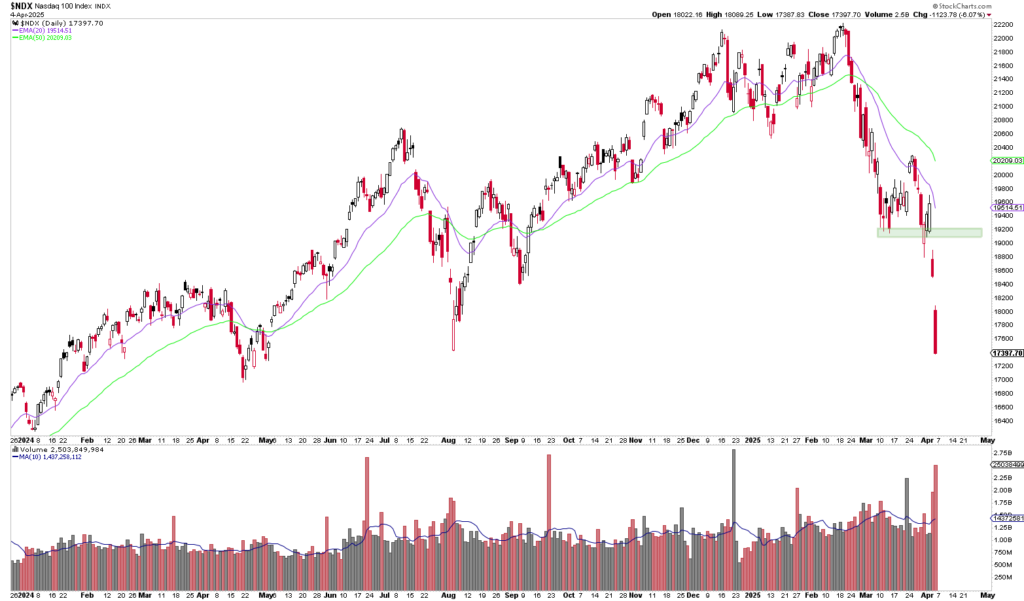
Candlestick chart of the stock market with moving averages and volume bars, showing a downward trend and a clear decline at the end.

Dear traders, dear stock market friends. With a drop of 9.8 %, the Nasdaq 100 experienced one of its weakest weeks in a long time....

Candlestick chart showing the development of the Nasdaq 100 Index with moving averages and RSI below. Green and red lines, highlighted support areas, January 2023 to March 2025.

Dear traders, dear stock market friends. In the past trading week, the US stock markets came under pressure across the board. The Nasdaq 100...

Stock chart of the Nasdaq 100 Index with upward trend, moving averages, volume bars and an arrow indicating possible future movements.

Dear traders, dear stock market friends. Following last week's announcement of new tariffs by the USA, the stock market initially...

Stock chart with overlaid candlestick patterns, volume bars and moving averages (EMA 20, EMA 50 and 200 days). The chart shows upward and downward trends in the price movement.

Dear traders, dear stock market friends. The Nasdaq 100 ended the trading week on Friday with a score of 20,848, which represents a drop of...

Email:

info@captrader.com

Send e-mail

Phone:

Hotline (Germany)
0800-8723370

Hotline (International)
00800-08723370

Further contact options