Your Broker for worldwide trading

Index

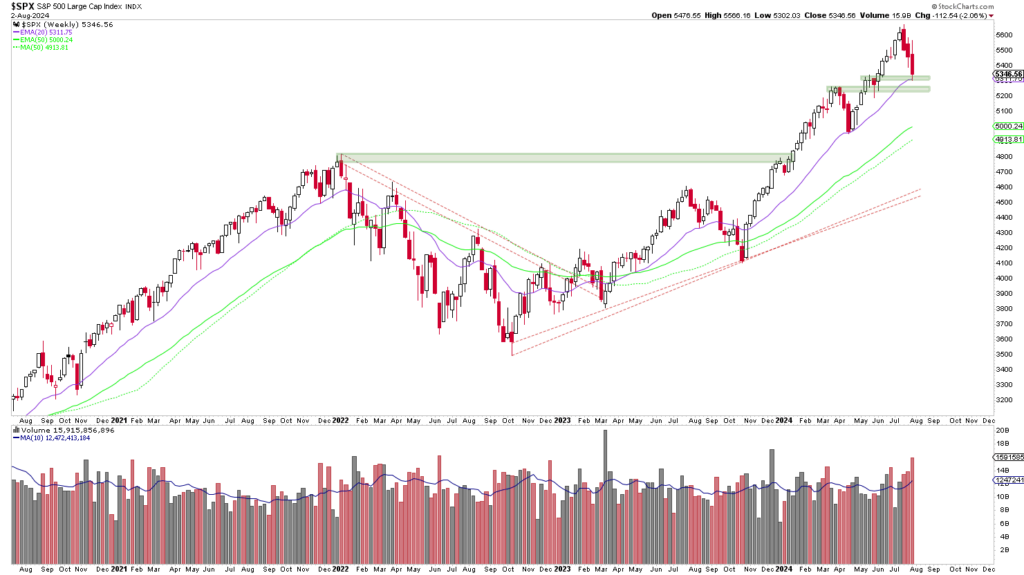
Line chart showing the development of the S&P 500 index from mid-2018 to mid-2023, with various moving averages and volume bars below. The index is shown with various support and resistance levels marked in this automatically saved draft.

Dear traders, dear stock market friends. The last few days have been turbulent on the stock markets and volatility has increased significantly...
A stock market chart that shows the Dow Jones Industrial Average Index from May 2021 to August 2022 and automatically integrates candlestick patterns, volume bars, Bollinger bands, support/resistance levels and a 200-day moving average.

Dear trader, dear stock market friends. While the S&P 500 and the Nasdaq 100 ended the week on a negative note, the...

A stock market chart shows the Nasdaq 100 Index with candlestick patterns, moving averages, trading volume and RSI indicator. The chart spans from October 2023 to the end of July 2024 and includes an automatically saved draft for tracking changes.

Dear trader, dear stock market friends. The Nasdaq 100 ended the past trading week with losses. The technology index is now trading 5.65 % below...

A stock chart showing the DAX index with candlestick patterns, trend lines, moving averages and an arrow indicating a possible upward movement. Includes volume and RSI indicators at the bottom. This automatically saved design captures all essential market data.

Dear traders, dear stock market friends. Following the correction in May and June, the DAX has received renewed support in the last three weeks....

Bar chart showing the performance of various S&P 500 sectors from June 26, 2023 to July 5, 2023. Auto-saved draft shows that Technology is the best performer at +2.10 %, while Utilities lag at -2.47 %.

Dear traders, dear stock market friends. The US stock markets experienced another week of new records last week. The S&P...

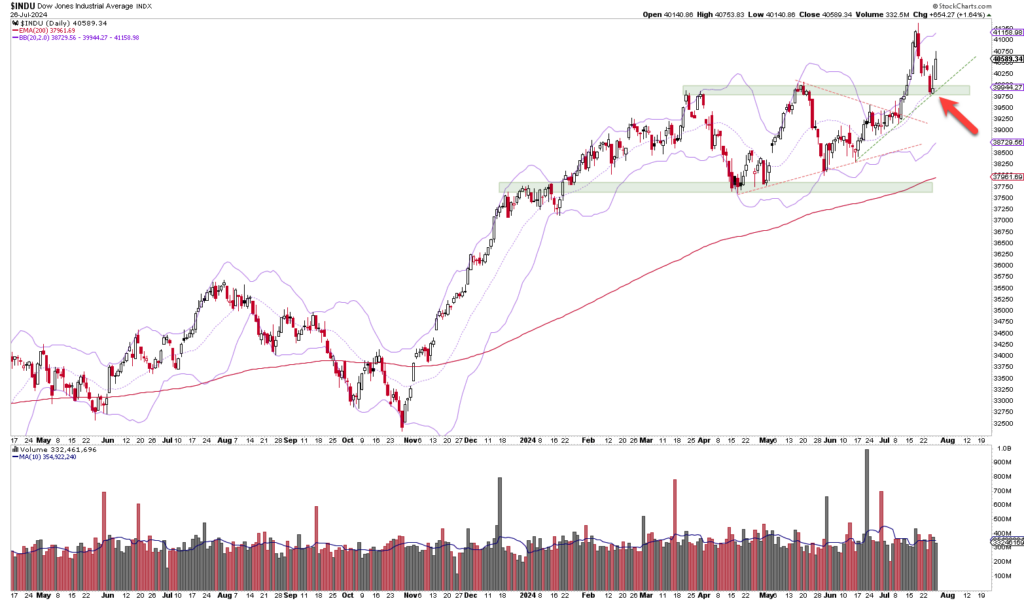
A stock chart for the Dow Jones Industrial Average (DJIA) that shows its performance with candlestick charts, Bollinger bands, a moving average line and volume bars from May through July, with an auto-saved draft for seamless updates.

Dear trader, dear stock market friends. The Dow Jones Index showed some fluctuations last week, but the bottom line is that it...

Chart of the Nasdaq 100 Index from December 2023 to June 2024, showing candlestick data, moving averages, Bollinger Bands and trading volume. An auto-saved draft shows two red arrows highlighting a key drop and RSI indicator zone.

Dear trader, dear stock market friends. The Nasdaq 100 started last week's trading session with gains, before...

Liniendiagramm, das die Bewegung des DAX-Index von Oktober bis Juni zeigt. Es zeigt einen Aufwärtstrend mit mehreren Unterstützungslinien und einem kürzlichen Rückgang unter ein wichtiges Unterstützungsniveau, das mehrere gleitende Durchschnitte kreuzt. Der Entwurf wurde zur späteren Bezugnahme gespeichert und Aktualisierungen werden automatisch eingearbeitet.

Liebe Trader, liebe Börsenfreunde. Mit einem Kursrückgang von 2,99 % erlebte der DAX in der letzten Handelswoche die schwächste Woche…

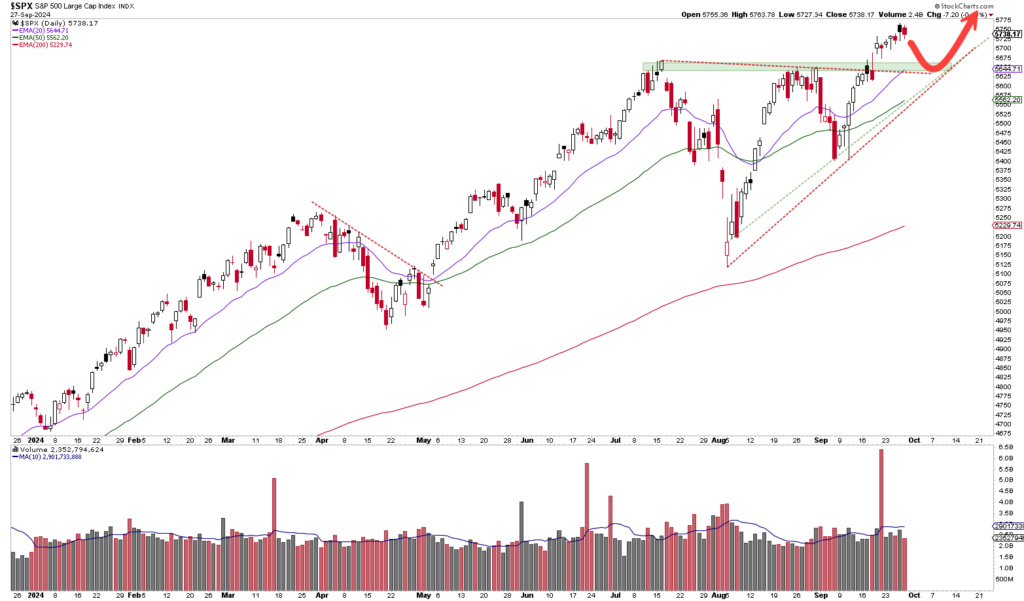
Ein Aktienchart für den S&P 500 mit steigenden Trendlinien und gleitenden Durchschnitten. Ein roter Pfeil hebt einen aktuellen Höchststand oder „Neue Hochs“ hervor, während ein zweiter Pfeil auf einen Anstieg des Handelsvolumens am unteren Ende des Charts hinweist.

Liebe Trader, liebe Börsenfreunde. Der S&P 500 schloss am Freitag nahezu unverändert und erzielte auf Wochenbasis einen moderaten Anstieg von…

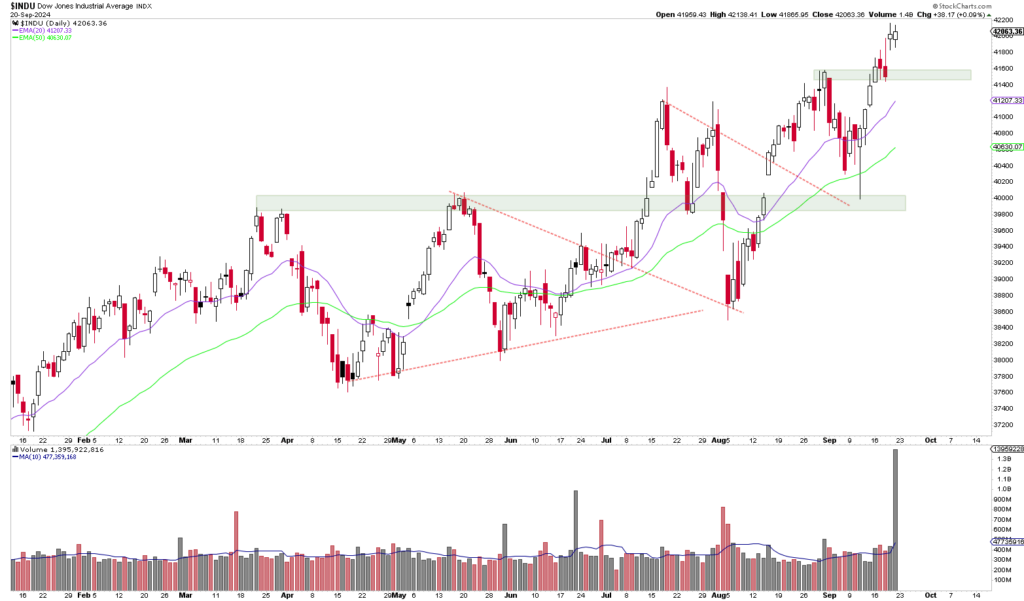
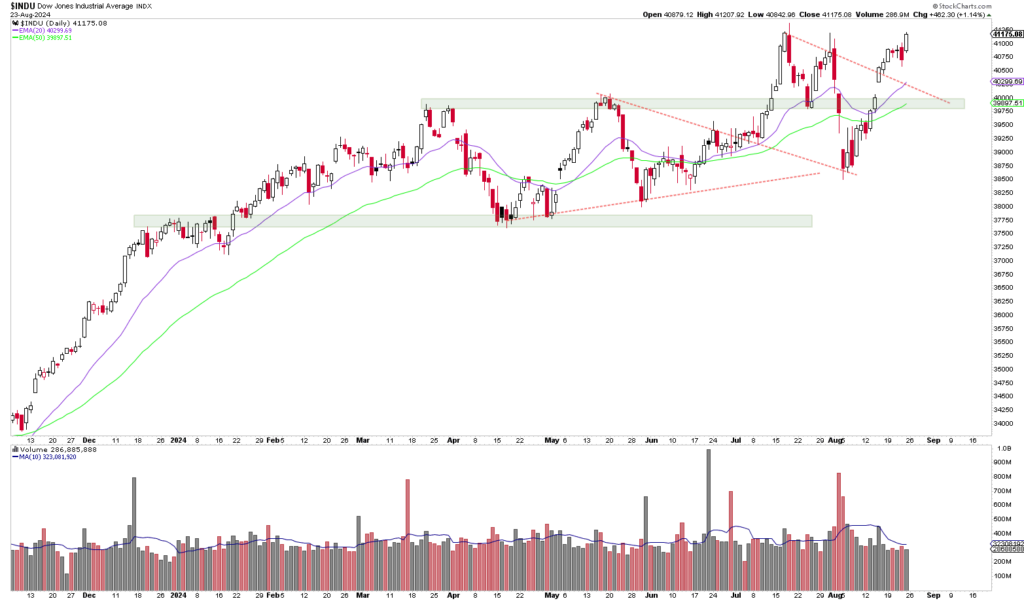
Ein Börsenchart, der den Dow Jones Industrial Average Index über einen Zeitraum von einem Jahr zeigt, mit Candlestick-Mustern, Volumenbalken am unteren Ende und verschiedenen gleitenden Durchschnitten. Dieser automatisch gespeicherte Entwurf liefert wertvolle Erkenntnisse für strategische Anlageentscheidungen.

Lieber Trader, liebe Börsenfreunde. Mit einem Schlusskurs von 38.686 Punkten und einem Anstieg von 572 Punkten beziehungsweise 1,5 % im…

Email:

info@captrader.com

Send e-mail

Phone:

Hotline (Germany)
0800-8723370

Hotline (International)
00800-08723370

Further contact options