Your Broker for worldwide trading

Index

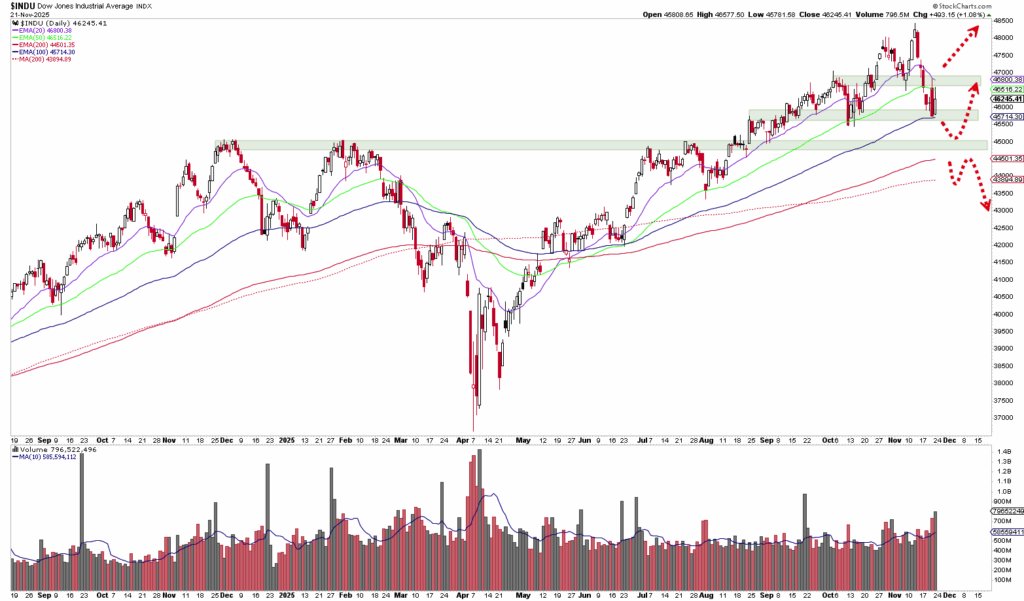
A candlestick chart of the Dow Jones Industrial Average on a daily basis with moving averages, volume bars and a highlighted resistance zone near the all-time high from the end of 2022 to the end of 2023.

Dear trader, dear stock market friends, With a gain of around 2.2 % and the breakout above the 47,000-point mark, the Dow...
Line chart of the $NIKK index from September 2019 to October 2020, showing price movements, volume bars, moving averages, and turbulence as well as recoveries in marked support and resistance zones - similar to the Nasdaq 100.

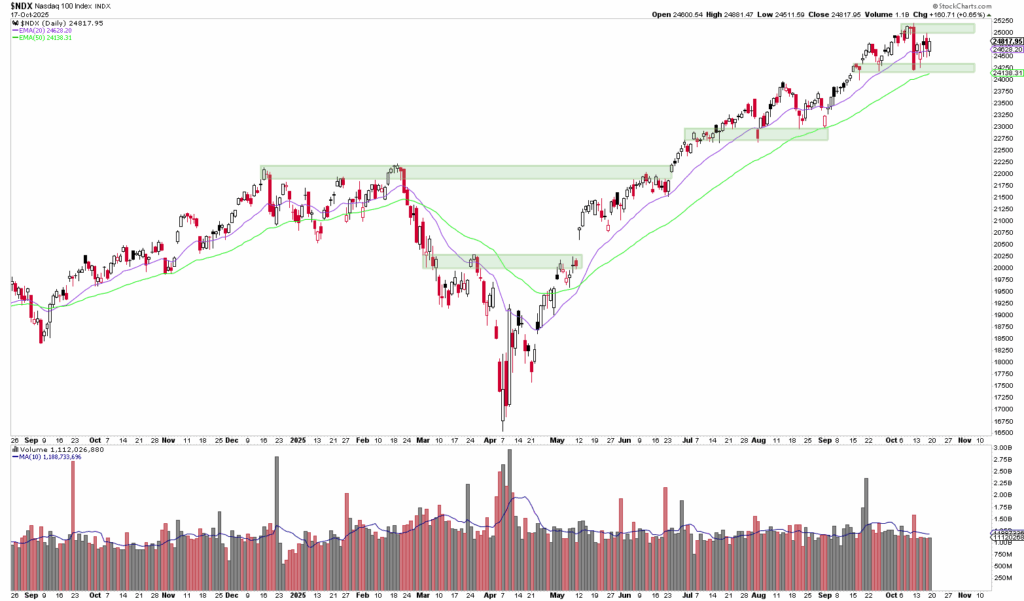
Dear traders, dear stock market friends. An eventful week lies behind us: the Nasdaq 100 closed last Friday at 24,817.95 points,...

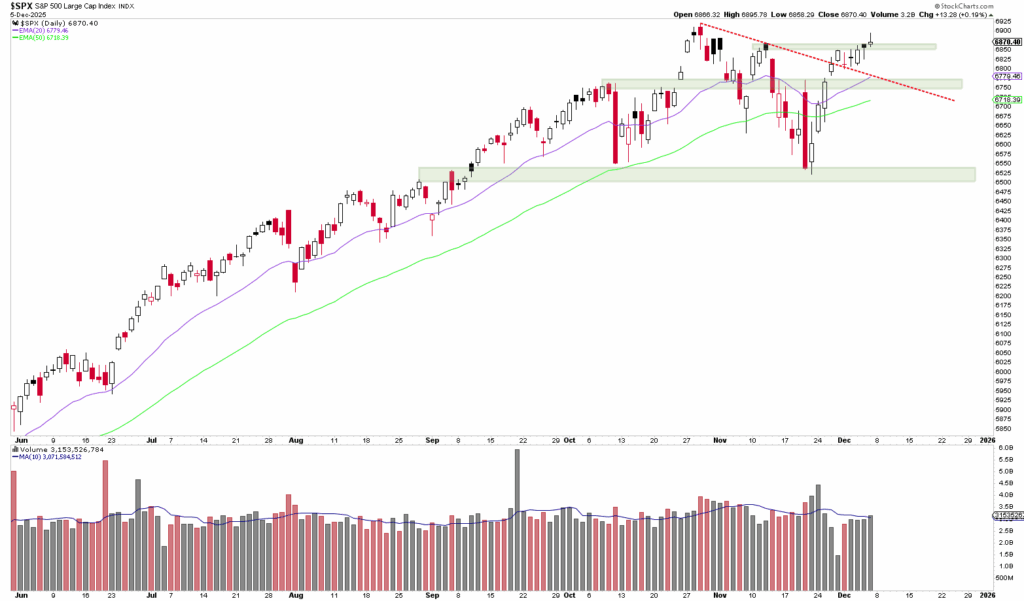
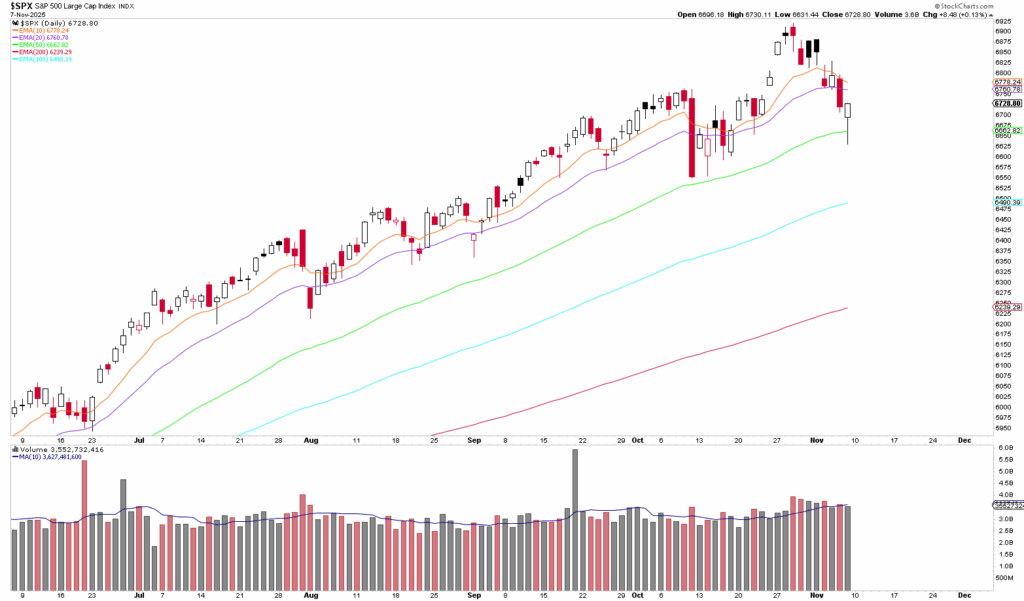
The candlestick chart of the S&P 500 Index shows a 21-day trading range followed by a sharp decline labeled "1 trading day" - a move that is often driven by fear and offers a potential TACO opportunity. Volume bars are shown below.

Dear traders, dear stock market friends. After the S&P 500 initially continued to rise in the past trading week and reached new all-time highs, the...

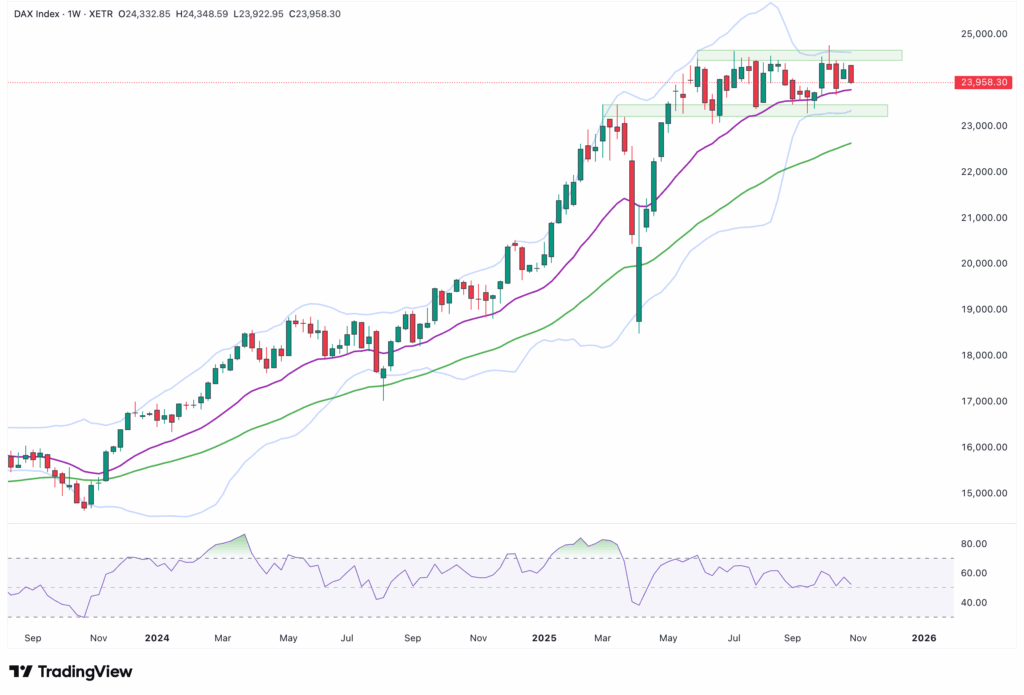
A candlestick chart of the DAX index with two red dashed lines indicating possible breakout paths; Bollinger bands and support/resistance zones are shown for detailed DAX analysis.

Dear traders, dear stock market friends. With a weekly performance of 2.7 %, the DAX once again showed strength in the past trading week and...

A candlestick chart of the Dow Jones Industrial Average shows the price development from 2018 to 2024 - with moving averages, support zones, trend lines and annotated profit points - and highlights a breather. The volume bars appear below.

Dear trader, dear stock market friends, With a weekly performance of - 0.15 %, the Dow Jones ended the trading week last Friday...

Price chart of the Nasdaq 100 with candles, moving averages, highlighted support zones and volume bars at the bottom showing an increase in trading volume at the right end amid the recent interest rate reversal.

Dear traders, dear stock market friends. The positive sentiment on the stock markets has continued in the past trading week. The Nasdaq 100...

Monthly candlestick chart of the S&P 500 Index from 2014 to 2019, showing a decline of 21% followed by a rise of 35%; includes moving averages, trading volume bars and provides an exciting Q4 outlook.

Dear traders, dear stock market friends. The S&P 500 Index is in impressive shape at the end of the third quarter of 2025. Since...

A candlestick chart of the DAX index showing the price movement from the end of 2022 to mid-2025 with Bollinger bands, moving averages and a highlighted consolidation range, based on an automatically saved draft.

Dear traders, dear stock market friends. While the US stock indices made headlines last week with new all-time highs, the US stock market is currently...

Stock chart of the Dow Jones Industrial Average from September 2020 to September 2021, showing an uptrend with daily candles, moving averages, volume bars and highlighted support/resistance zones.

Dear trader, dear stock market friends, The Dow Jones Industrial Average has performed well in recent weeks. Since the spring...

A share chart shows the price development with candles, moving averages, highlighted support/resistance zones and volume bars from the end of 2022 to September 2023.

Dear trader, dear stock market friends. After the stock markets initially trended weakly at the start of the week and continued their corrections, this was followed on Friday...

Email:

info@captrader.com

Send e-mail

Phone:

Hotline (Germany)
0800-8723370

Hotline (International)
00800-08723370

Further contact options