Your Broker for worldwide trading

Index

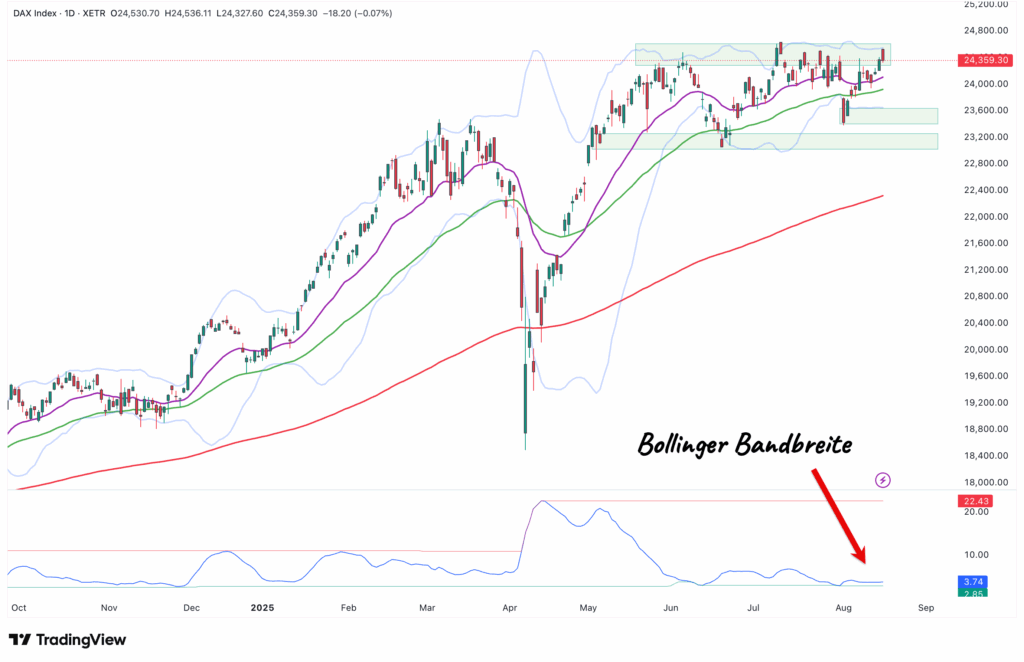
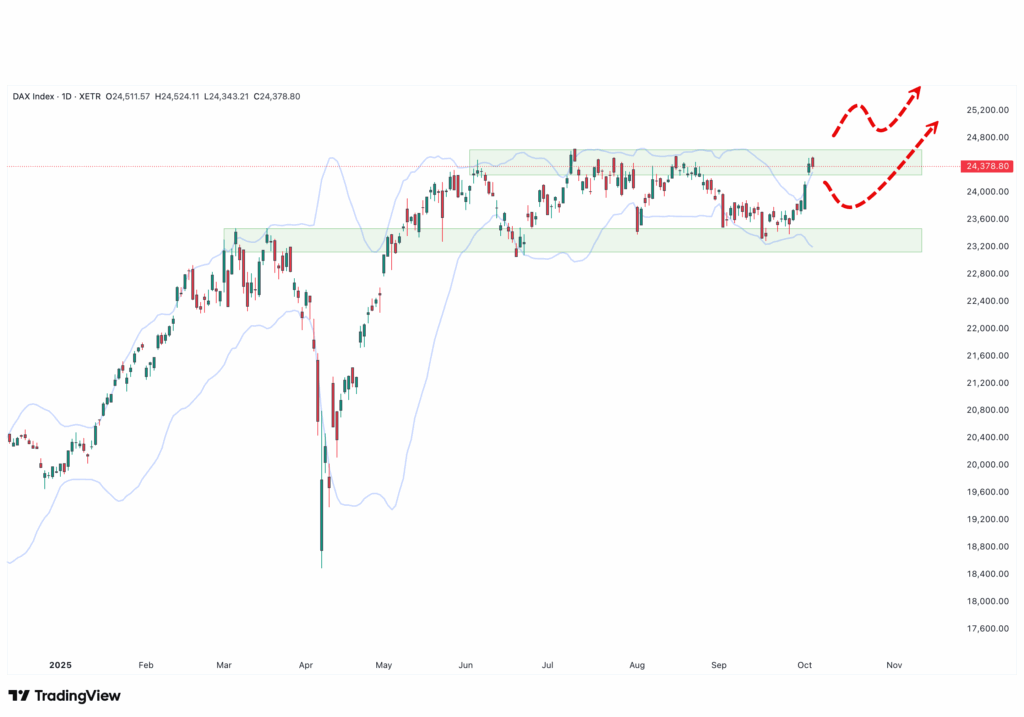
A candlestick chart of the DAX index with moving averages, Bollinger bands, highlighted price ranges and a Bollinger bandwidth indicator at the bottom marked by a red arrow.

Dear traders, dear stock market friends. After a brief breather at the beginning of August, the DAX has regained significant momentum in recent days.
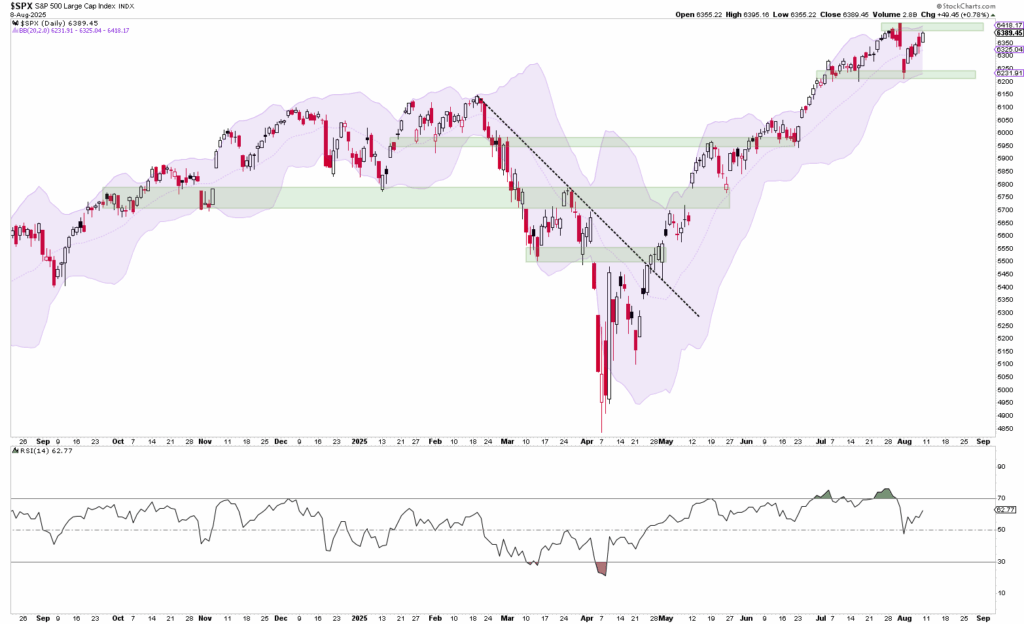
Line chart of the S&P 500 with Bollinger Bands, highlighted support/resistance zones, trend lines plotted and an RSI indicator plotted below.

Dear traders, dear stock market friends. The first week of August began volatile, but in the end brought a tailwind for the stock markets. The S&P...
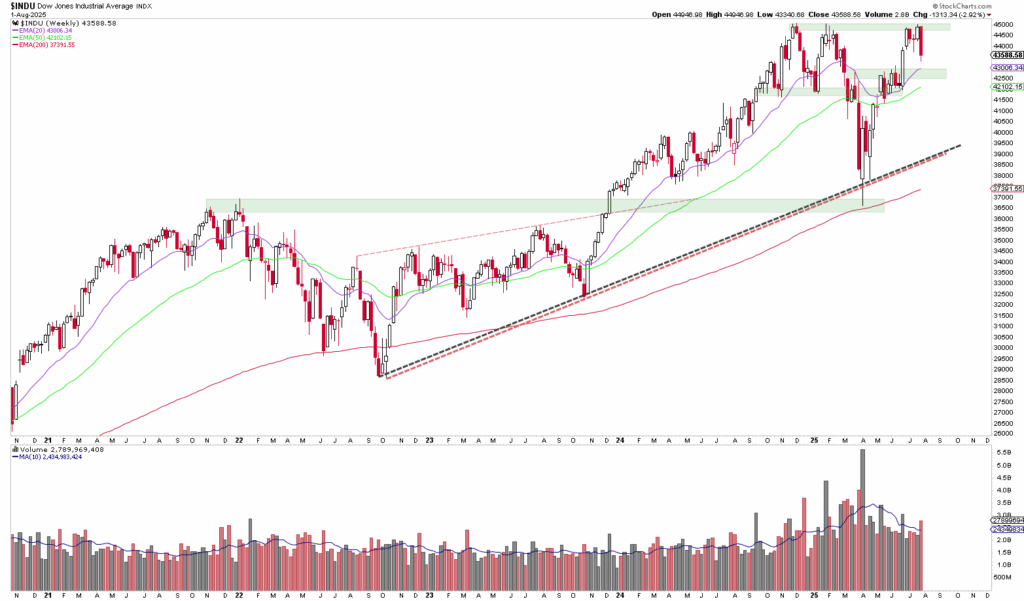
Line chart of the Dow Jones Industrial Average from 2017 to 2024 with moving averages, support/resistance zones, trend lines and trading volume bars below.

Dear trader, dear stock market friends. Since bottoming out on April 7, the Dow Jones has gained more than a third of its...

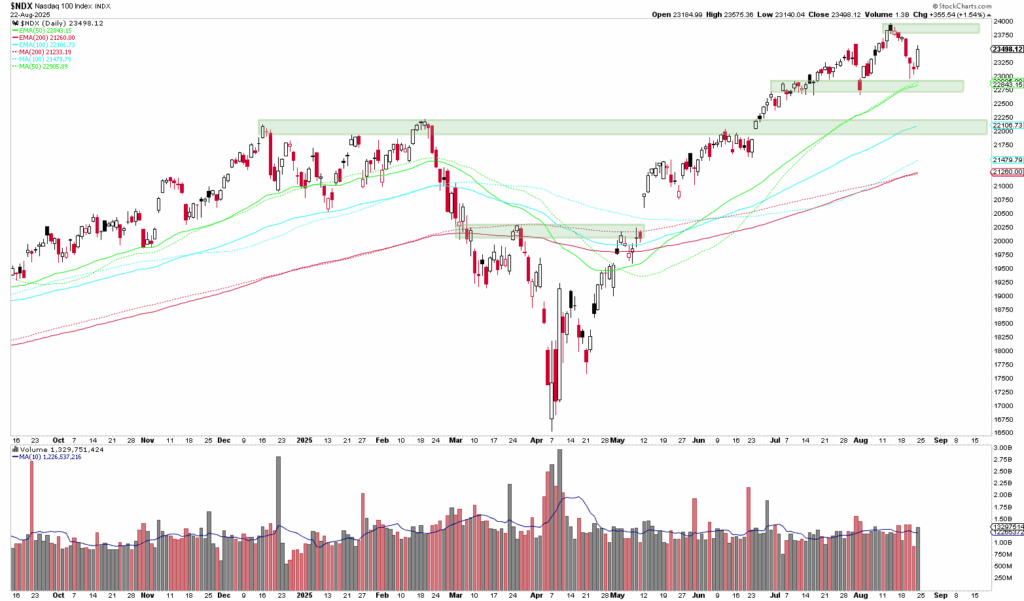
A stock chart shows the price and volume development of the Nasdaq 100 Index with highlighted resistance zones and moving averages over one year.

Dear traders, dear stock market friends. With a score of 23,272 points, the Nasdaq 100 closed last Friday with another...

Share price chart with candles, moving averages, Bollinger Bands and volume bars; shows an upward trend with recent consolidation and relative strength index at the bottom.

Dear traders, dear stock market friends. The German share index DAX is currently still trading stably above the 24,000-point mark, close to its all-time high,...

Line chart of the S&P 500 Index from March 2023 to June 2024 with moving averages, vertical red lines marking specific dates and two technical indicators displayed below the price chart.

Dear traders, dear stock market friends, With a weekly performance of -0.3 %, the S&P 500 ended a three-week period of...

A candlestick chart shows the Dow Jones Industrial Average Index with trend lines, moving averages, support zones and monthly trading volumes from 2016 to mid-2023.

Dear trader, dear stock market friends. The first week of July brought a fresh tailwind for the stock markets. The Dow Jones Industrial Average...

Candlestick share chart with moving averages and volume bars; the price reaches a new high with increased trading volume, indicated by a red arrow.

Dear traders, dear stock market friends. The Nasdaq-100 continued to soar in the past trading week and closed the week at 22,534...

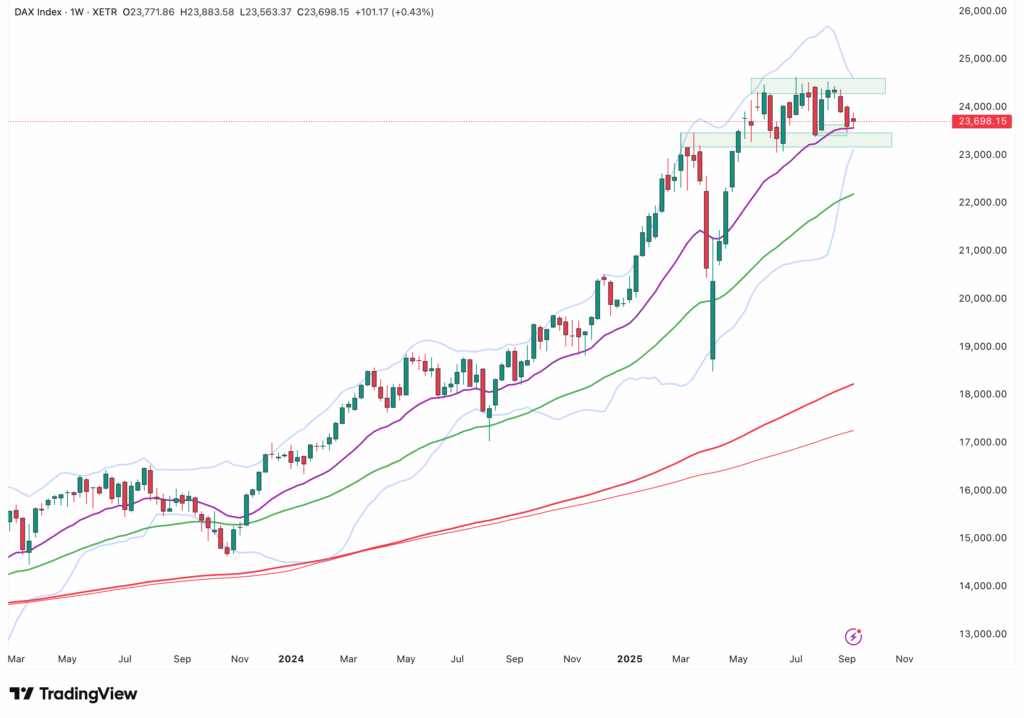
A stock chart of the DAX index with candles, moving averages, volume profile on the right and RSI indicator at the bottom, for the period from the end of 2024 to mid-2025.

Dear traders, dear stock market friends. The DAX continued its correction in the last trading week and ended the week with a...

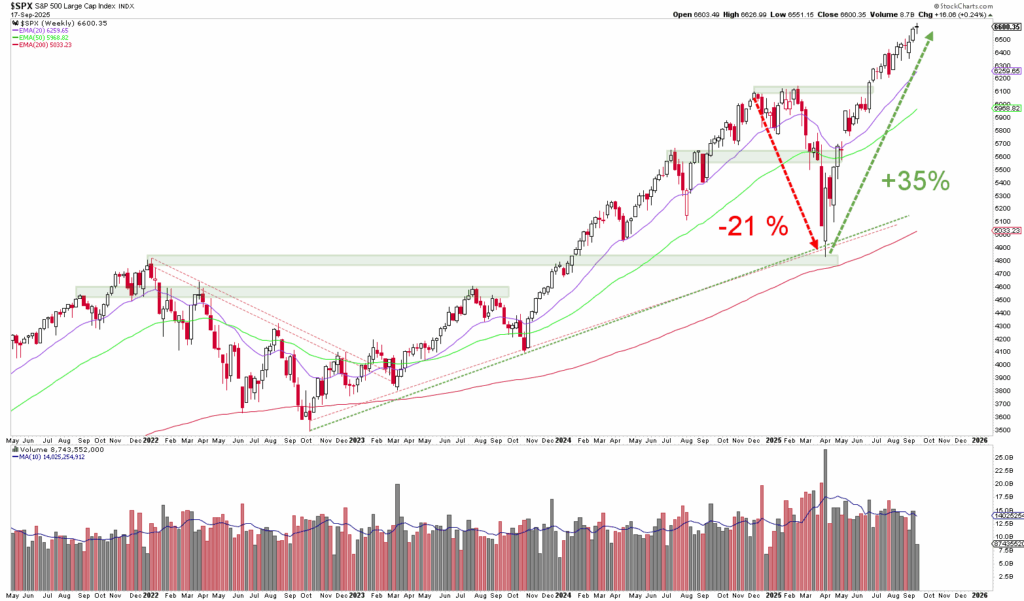
A daily candlestick chart of the S&P 500 index shows price movements, support and resistance zones, Bollinger Bands and the RSI indicator below the main chart.

Dear traders, dear stock market friends. The topics that we traders and investors usually deal with are technical analysis, intermarket...

Email:

info@captrader.com

Send e-mail

Phone:

Hotline (Germany)
0800-8723370

Hotline (International)
00800-08723370

Further contact options