In the last post on Business Development Companies, we took a close look at dividend coverage and the impact of the interest rate turnaround. In recent days, the sector has come back into focus, but this time from a more urgent angle, namely the so-called „Software Crash 2026". This downturn is hitting BDCs in a way that has surprised many investors and raises important questions about portfolio quality, the sustainability of distributions and the quality of individual managers. And that's what today's article "BDCs and the software crash" is all about.
A reminder for anyone who has not (yet) read the previous article. BDCs are publicly traded investment companies that provide debt and equity capital to middle-market US companies that are too small for the public bond market. They must distribute at least 90 % of their net taxable income and pay no corporate income tax on it. This structure ensures the typically high Dividend yields of 8 to 14 %, but also makes distributions directly dependent on net investment income (NII), i.e. interest income less operating costs. If you would like to read more about BDCs as a vehicle and the basic concepts, please refer to the linked article above.
The software crash and its impact on Private Credit
Since the end of 2025 and accelerated in January and February 2026, the software sector has been experiencing a correction that is not exactly ordinary, almost extraordinary. The trigger is the growing market conviction that agent-based AI and so-called „vibe coding" tools could pose a structural threat to the traditional SaaS (Software as a Service) business model. If AI systems write their own code and automate software processes, why do companies still need a dozen expensive software licenses? The sell-off started in the software sector and recently spread to other areas such as real estate, which is a pattern that experienced BDC investors already know from previous episodes, such as Oil & Gas 2015, COVID 2020, Consumer Cyclicals thereafter. Anyone who has been following the sector for a while will recognize the pattern. As soon as one topic dominates the headlines, all BDCs are often lumped together, regardless of whether the portfolio is solidly positioned or not. For informed investors, this is often the most interesting moment.
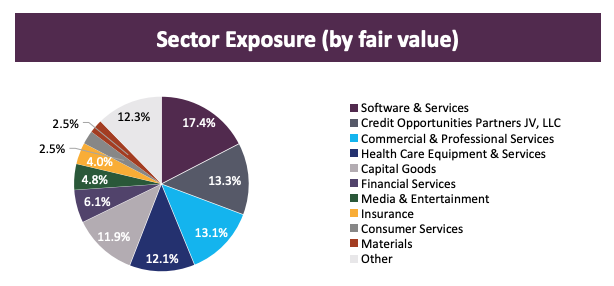
Nevertheless, the software crash is explosive for the BDC sector because software represents the largest single sector concentration in the portfolios of publicly traded BDCs. This is no coincidence, as for years software companies were considered virtually recession-proof, with recurring revenues (ARR), high margins and very loyal customer relationships.
The average BDC has suffered considerable price losses in recent weeks. As a result, the average RSI The average price across the sector in oversold territory is just over 30. By comparison, at the height of the panic on April 9, 2025, this figure was 17.
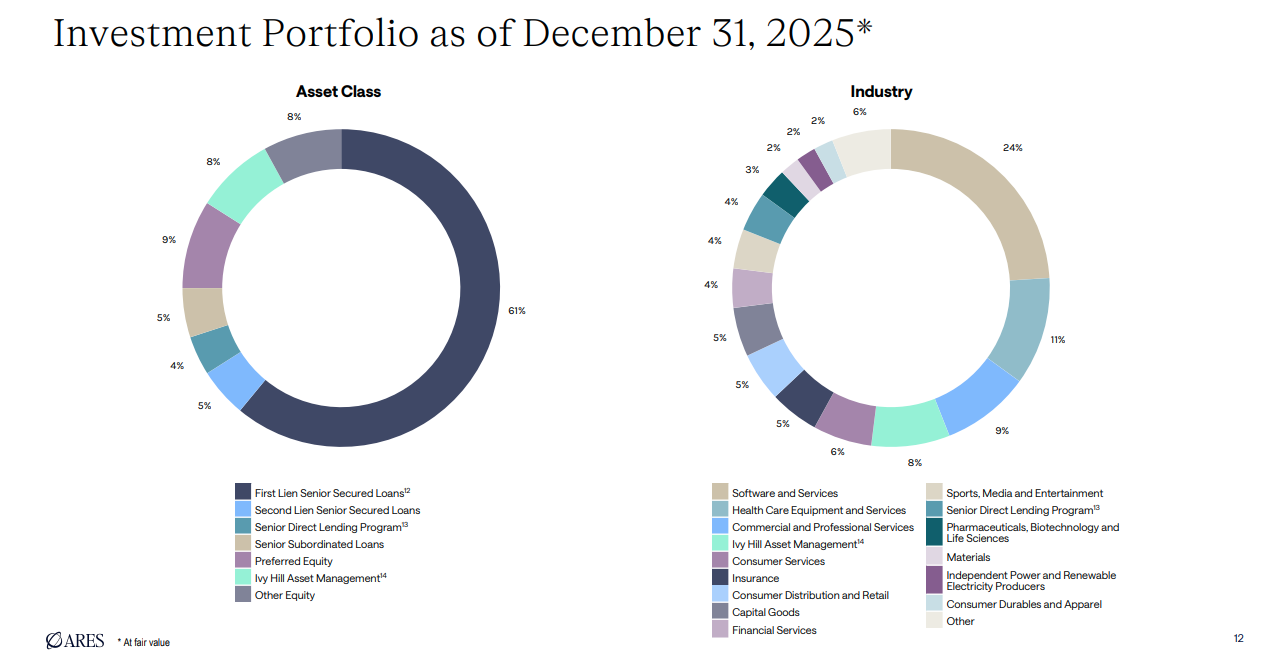
(Source: ARCC Q4-2025 Earnings Presentation)
What the BDC management say
With the start of the earnings season for Q4 2025, BDC managers made differentiated statements on software exposure. The core message that runs through almost all calls is that the market is currently pricing in equity risk, but not credit risk. Sixth Street Specialty Lending (TWS ticker: TSLX, ISIN: US83012A1007) put it particularly aptly in its earnings call. Credit spreads on listed software companies have only widened by 10 to 20 basis points since the beginning of the year, while valuation multiples have fallen by around 15 %. In other words, the shareholders are currently getting a slap on the wrist, while the lenders are still looking on relatively calmly. Whether this remains the case is of course the key question, but so far there is little to suggest a turnaround in credit quality.
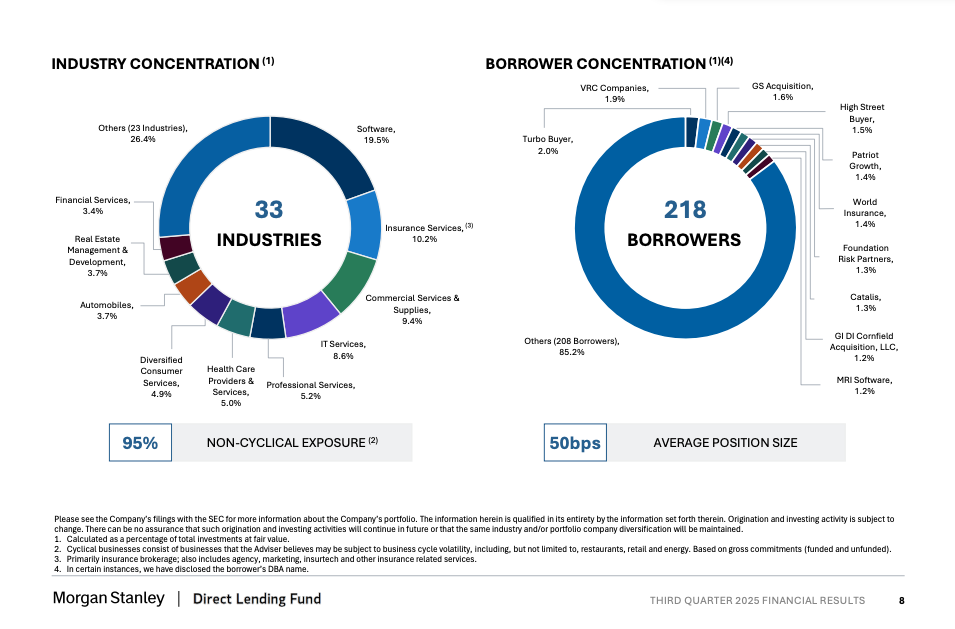
Morgan Stanley Direct Lending (TWS ticker: MSDL, ISIN: US61763Q1085) emphasized in its latest earnings call that the portfolio's software exposure of 19.5 % consists predominantly of ERP-related companies that act as the fundamental infrastructure of their clients and are thus particularly well shielded against AI disruption:
This allocation is anchored primarily in ERP-related software businesses that serve as the foundational infrastructure and contains the data for their end customers, which we believe will be more insulated from AI disruption.
The weighted average loan-to-value is around 40 %, the average loan-to-value is around 40 %. EBITDA $87 million, which shows that no speculative early-stage companies are being or have been financed here.
Hercules Capital (TWS ticker: HTGC, ISIN: US4272411053) stated that it deliberately does not finance pure-play AI or data center GPU structures and described its own criteria as follows:
- ARR attachment points below 1× on average
- Historical loan terms of less than 24 months
- Loan-to-values below 20 %
This is significantly more conservative than the market average for middle-market software loans, where LTVs of 40 to 60 % are typically the norm.
TSLX put it in a nutshell in its earnings call: "We don't earn when the company value rises, but we don't suffer when it falls either. What counts for us is whether the interest payment comes at the end of the month, and it does.
Another reassuring argument is the following statement. To make this a little more tangible: BDC is a lender, not a co-owner. So if a software company loses 30 % in value, it is painful for the equity investor, but the lender looks at it quite relaxed from the sidelines as long as the debt is still covered, and in well-structured portfolios it usually is, even after a significant discount. If you look at the operating figures of the borrowers, there is little there to indicate a catastrophe. According to KBRA, software companies in the private credit universe have recently grown at around 36 % EBITDA growth on an annualized basis. That doesn't sound like a sector that is collapsing.
Key figures that are relevant NOW
In the previous article, we discussed non-accruals, PIK share, dividend coverage, NAV discount and Leverage already explained. In the current market situation, however, some sub-aspects are coming more to the fore, which I would like to add here.
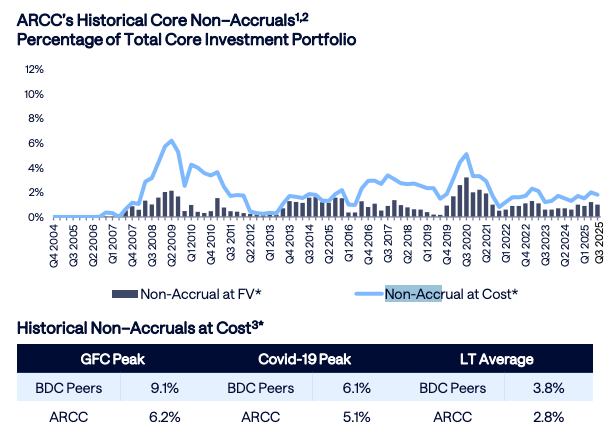
Loan-to-value (LTV) of the portfolio companies: As software lending is based on company values rather than real assets, the LTV value is particularly critical when valuation multiples fall. MSDL shows a weighted average of 40 %, TSLX of 41 %. Both values are comfortable buffers, showing that lenders are still well protected even in the event of a further market correction.
Watch List as a leading indicator: The watch list of a BDC, i.e. investments that are still servicing their loans but are being closely monitored, is often more important than the current non-accruals because it anticipates the non-accruals of the coming quarters. MSDL shows around 10.8 % of the portfolio at cost as a watch list (8.9 % at fair value), CGBD is at 8.6 %. The decisive factor here is how these investments are valued. MSDL's watch list positions are valued at an average of 84 % of acquisition costs, which still indicates sufficient buffer.
PIK share as a quality feature: The average PIK ratio in the BDC sector is around 8 % of total income. If it is significantly lower, it signals good portfolio quality because the borrowers pay their interest in cash instead of in additional debt or similar. MSDL comes in at just 3.9 %, Trinity Capital (TWS ticker: TRIN, ISIN: US89656D1054) even at just 0.9 %. Carlyle Secured Lending (TWS ticker: CGBD, ISIN: US14316J1079), on the other hand, is at 9.7 %, which investors should keep an eye on.
Spillover income as a dividend buffer: Many BDCs generated more NII than they were allowed to distribute during the high-interest phase and accumulated this surplus. MSDL shows $0.82 per share in undistributed taxable income (UTI/spillover), CGBD $0.86 per share, TRIN $0.84 per share. This buffer can be used to support a dividend in weaker quarters, but not indefinitely, and should not be confused with sustained earnings strength.
(Source: Ares Capital Corporation Investor Presentation | Year Ended December 31, 2025)
Understanding basic vs. special dividends correctly
This point deserves special attention and is therefore very important to me, because the current earnings season in particular shows how important the dividend structure is for the flexibility of a BDC.
In the high-interest phase from 2022 to 2024, smart BDC managers did not simply include their NII surplus in the basic dividend, but distributed it via supplementary dividends, i.e. special dividends. The advantage is obvious. The basic dividend remains conservative, while the special dividend can be reduced or canceled without major reputational damage if the NII falls. BDCs that have taken this route now have more leeway.
However, there are currently signs of a change in this regard. Hercules Capital has announced supplemental dividends of at least $0.28 per share for 2026, spread over four quarters of $0.07 each, plus a base dividend of $0.40, resulting in a total of $0.47 per share in the first quarter of 2026. TSLX maintains its base dividend of $0.46 and pays $0.01 on top, totaling $0.47. Both BDCs clearly communicate that the base (dividend) is stable, but everything else depends on the earnings situation.
PennantPark Investment Corp (TWS ticker: PNNT, ISIN: US70882L1052), on the other hand, has formally lowered its regular base dividend to bring it in line with actual earnings expectations. This is painful for shareholders who had (wrongly) factored in the high yield as permanent, but also shows that management is communicating more honestly than those who artificially prop up the coverage ratio through PIK income or spillover use.
Golub Capital BDC (TWS ticker: GBDC, ISIN: US38173M1027) has also cut its dividend, which, after an initial market overreaction, is seen as a positive signal in the medium term because the new dividend is now covered in real terms (by net investment income).
The most important rule of thumb is that a BDC that has aggressively increased its base dividend in good times and is now defending it with coverage ratios just below 1.0× is more problematic to value in the long term than a BDC that keeps the base conservative and pays generous special dividends, which it is gradually reducing in the current phase.
Focus on four BDCs
The rock in the surf
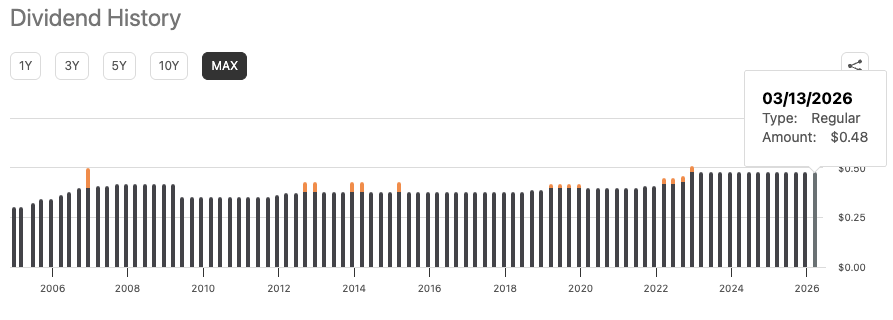
Ares Capital is by far the largest and most proven BDC in the market with a portfolio of almost $30 billion and 603 portfolio companies. The company has survived the financial crisis, COVID and interest rate reversal without a dividend cut, which according to its own earnings call now means 16 years of stable or growing regular dividends. In Q4 2025, ARCC closed above its own best-case projections with a dividend cover of 108 %, a confirmed base dividend of $0.48, a PIK ratio down from 7.5 % to 6.8 % and 1.07× debt (net, with $638 million cash). Non-accruals increased slightly from 1.0 % to 1.2 % of fair value due to new portfolio additions such as Teasdale Foods and Pluralsight, which a portfolio of 603 companies can absorb well. In the current Q1 2026 alone, ARCC has already entered into $1.4 billion in new commitments, of which 90 % are first liens. The Board has also extended the share buyback program with a volume of $1 billion until February 2027, which is a further sign of confidence in its own portfolio.
The underestimated challenger
MSDL is due in 2023 per IPO went public and is still overlooked by many income investors, wrongly in my opinion. 96.3 % of the portfolio in first-lien positions, 218 portfolio companies in 33 sectors, average weighting of only 0.5 % of fair value, non-accruals at only 0.6 %, PIK share of only 3.9 % and a spillover of $0.82 per share as a dividend buffer. Management is keeping the quarterly dividend at $0.50 and recently stated that even if the Fed were to cut interest rates by 100 basis points, the dividend would (still) be covered by 92 %, with the remainder being compensated by higher leverage (target: 1.15 to 1.20×). MSDL has also closed its first CLO of around $401m at SOFR + 1.70 % and repriced the BNP facility from 2.25 % to 1.95 %, both of which lower refinancing costs and support the margin.
The Q4-2025 results will be published on February 26, 2026. If these are strong, the price targets are likely to be raised again to previous levels. Until then, MSDL is considered an extremely interesting candidate.
Higher return with manageable risk?
Carlyle Secured Lending is of interest to yield-hungry investors who are prepared to accept a little more volatility. The First-Lien portion was increased from 72 % to 86 %, the Diversification The average individual exposure is 0.6 %. The regular quarterly dividend of $0.40 is sustainable at a debt-to-equity of 1.0 to 1.20×, even if interest rates were to fall by 100 basis points. The management itself stated that it expects earnings to be low in the next few quarters, primarily due to the SOFR curve, but expects rising earnings from the MMCF joint venture vehicle from the second half of 2026, which currently generates a return on assets of % and still has significant growth potential. The spillover of $0.86 per share is sufficient for more than two full quarterly dividends. The PIK ratio of 9.7 % is the only warning signal to keep an eye on.
Prime example of high yield ≠ Bargain
FS KKR Capital (TWS ticker: FSK, ISIN: US3026352068) is one of the largest BDCs with a portfolio of over $15 billion and an example of how a high NAV discount often does not reflect value but a justified risk premium. The software exposure of 17.1 % is not dramatic per se, but the combination of rising non-accruals, an uncapped dividend in Q2 2025 and a PIK share of over 8 % is problematic. 48Forty Solutions (Alpine Acquisition), a pallet logistics company, had over $190m in FSK's loan book alone and was written down to 49 % of book value in Q2 2025, resulting in a NAV decline of 6.2 % in that quarter. A dividend reduction is expected for Q4 2025, which is expected to be announced at the earnings on February 25, 2026.
Bonus BDC: the growing niche player
TRIN differs from traditional middle-market BDCs in its focus on equipment finance and venture lending for high-growth companies. In the fourth quarter of 2025, Trinity Capital's net investment income (NII) of an estimated $0.51 to $0.53 per share was only just above the base dividend of $0.51. Despite this low profit margin, the portfolio is hedged against falling interest rates. Contractually fixed interest rate floors ensure that income remains stable even if the US Federal Reserve lowers key interest rates further. The company still expects 108 % coverage in the event of an interest rate cut of 200 basis points. Non-accruals improved to 0.7 % (fair value). Moody's awarded a Baa3 investment grade rating in May 2025, which opens up access to more favorable debt capital. The spillover of $0.84/share provides a buffer and management indicated in an earlier earnings call that special dividends will have to be paid out of this cushion sooner or later:
if we are successful doing what I just said, we're going to be forced to send out special dividends at some point.
Options trading
I myself work mainly as a Style holder active, i.e. on the side of the option seller, and naturally also look for interesting setups in BDCs. The average RSI in the BDC sector signals oversold levels, which theoretically opens up short put opportunities. However, BDC option spreads are often elevated and the market environment remains volatile.
Those who already hold positions can Covered calls collect additional premiums on ARCC or MSDL and continue to collect the current dividend. Who over Short Puts in MSDL, with the aim of selling below the current market price. Carrying amount could find interesting levels if the Q4-2025 results on February 26 are solid.
Conclusion
Panic selling creates opportunities, but only for the informed! The software crash does not affect all BDCs equally, as the current earnings season clearly shows. The management feedback is clear. The credit quality in software portfolios has been stable so far, and the equity revaluations primarily affect the sponsors, not the lenders. Investors who are familiar with non-accruals, PIK share, coverage structure and spillover cushions and can differentiate between basic and special dividends will find interesting opportunities in the current sell-off. On the other hand, those who only Payout ratios If you don't take a closer look, you risk falling into a dividend trap, as FSK impressively demonstrates.
The key question is therefore not: „Which BDC pays the most?" Rather: „Which BDC can maintain its dividend most credibly, even if interest rates continue to fall and individual software companies in the portfolio come under pressure?" ARCC, MSDL and TRIN currently provide much better answers to this question than FSK and some other BDCs threatened by dividend cuts.