Your Broker for worldwide trading

DAX

The DAX (Deutscher Aktienindex) is a major stock index that reflects the 40 largest and most liquid companies listed on the Frankfurt Stock Exchange. It serves as a barometer for the German economy and comprises leading companies from various sectors that represent Germany's economic strength.

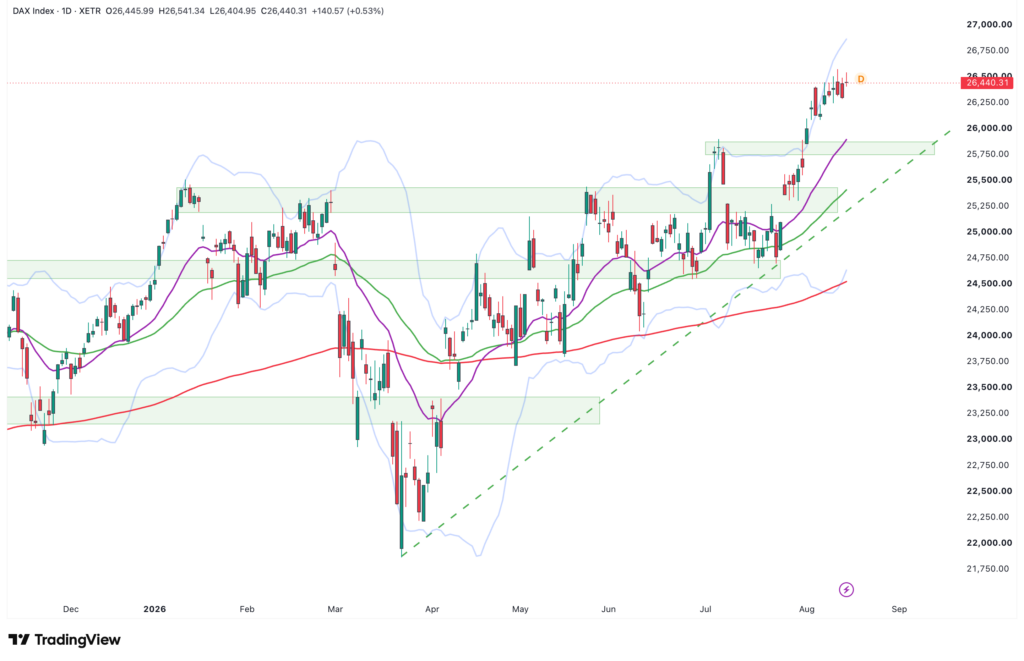
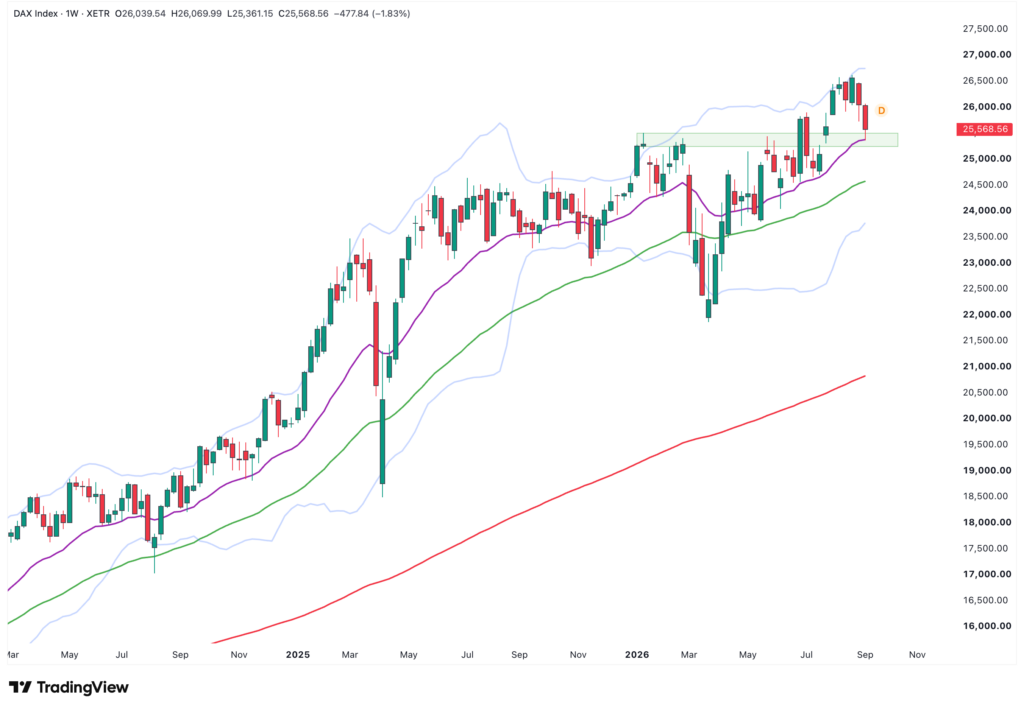
Dear traders, dear stock market friends. After the recent all-time high at the beginning of July, last trading week saw the DAX's record-breaking run take a palpable...
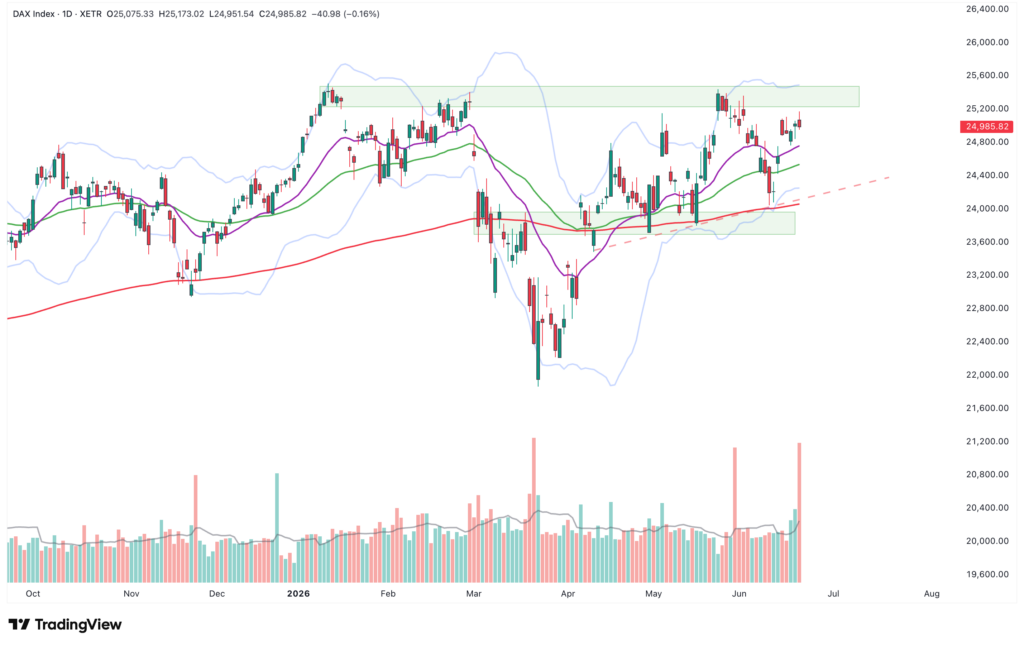
Dear traders, dear stock market friends. The DAX has had a friendly, but by no means euphoric, trading week. After a strong start to the week on...
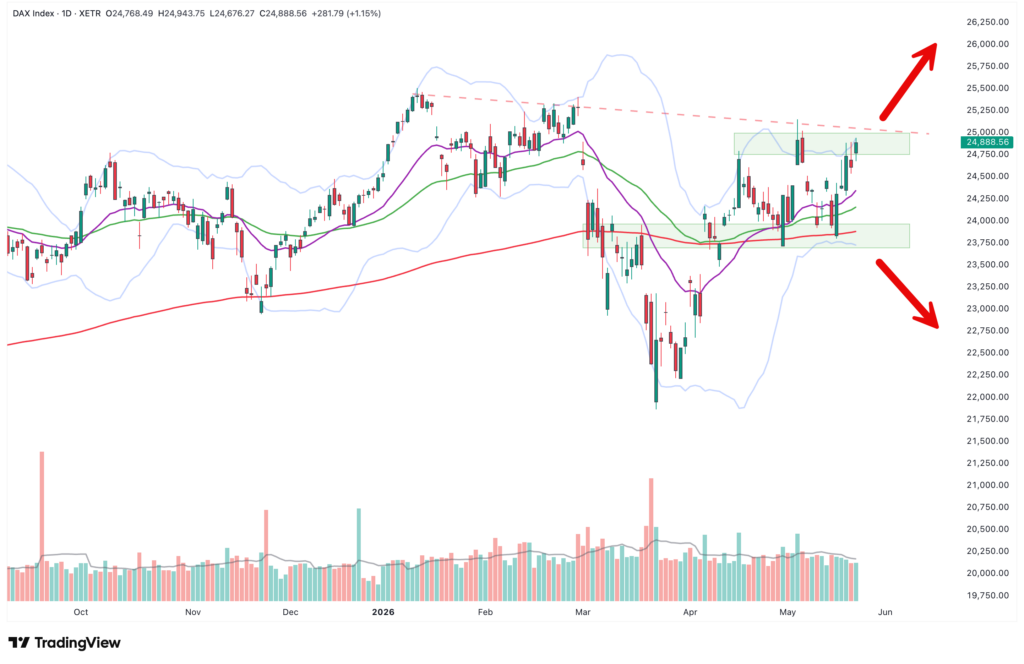
Dear traders, dear stock market friends. The DAX ended the past trading week with a gain of 3.9 percent. The main driver was signals of easing tensions in...
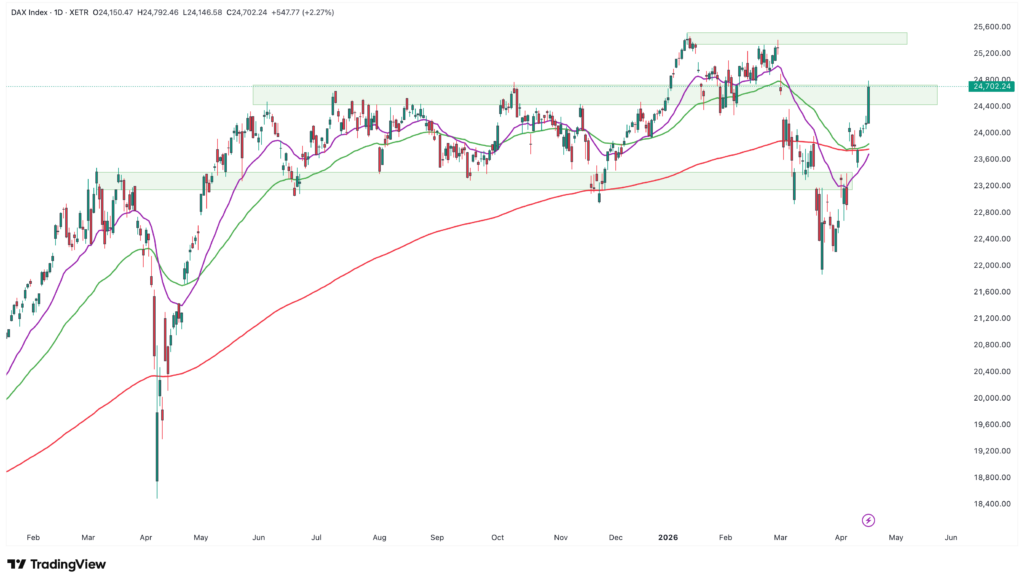
Line chart of the DAX 30 index with 50, 100, and 200-day moving averages, highlighted resistance and support zones from May 2023 to May 2024, and available as an auto-saved draft.

Dear traders, dear stock market friends. After the DAX initially came under renewed pressure at the beginning of the past trading week, it followed before the...
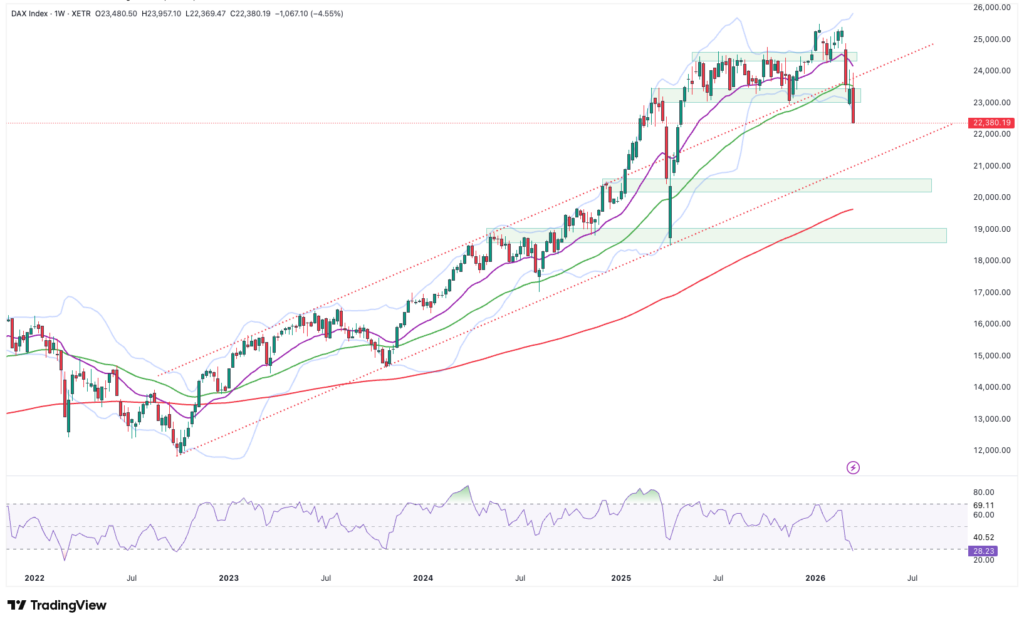
Line chart of the DAX index from 2022 to 2024 with moving averages, Bollinger Bands, and highlighted support zones; recent price decline below trendline and important moving averages - auto-saved draft.

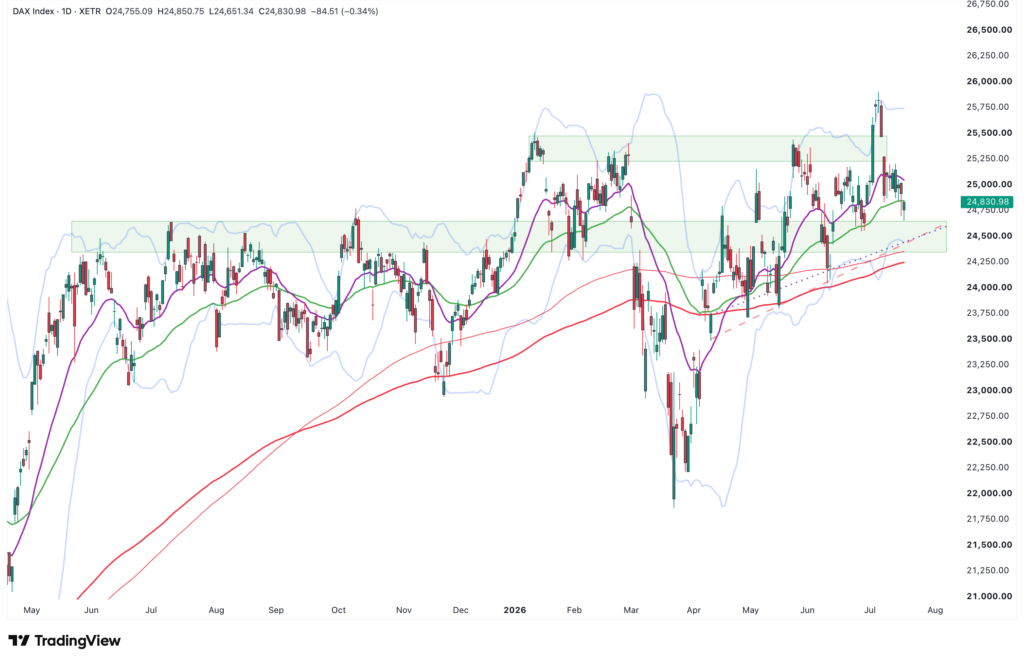
Dear traders, dear stock market friends. The DAX came under pressure again last trading week and closed the week at...
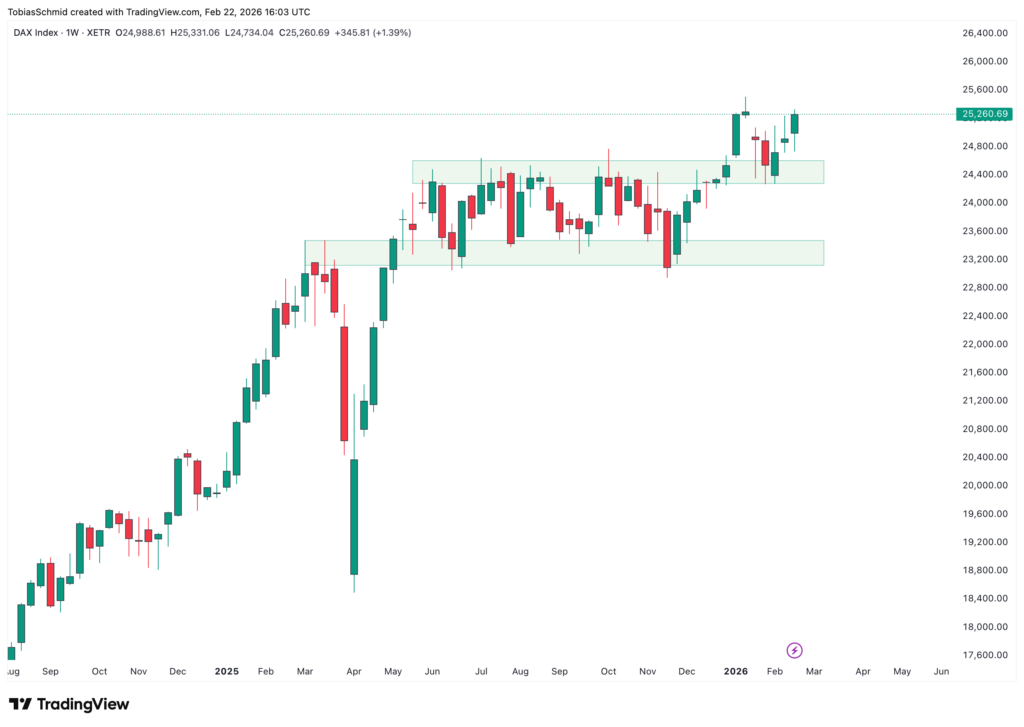
A candlestick chart shows that the DAX index is rising, with support zones highlighted and a new high near 25,000 reached in early 2024.

Dear traders, dear stock market friends. After the DAX defended the support zone at 24,500 points, the German benchmark index continued its upward trend in the...
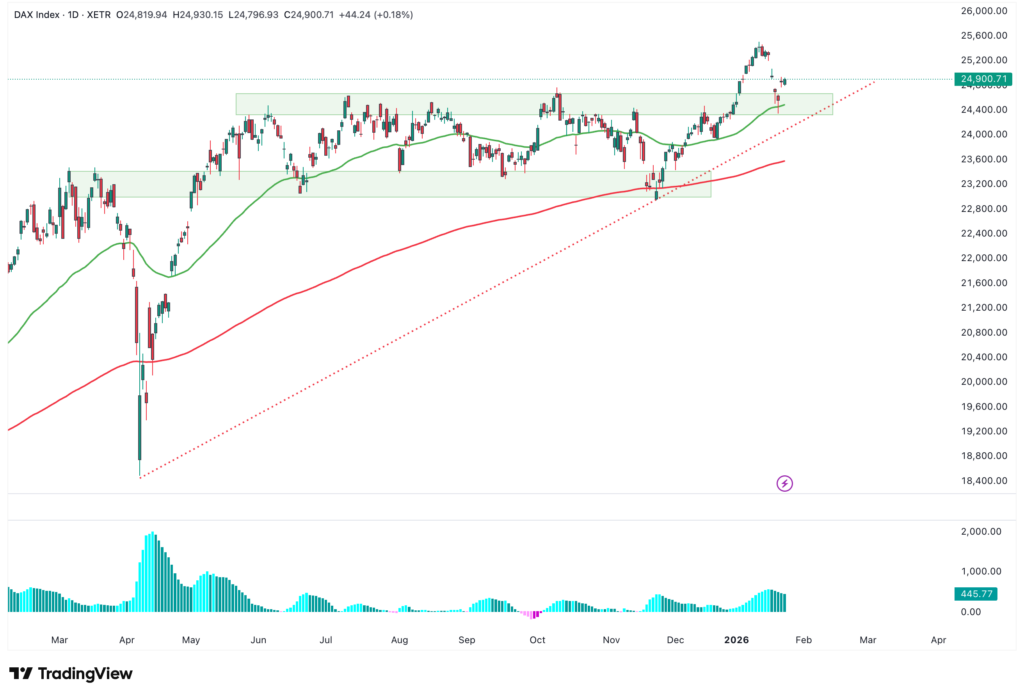
Line chart of the DAX index with price movements, moving averages, support zones and volume bars from May 2023 to February 2024 on a TradingView platform. Automatically saved draft is displayed for your analysis sessions.

Dear traders, dear stock market friends. After a strong start to the year, the DAX came under noticeable pressure in the past trading week. Not because of...

A candlestick chart shows the DAX index with Bollinger bands, moving averages and shaded support and resistance zones, which illustrate a possible breakout of the price movement from March to December 2023.

Dear traders, dear stock market friends. The DAX, Germany's leading index, has been trading in a range between around 23,100 and...

A DAX index candlestick chart with moving averages, Bollinger Bands, RSI indicator and highlighted support and resistance zones captures the dynamics of the year-end rally from the end of 2020 to the end of 2021.

Dear traders, dear stock market friends. The DAX went into the weekend on Friday with a closing price of 23,837 points, which corresponds...

A DAX candlestick chart shows the price movements with Bollinger bands, moving averages and the RSI indicator and illustrates the consolidation towards the middle of 2025.

Dear traders, dear stock market friends. While the US stock indices reached record highs again last week, the DAX is still in a downward spiral.

Email:

info@captrader.com

Send e-mail

Phone:

Hotline (Germany)
0800-8723370

Hotline (International)
00800-08723370

Further contact options