Your Broker for worldwide trading

DAX

The DAX (Deutscher Aktienindex) is a major stock index that reflects the 40 largest and most liquid companies listed on the Frankfurt Stock Exchange. It serves as a barometer for the German economy and comprises leading companies from various sectors that represent Germany's economic strength.
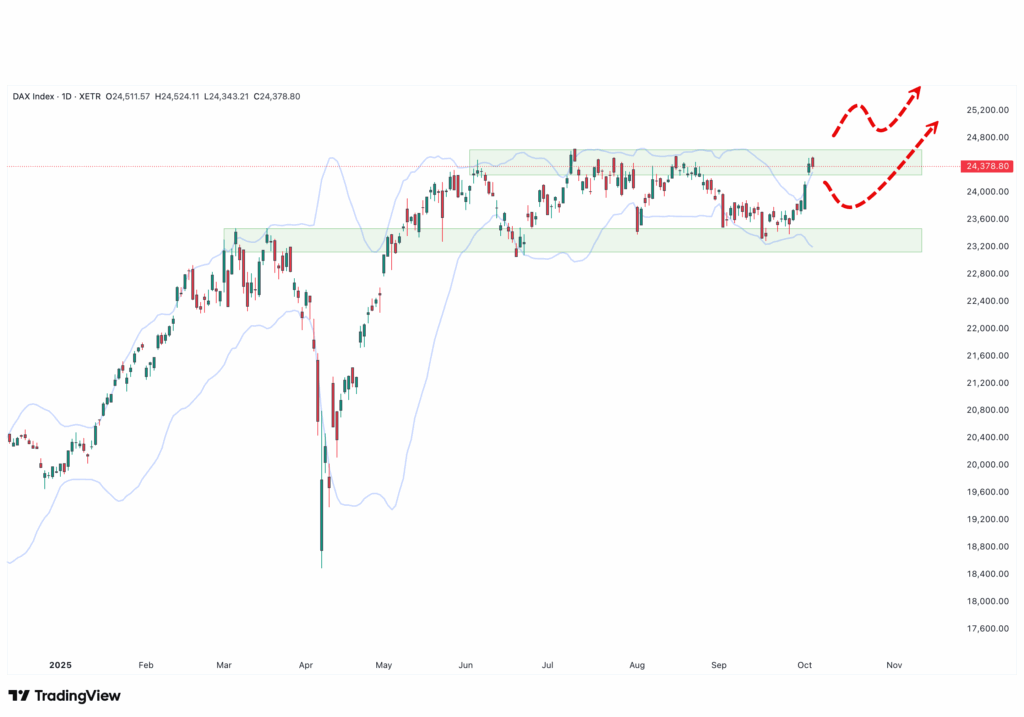
A candlestick chart of the DAX index with two red dashed lines indicating possible breakout paths; Bollinger bands and support/resistance zones are shown for detailed DAX analysis.

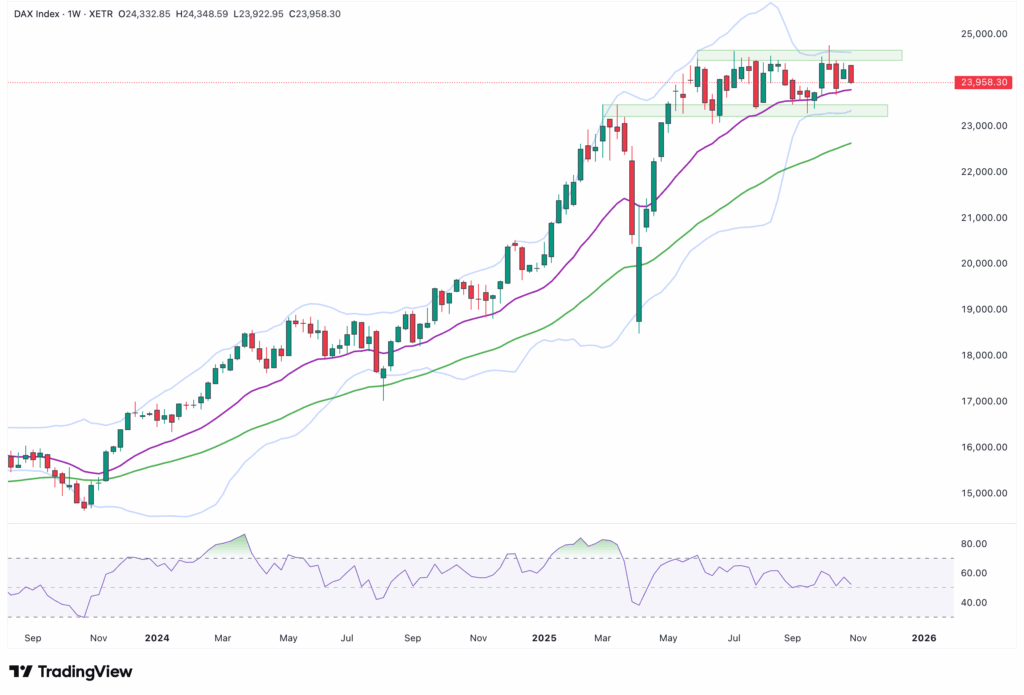
Dear traders, dear stock market friends. With a weekly performance of 2.7 %, the DAX once again showed strength in the past trading week and...
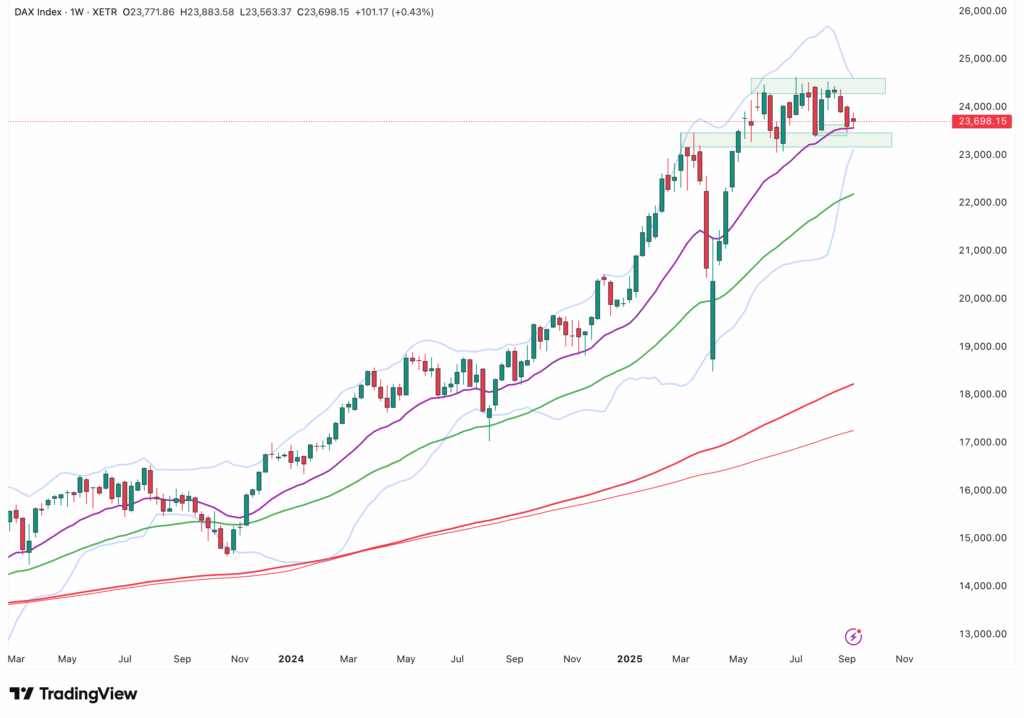
A candlestick chart of the DAX index showing the price movement from the end of 2022 to mid-2025 with Bollinger bands, moving averages and a highlighted consolidation range, based on an automatically saved draft.

Dear traders, dear stock market friends. While the US stock indices made headlines last week with new all-time highs, the US stock market is currently...
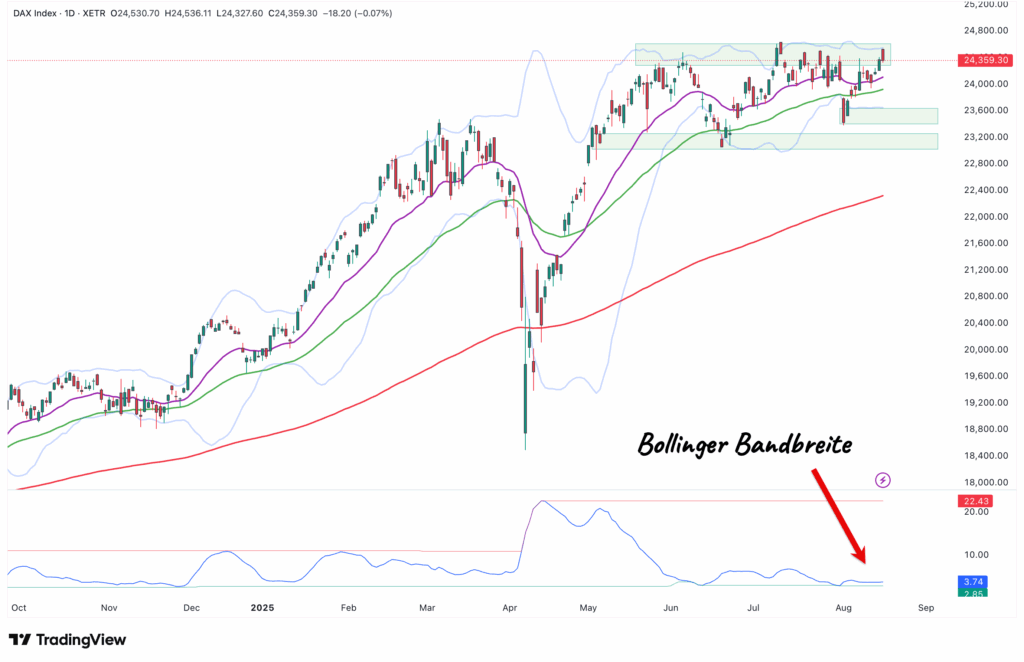
A candlestick chart of the DAX index with moving averages, Bollinger bands, highlighted price ranges and a Bollinger bandwidth indicator at the bottom marked by a red arrow.

Dear traders, dear stock market friends. After a brief breather at the beginning of August, the DAX has regained significant momentum in recent days.
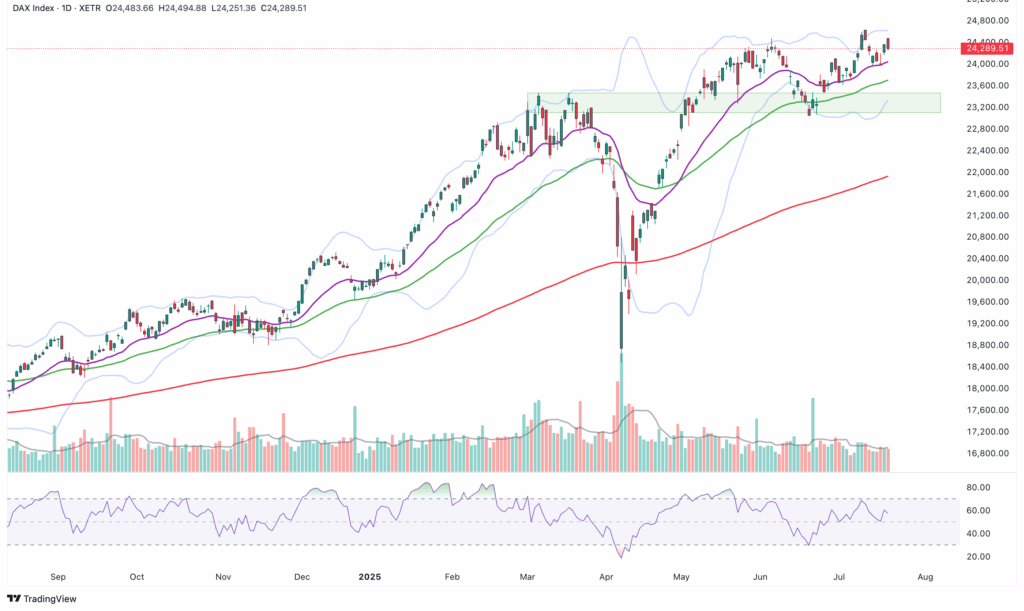
Share price chart with candles, moving averages, Bollinger Bands and volume bars; shows an upward trend with recent consolidation and relative strength index at the bottom.

Dear traders, dear stock market friends. The German share index DAX is currently still trading stably above the 24,000-point mark, close to its all-time high,...
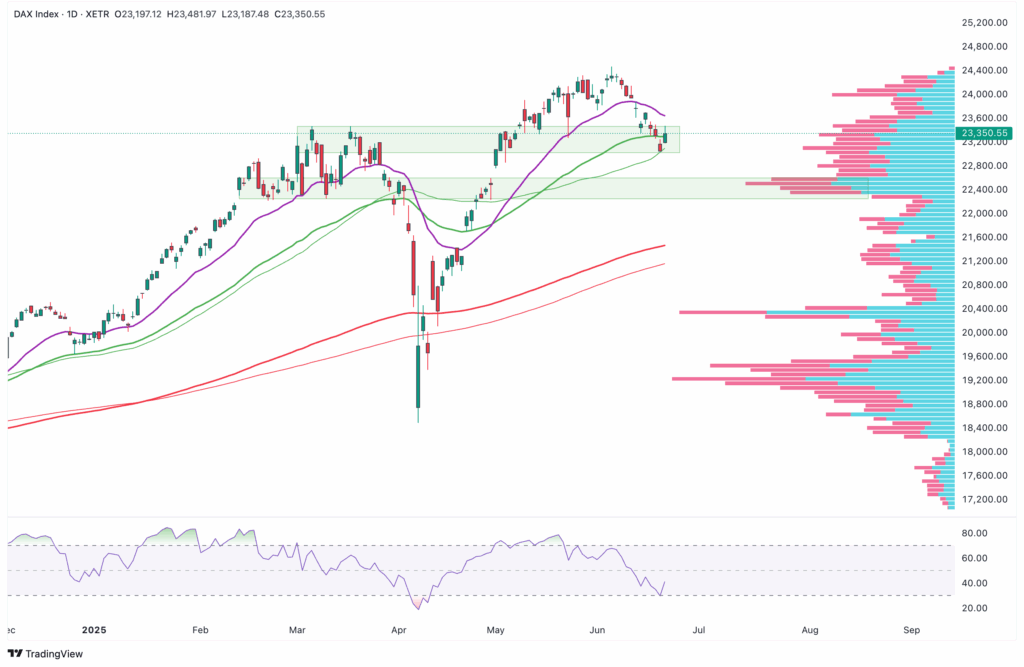
A stock chart of the DAX index with candles, moving averages, volume profile on the right and RSI indicator at the bottom, for the period from the end of 2024 to mid-2025.

Dear traders, dear stock market friends. The DAX continued its correction in the last trading week and ended the week with a...
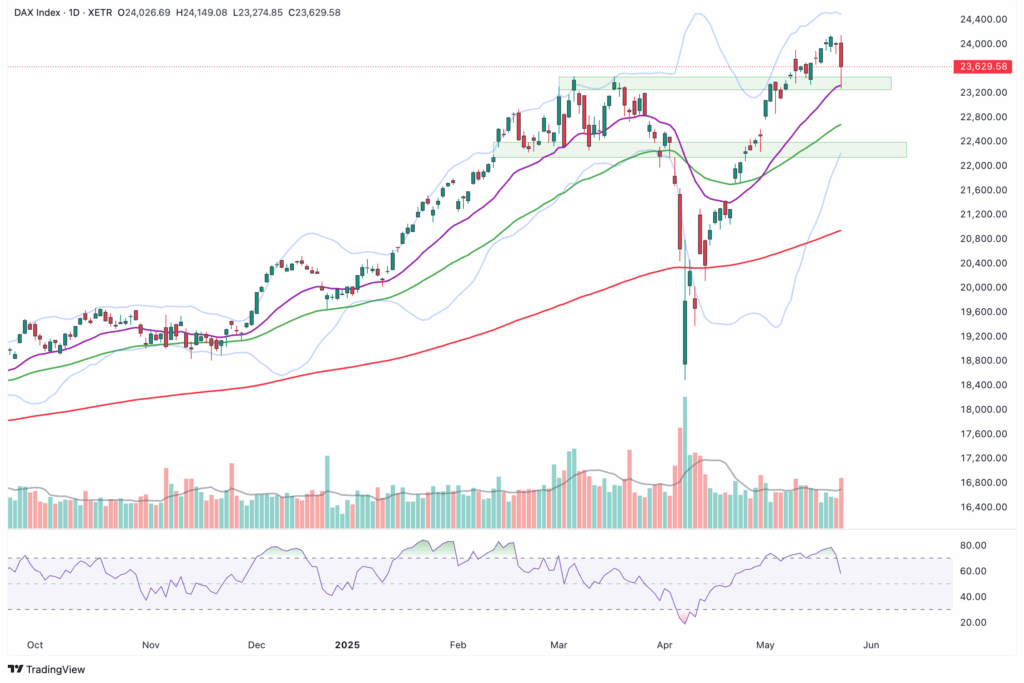
Candlestick chart showing the price movement of the DAX index with moving averages, Bollinger bands, support zones, volume bars and the RSI indicator below from October 2024 to June 2025.

Dear traders, dear stock market friends. Last Wednesday, May 21, the DAX reached a new high with a closing price of 24,122 points.

A weekly candlestick chart of the DAX index showing price movements from 2022 to 2025 with three key support levels highlighted by yellow circles.

Dear traders, dear stock market friends. The DAX received a strong tailwind in the past trading week and gained 4.9 % compared to the previous week.
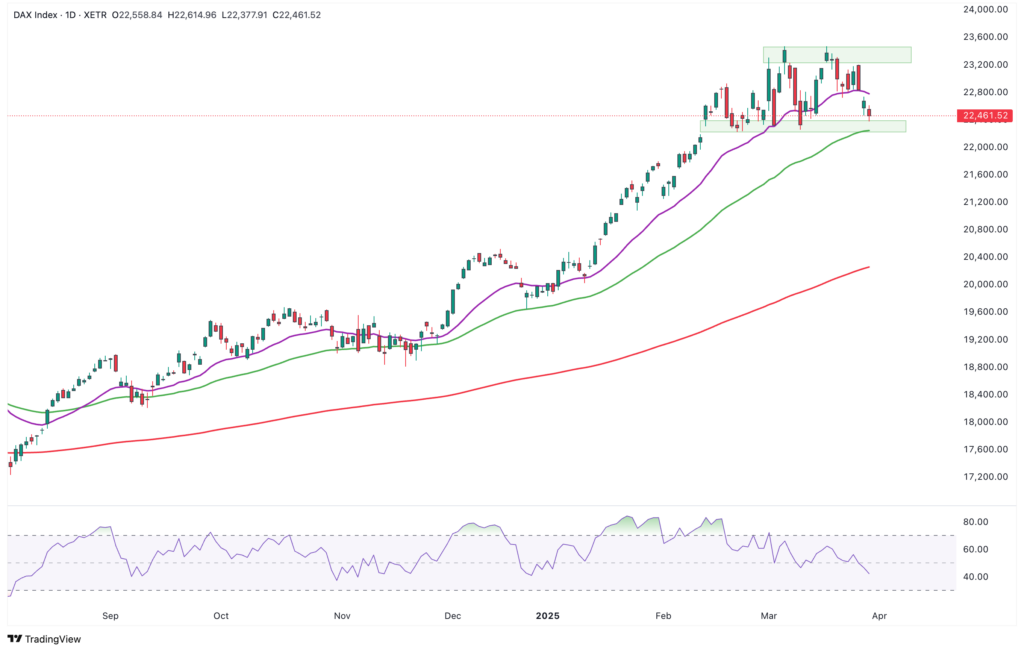
Stock chart with upward trend with two consolidation zones, moving averages and RSI indicator at the bottom.

Dear traders, dear stock market friends. After a cautiously optimistic start to the week, the German stock market slipped in the second half of last week's trading...

A DAX index chart showing an uptrend with support and resistance levels, highlighted zones and moving averages. The X-axis shows data from 2022 to 2025.

Dear traders, dear stock market friends. The DAX has only known one direction so far this year: upwards. Since the beginning of the year, the...

Line chart showing the upward trend of the DAX index from 2021 to 2025, with marked support and resistance levels, moving averages and the RSI indicator at the bottom.

Dear traders, dear stock market friends. The DAX ended the past trading week with a gain of 1.6 percent and closed on Friday...

Email:

info@captrader.com

Send e-mail

Phone:

Hotline (Germany)
0800-8723370

Hotline (International)
00800-08723370

Further contact options