Your Broker for worldwide trading

Index

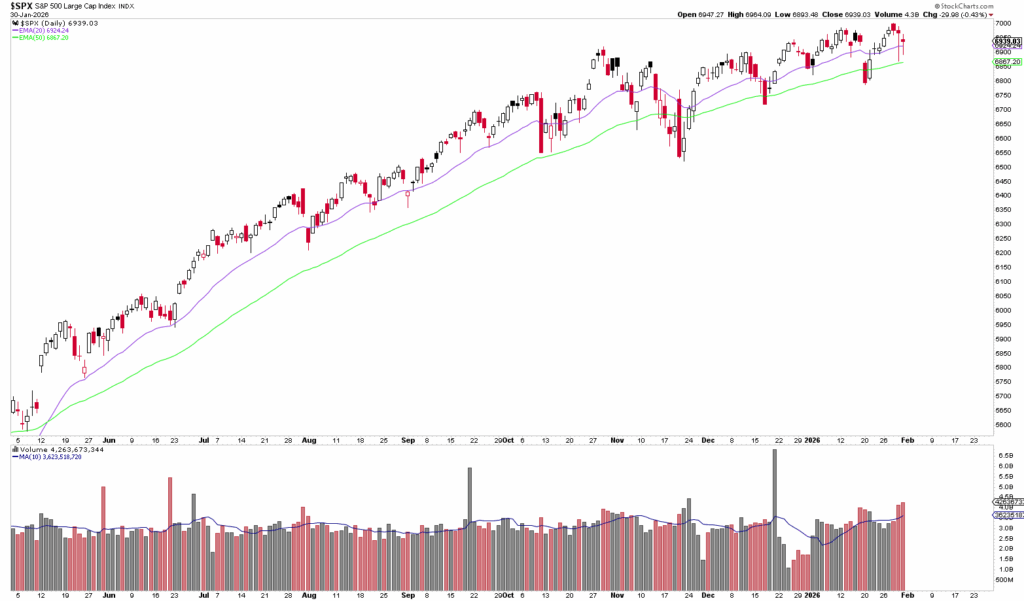
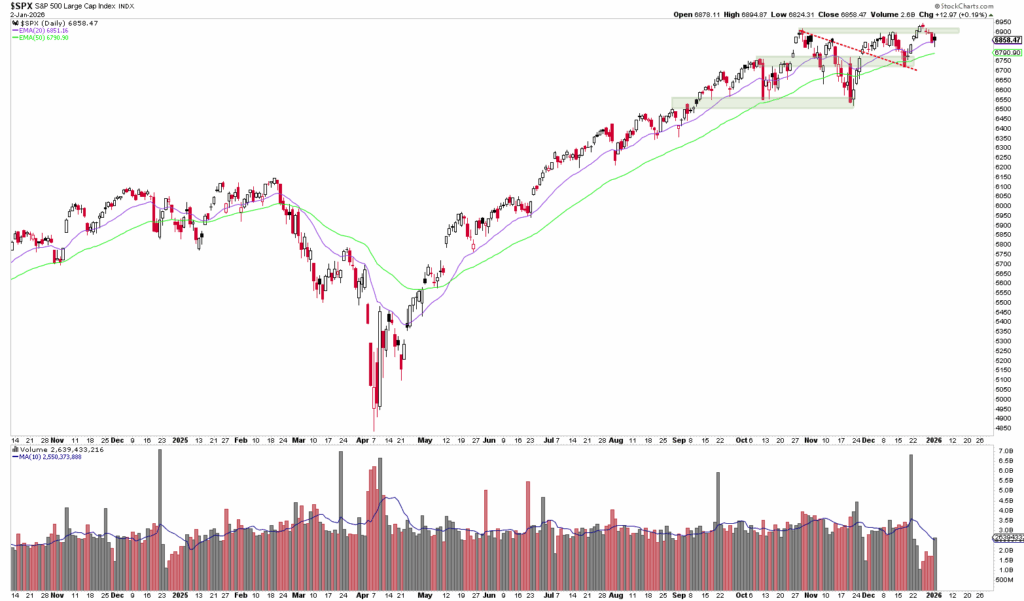
Line chart of S&P 500 price performance from January 2020 to January 2021 with trading volume bars and 20- and 50-day moving averages, highlighting the rise as a possible indicator of trends through 2026.

Dear traders, dear stock market friends. In the past trading week, the S&P 500 was still in vacation mode and trading volumes were extremely...

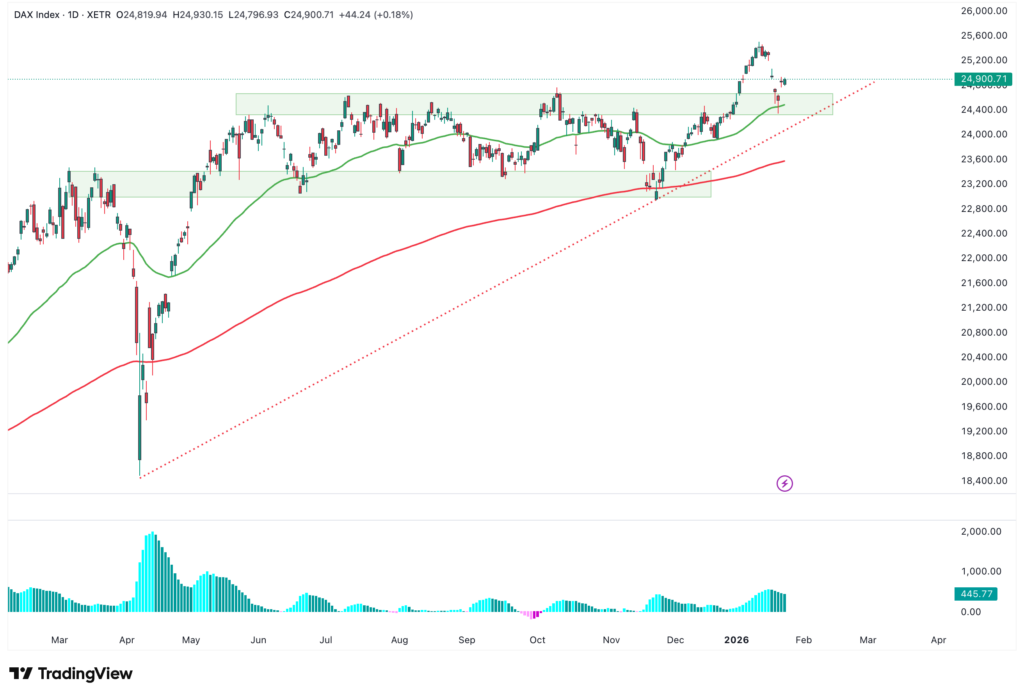
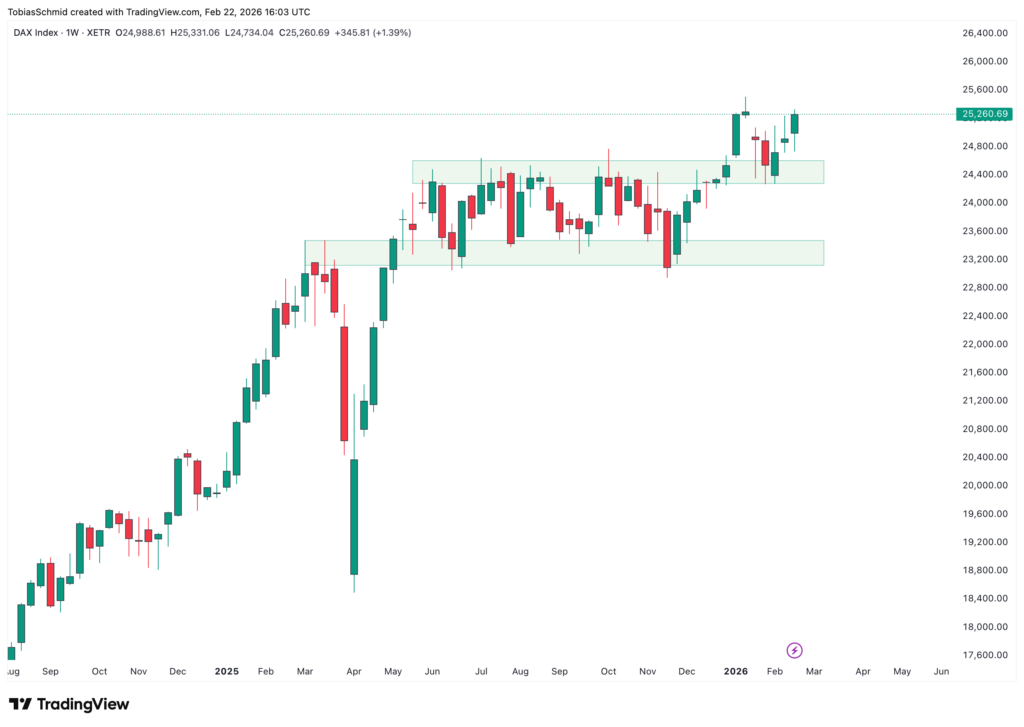
A candlestick chart shows the DAX index with Bollinger bands, moving averages and shaded support and resistance zones, which illustrate a possible breakout of the price movement from March to December 2023.

Dear traders, dear stock market friends. The DAX, Germany's leading index, has been trading in a range between around 23,100 and...
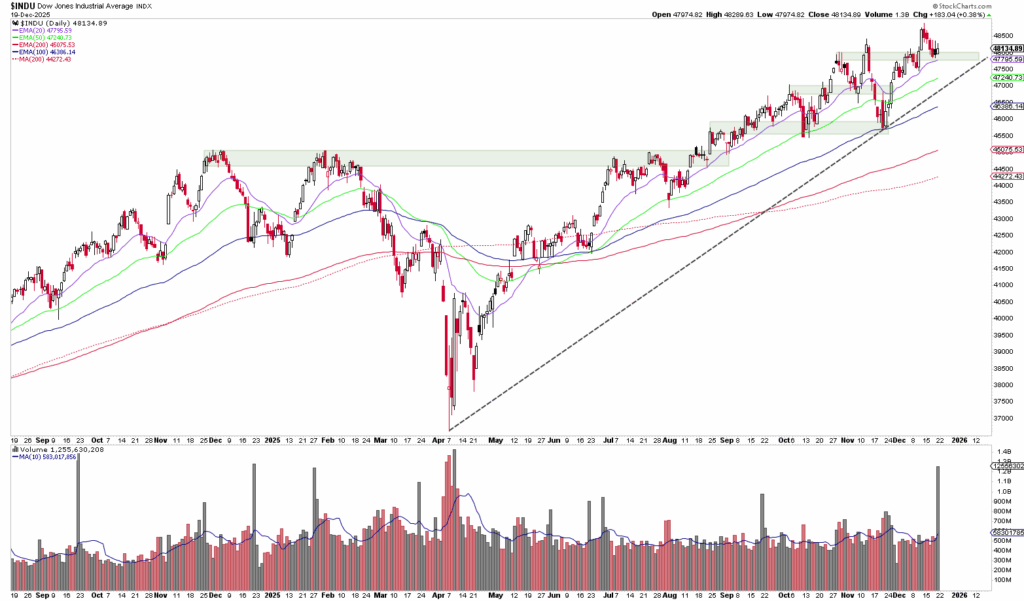
Line chart showing the price movement of the Dow Jones Industrial Average from August 2020 to December 2021, highlighting the periods when the index consolidates and reaches the record high, with multiple moving averages and volume bars below.

Dear traders, dear stock market friends. After the Dow Jones reached a new all-time high the week before last and peaked at...

Candlestick chart showing the price movements of the Nasdaq index over time with Bollinger bands, a 50-day moving average and highlighted support and resistance zones.

Dear traders, dear stock market friends. While the Dow Jones reached a new all-time high last week, the Nasdaq 100 came under pressure...

The candlestick chart of the S&P 500 Index shows the price development from June to December and highlights trend lines, moving averages, bullish support zones and volume bars - ideal for analysis before the next Fed meeting.

Dear traders, dear stock market friends. The past trading week was relatively quiet for the S&P 500, with the index closing Friday evening at...

A DAX index candlestick chart with moving averages, Bollinger Bands, RSI indicator and highlighted support and resistance zones captures the dynamics of the year-end rally from the end of 2020 to the end of 2021.

Dear traders, dear stock market friends. The DAX went into the weekend on Friday with a closing price of 23,837 points, which corresponds...

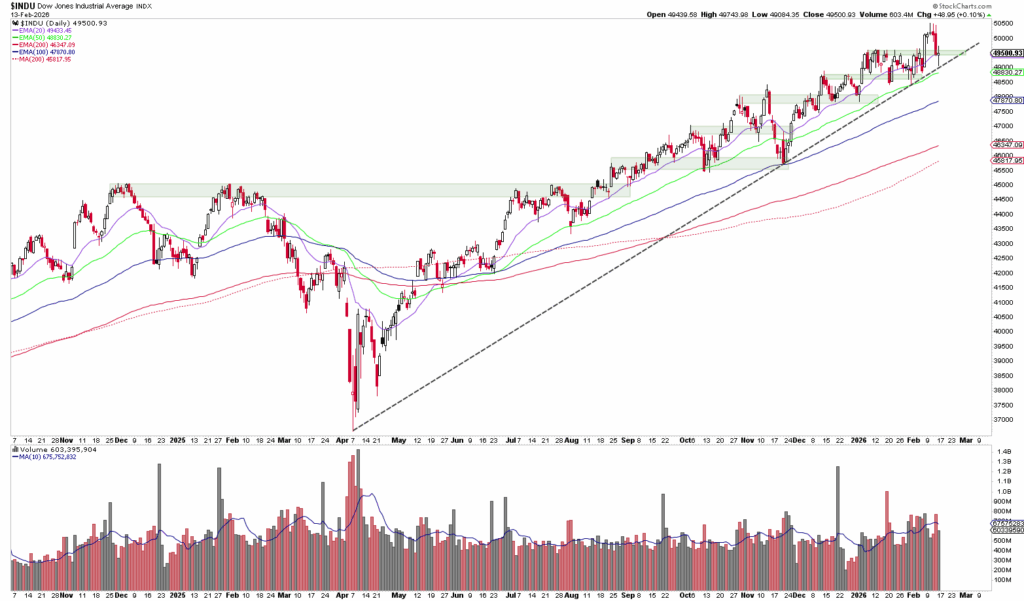
A daily candlestick chart of the Dow Jones Industrial Average that is great for analyzing price trends, moving averages, trading volume and down arrows.

Dear traders, dear stock market friends. The Dow Jones Industrial Average ended the week on Friday with a significant recovery, remaining on the...

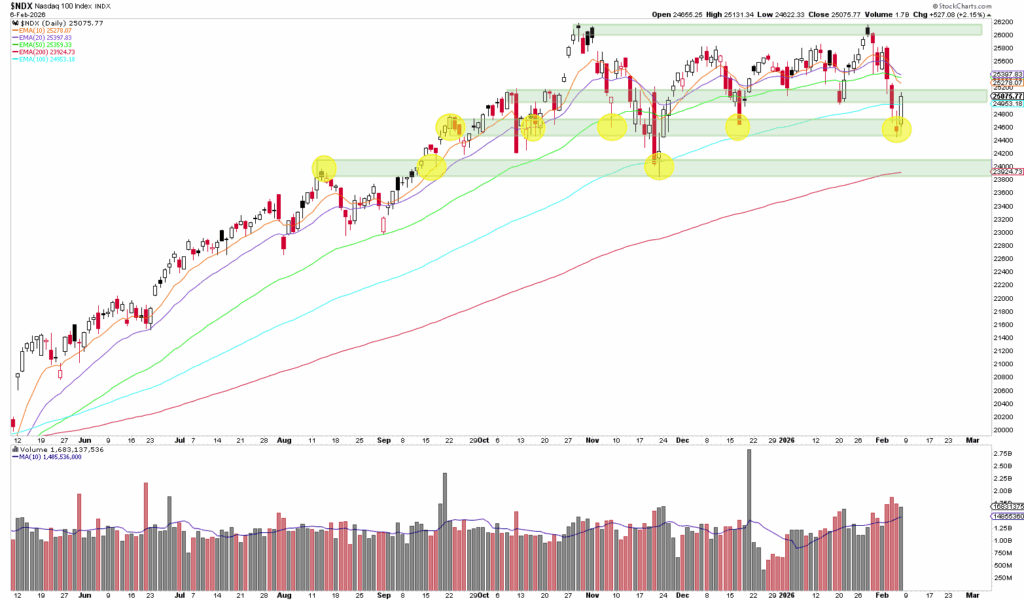
A price chart of the Nasdaq 100 with candles, a moving average line, shaded support zones and four red arrows indicating the bounce off important support levels near the 25,000 point mark during an uptrend.

Dear traders, dear stock market friends. The Nasdaq 100 ended the past trading week with a loss of 0.2 %, closing...

A candlestick chart of the S&P 500 Index with moving averages and volume bars showing price movement, trading volume and historical valuation from late June to early November.

Dear traders, dear stock market friends. The US stock markets came under significant downward pressure in the past trading week, which led to a decline in...

A DAX candlestick chart shows the price movements with Bollinger bands, moving averages and the RSI indicator and illustrates the consolidation towards the middle of 2025.

Dear traders, dear stock market friends. While the US stock indices reached record highs again last week, the DAX is still in a downward spiral.

Email:

info@captrader.com

Send e-mail

Phone:

Hotline (Germany)
0800-8723370

Hotline (International)
00800-08723370

Further contact options