Your Broker for worldwide trading

S&P 500

The S&P 500 is an American stock index comprising the 500 largest companies traded on US stock exchanges. It offers a broad spectrum of industries and is considered one of the best indicators of the overall performance of the US stock market, painting a diverse picture of the US economy.

Dear traders, dear stock market friends. The defensive sector rotation in the S&P 500 continued over the past two weeks. Cyclical stocks…
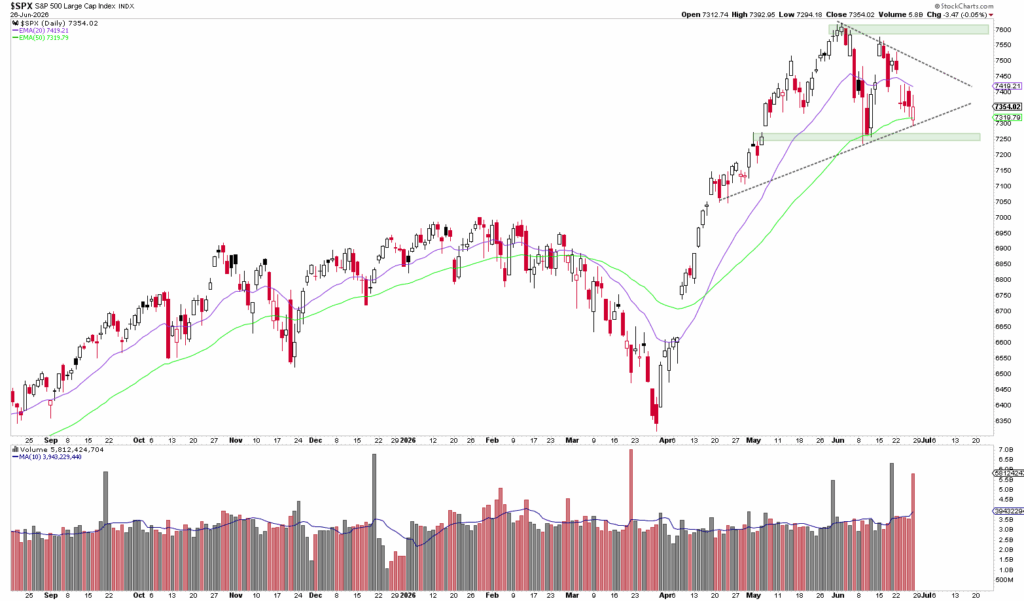
Dear traders and stock market enthusiasts. The S&P 500 continued its correction last trading week, losing about 2 %.…
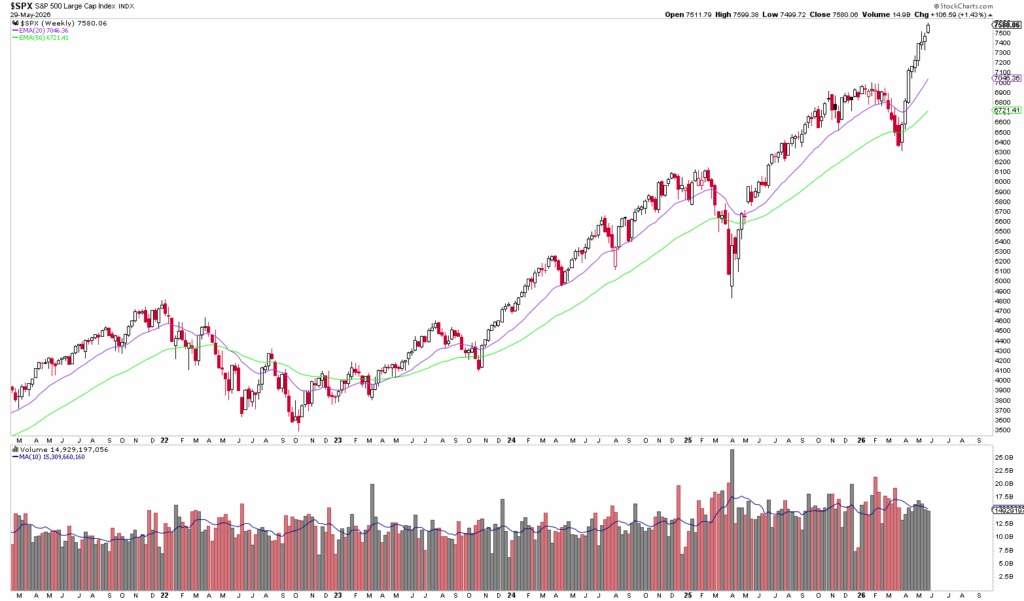
Dear traders, dear stock market friends. The S&P 500 ended the ninth consecutive week with a price gain and has now been...
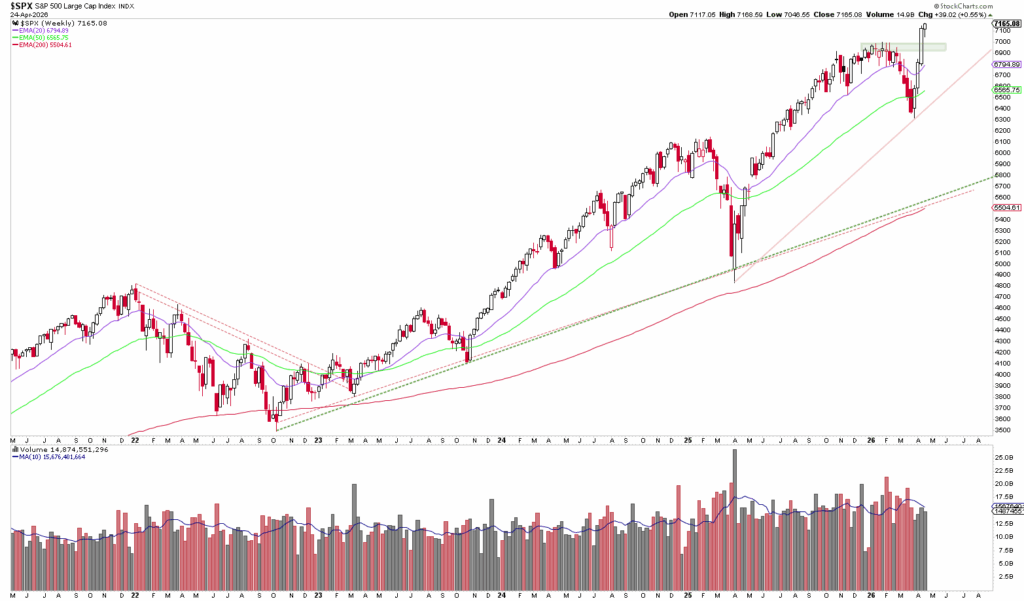
Line chart of the S&P 500 Index with moving averages and volume bars, showing an uptrend and strong upward potential as recent candles reach new highs.

Dear traders, dear stock market friends. With a gain of 0.55 percent, the S&P 500 ended the past trading week almost unchanged. In view of…
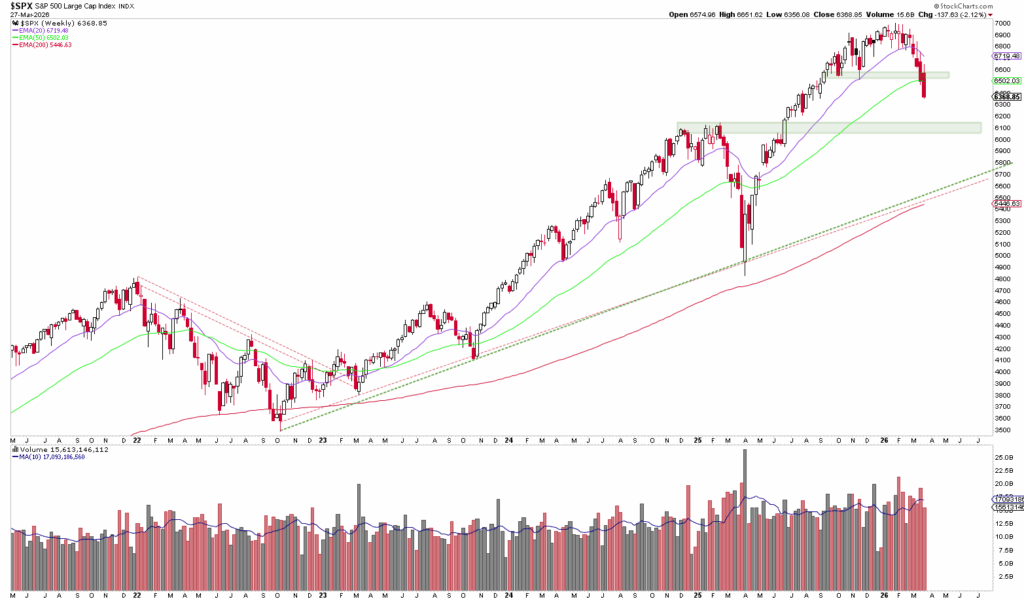
A candlestick chart of the S&P 500 Index from 2016 to mid-2022 with moving averages and trading volume bars shows the recent sharp decline marking a losing week on the stock market.

Dear traders, dear stock market friends. The S&P 500 ended the last trading week from March 23 to 27 with another negative...
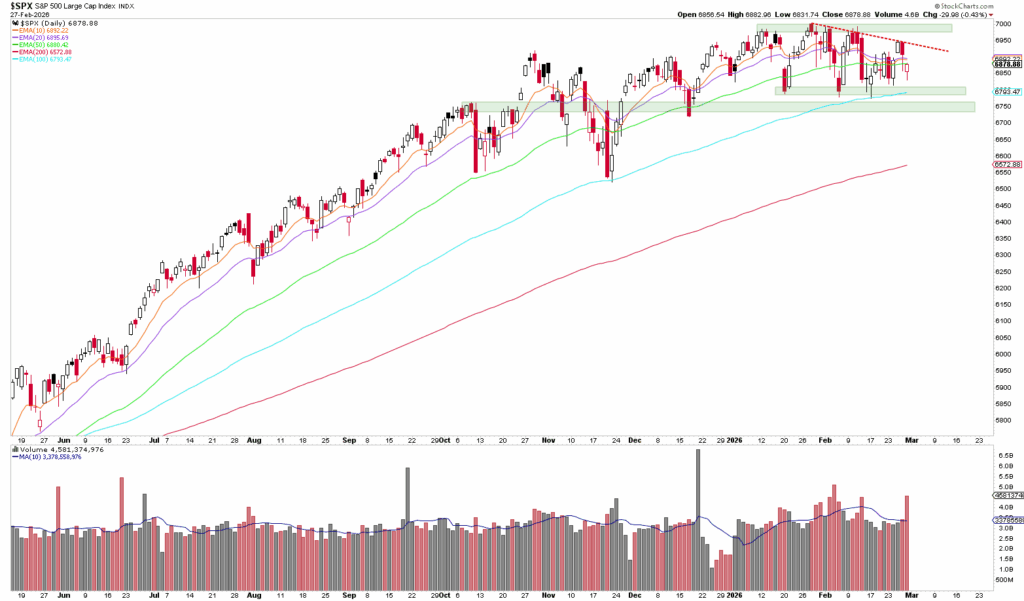
Stock chart of the S&P 500 Index from July 2023 to March 2024 with price candles, moving averages, volume bars, highlighted support and resistance zones and an automatically saved draft for tracking analysis drafts.

Dear traders, dear stock market friends. The attack by the USA and Israel on Iran at the weekend has had a...
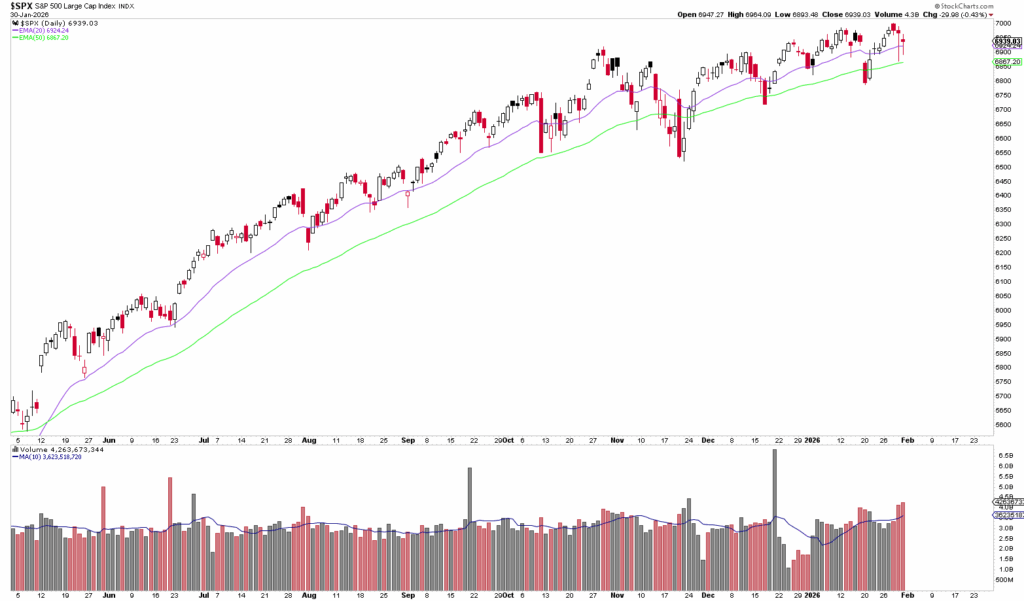
A stock chart shows the SPX price movement with candles, moving averages (20- and 50-day) and volume bars from June 2023 to January 2024, which is similar to an automatically saved draft of the market trends.

Dear traders, dear stock market friends. Last week, the S&P 500 rose above the 7,000-point mark for the first time in its history, albeit...
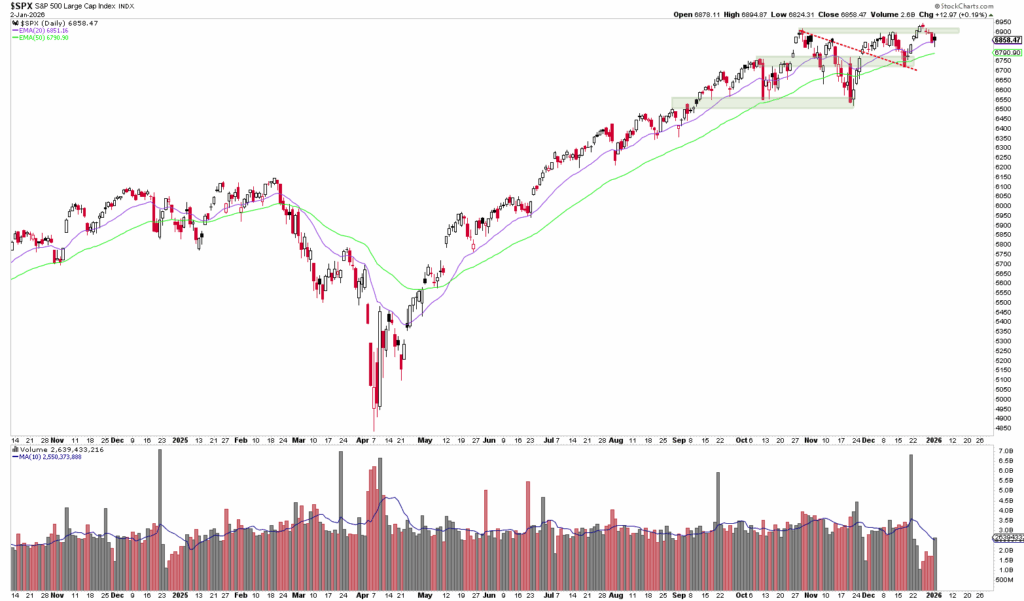
Line chart of S&P 500 price performance from January 2020 to January 2021 with trading volume bars and 20- and 50-day moving averages, highlighting the rise as a possible indicator of trends through 2026.

Dear traders, dear stock market friends. In the past trading week, the S&P 500 was still in vacation mode and trading volumes were extremely...

The candlestick chart of the S&P 500 Index shows the price development from June to December and highlights trend lines, moving averages, bullish support zones and volume bars - ideal for analysis before the next Fed meeting.

Dear traders, dear stock market friends. The past trading week was relatively quiet for the S&P 500, with the index closing Friday evening at...

A candlestick chart of the S&P 500 Index with moving averages and volume bars showing price movement, trading volume and historical valuation from late June to early November.

Dear traders, dear stock market friends. The US stock markets came under significant downward pressure in the past trading week, which led to a decline in...

Email:

info@captrader.com

Send e-mail

Phone:

Hotline (Germany)
0800-8723370

Hotline (International)
00800-08723370

Further contact options