Your Broker for worldwide trading

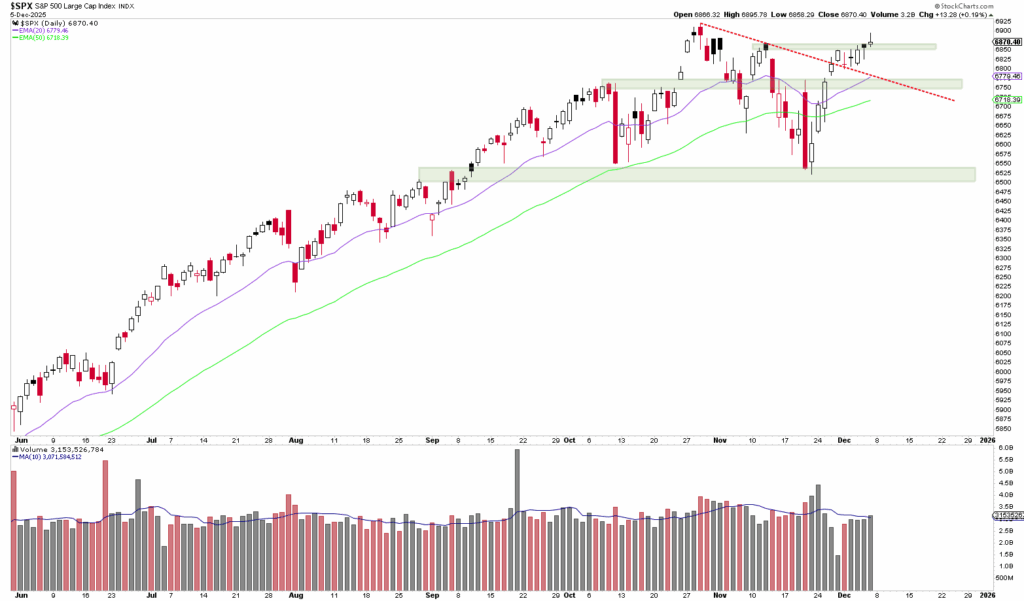
S&P 500

The S&P 500 is an American stock index comprising the 500 largest companies traded on US stock exchanges. It offers a broad spectrum of industries and is considered one of the best indicators of the overall performance of the US stock market, painting a diverse picture of the US economy.
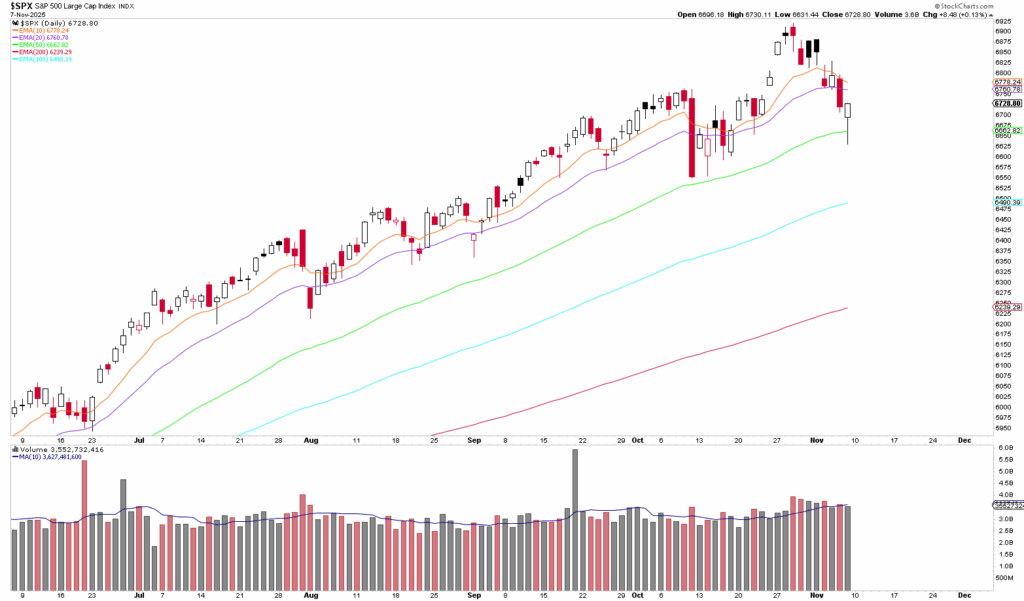
The candlestick chart of the S&P 500 Index shows a 21-day trading range followed by a sharp decline labeled "1 trading day" - a move that is often driven by fear and offers a potential TACO opportunity. Volume bars are shown below.

Dear traders, dear stock market friends. After the S&P 500 initially continued to rise in the past trading week and reached new all-time highs, the...
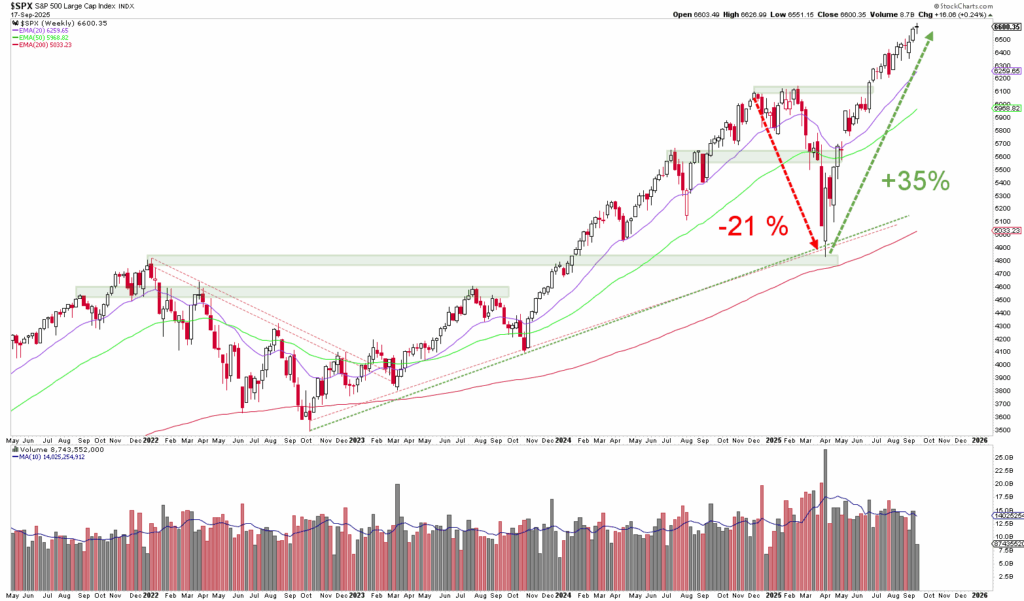
Monthly candlestick chart of the S&P 500 Index from 2014 to 2019, showing a decline of 21% followed by a rise of 35%; includes moving averages, trading volume bars and provides an exciting Q4 outlook.

Dear traders, dear stock market friends. The S&P 500 Index is in impressive shape at the end of the third quarter of 2025. Since...
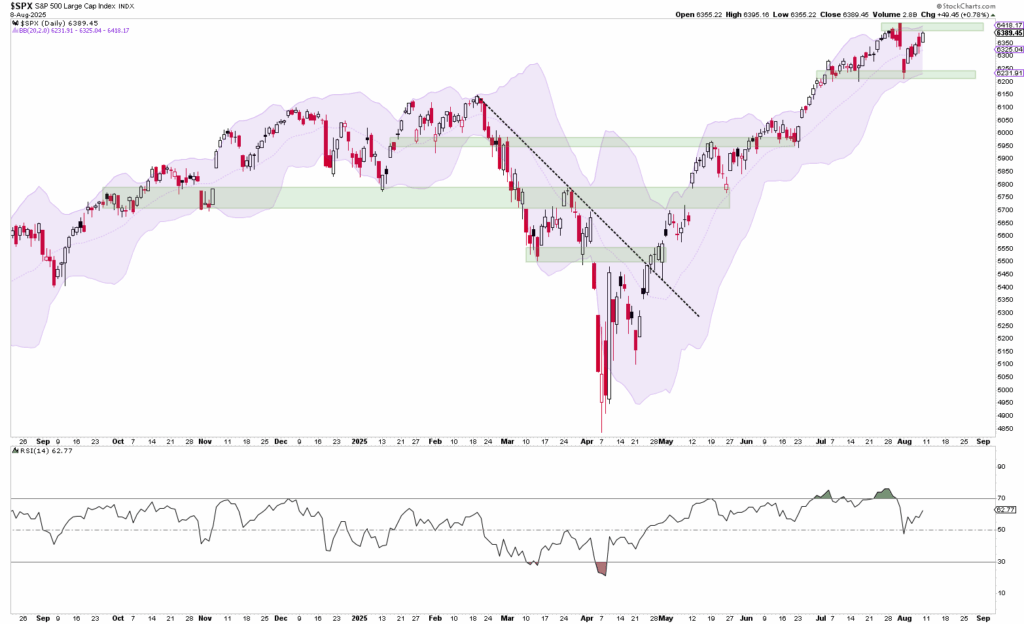
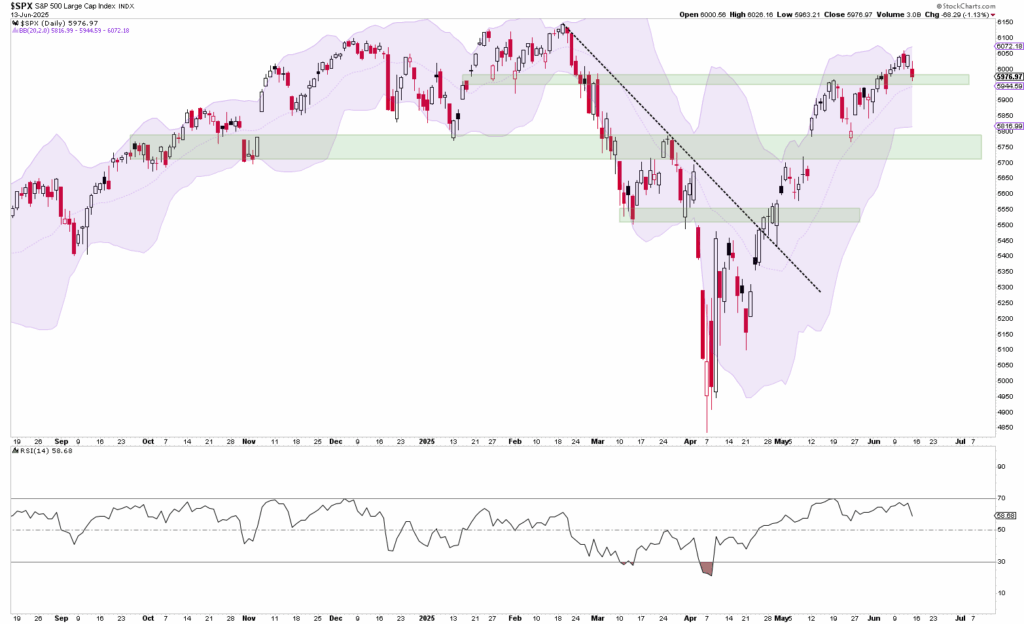
Line chart of the S&P 500 with Bollinger Bands, highlighted support/resistance zones, trend lines plotted and an RSI indicator plotted below.

Dear traders, dear stock market friends. The first week of August began volatile, but in the end brought a tailwind for the stock markets. The S&P...
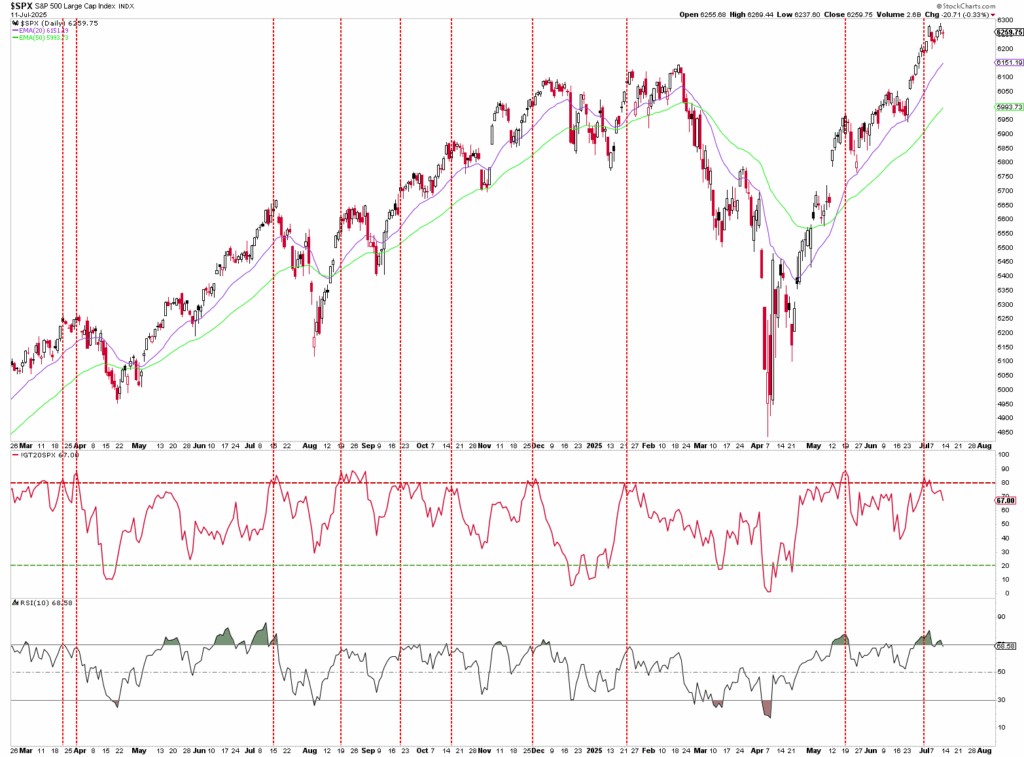
Line chart of the S&P 500 Index from March 2023 to June 2024 with moving averages, vertical red lines marking specific dates and two technical indicators displayed below the price chart.

Dear traders, dear stock market friends, With a weekly performance of -0.3 %, the S&P 500 ended a three-week period of...
A daily candlestick chart of the S&P 500 index shows price movements, support and resistance zones, Bollinger Bands and the RSI indicator below the main chart.

Dear traders, dear stock market friends. The topics that we traders and investors usually deal with are technical analysis, intermarket...
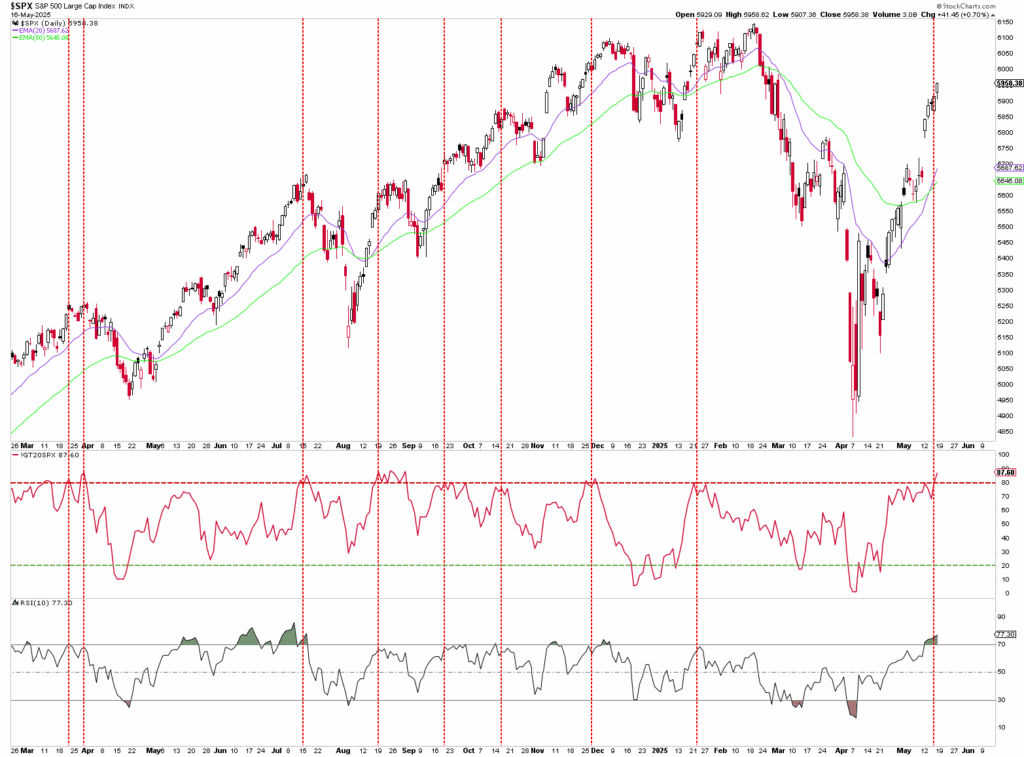
Line chart showing the price movements of the S&P 500 index over one year with moving averages, RSI and MACD indicators, marked by several vertical dashed red lines.

Dear traders, dear stock market friends. Over the past seven weeks we have seen some historic price movements in the S&P 500. After the massive...
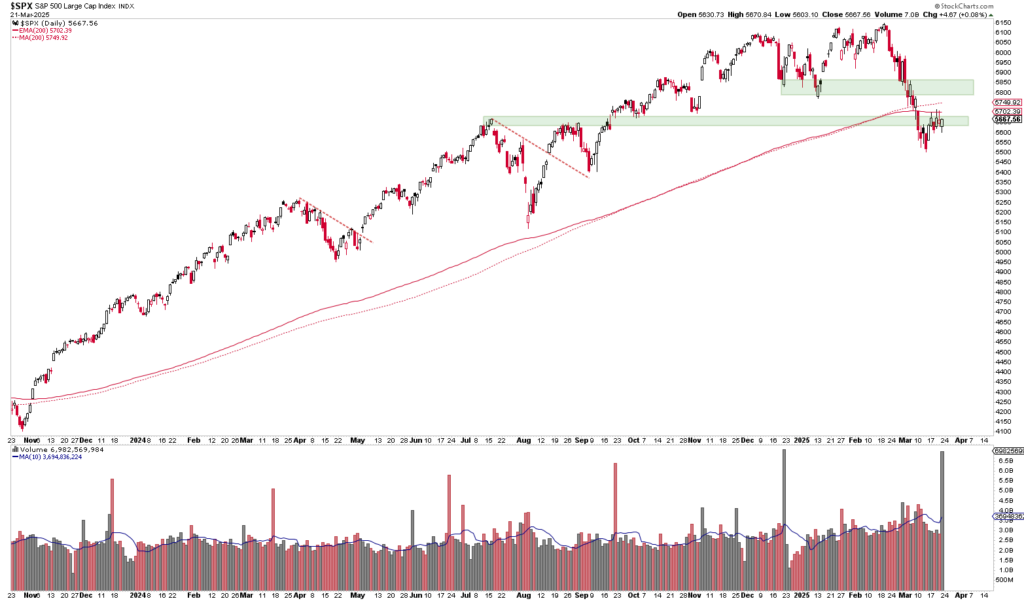
Stock chart of the S&P 500 index with moving averages and volume bars. The chart extends from January 2021 to January 2022 and shows price movements and fluctuations in trading volume.

Dear traders, dear stock market friends. After the 10 percent correction between February and March, the S&P 500 started a recovery on Friday, March 14,...
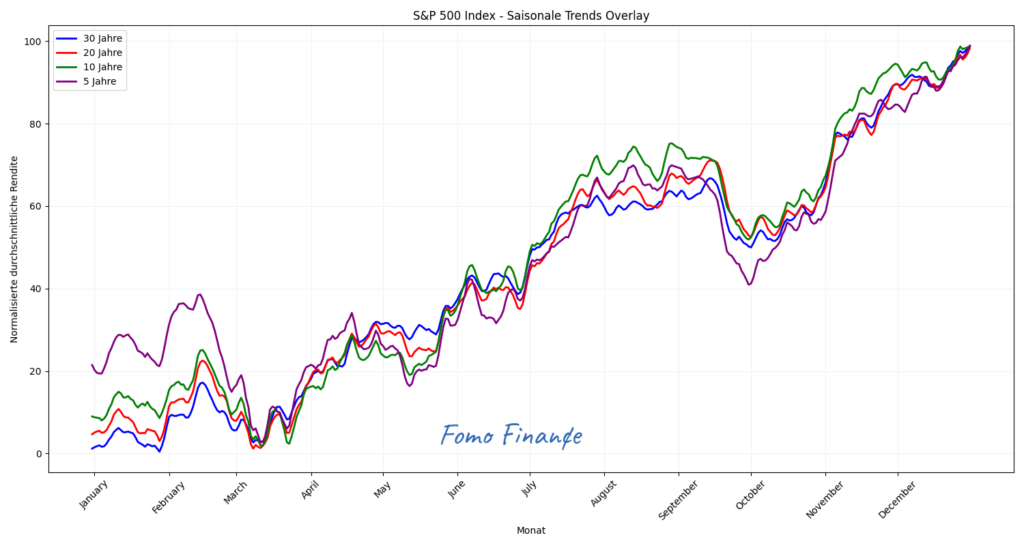
Automatically saved draft line chart shows the S&P 500 Index seasonal trends over 5, 10, 20 and 30 years. The lines illustrate a different performance over the course of the month with an upward trend towards December. Labels in German.

Dear traders, dear stock market friends. After the S&P 500 set a new all-time high last Wednesday with a daily high of 6147 points, the...

Chart showing the Advance-Decline line in red together with the S&P 500 performance. The chart highlights upward and downward trends, with annotations indicating specific patterns.

Dear traders, dear stock market friends. The S&P 500 has risen 25.2 % since the beginning of the year. Since the beginning of the bull market...

The line chart illustrates the trend and shows the trends of the S&P 500 and Advance Decline Line over time, with both lines generally rising.

Dear traders, dear stock market friends. Thanksgiving was celebrated in the USA last week. Instead of stock market prices, many traders were probably...

Email:

info@captrader.com

Send e-mail

Phone:

Hotline (Germany)
0800-8723370

Hotline (International)
00800-08723370

Further contact options