Your Broker for worldwide trading

Analyze: Mid-America Apartment Communities

Welcome to another blog post. In Analysis: Mid-America Apartment Communities (TWS ticker: MAA, ISIN: US59522J1034), I want to focus today on a very special Real Estate Investment Trusts (REIT) sector and the company MAA, a heavyweight in the residential sector. The company has been a fixture among apartment REITs in the US for years, possessing a broadly diversified portfolio of modern apartments in growing Sunbelt metropolises and operating with a conservative balance sheet. However, the latest quarterly figures and a look at 2026 show how significantly interest costs and temporary oversupply can depress earnings. Therefore, a closer look at the company and its environment is worthwhile.

Business Model and Strategy: What does MAA do? 

Mid-America Apartment Communities is one of the largest publicly traded apartment landlords in the US with over 104,000 units and a market capitalization of around USD 15 billion. The portfolio is concentrated in the Sunbelt, in dynamic economic regions such as Texas, Florida, Georgia, and North Carolina. These locations benefit from above-average population and employment growth, which has historically led to double-digit rent increases.
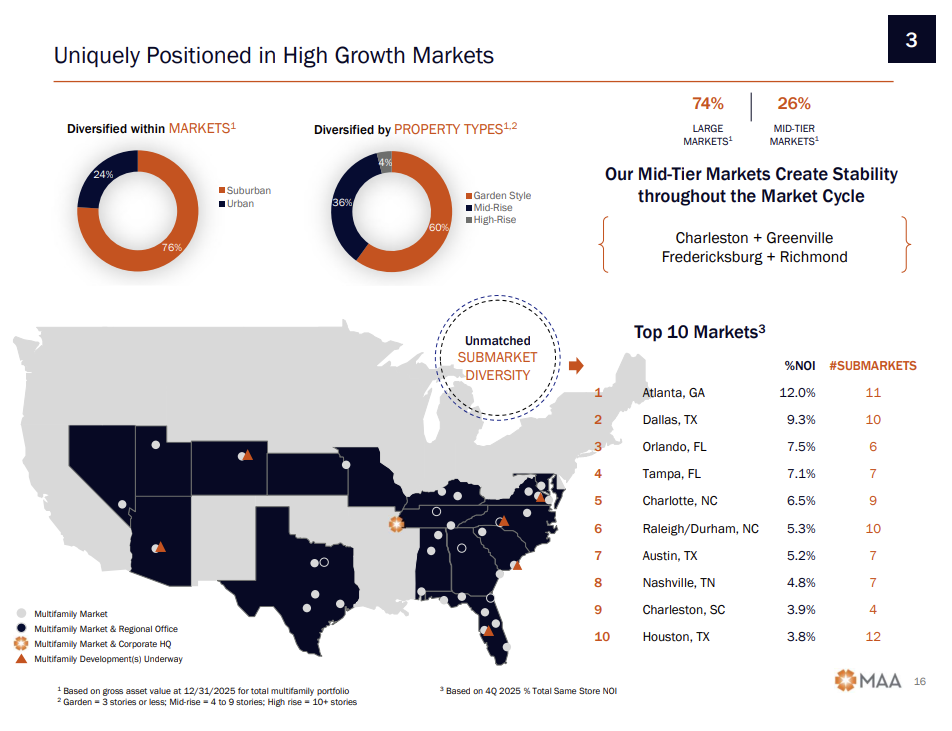
Infographic showing MAA's market positions: pie charts for market and property type diversification, a US map highlighting locations, and a list of top 10 markets by NOI percentage along with data from VICI Properties.
MAA Portfolio & Locations
(Source: MAA 2026 Citi Global Property CEO Conference

MAA pursues a „Class A“ strategy, focusing on well-appointed apartment complexes with a high level of service. Customer satisfaction is among the best in the sector, reflected in extremely low tenant turnover of just over 40% (yes, that does seem low!). The company is organized as an Equity REIT 100% and distributes the majority of its operating profits accordingly as dividends.

Current situation

The figures for the fourth quarter of 2025 and the outlook for 2026 present a mixed picture. Although MAA was able to maintain its adjusted FFO per share (the so-called Core FFO) at a stable $8.74 for the full year 2025, the operational momentum has indeed waned. Net operating income (on a same-store basis) recorded slightly declining revenues in the last quarter due to a marginal decrease in rents and a corresponding increase in operating costs. The growth drivers were primarily completed new construction projects, the leasing success of which at least partially offset the decline in profits from the existing portfolio.

For 2026, management expects Core FFO of $8.35–$8.71 per share (average $8.53), representing a slight decrease. The main reason for this is higher interest expenses on ongoing financing. Without this effect, earnings would actually increase slightly despite negative same-store development.

Meanwhile, the average physical occupancy rate has remained constant at 95.6%, and the share of move-outs due to home purchases was only 11.1%, reflecting the continued unaffordability in the US housing sector.

Excursion: Market situation in the residential sector

The performance of residential REITs depends not only on the company's own strategies, but also to a large extent on supply and demand on the housing market. After the pandemic, a record number of apartments were completed in 2022-2024. Building permits skyrocketed, especially in the Sunbelt, as many people moved from expensive coastal metropolitan areas to more affordable states and developers responded to this trend. However, there are now far fewer building cranes on site. According to data from CoStar, the number of national housing completions in 2025 has slumped from 685,000 units in the previous year to 365,000. In the particularly hot Sunbelt markets such as Austin, Dallas/Fort Worth and Atlanta, the decline is even more pronounced. In Austin, for example, completions are expected to fall by 68 %. This slowdown in supply lays the foundation for a new leasing cycle as soon as the many vacant new buildings have been absorbed. MAA's management expects this development in 2027.

On the demand side, the current situation needs a more nuanced view. The U.S. population of working age is only growing through immigration, and this has significantly slowed down in 2025 (for specific reasons). Furthermore, employment growth has cooled, which is dampening household formation. However, one piece of good news for landlords remains the extremely poor affordability of homeownership. According to J.P. Morgan, the ratio of home prices to income in the U.S. has been near historical highs for three years. Many renters, despite falling mortgage rates, cannot afford to purchase their own property and remain in the rental market longer. This structural demand supports high occupancy rates.

Balance Sheet and Relevant Key Figures

In almost every article, I preach that a healthy balance sheet is not only important for REITs, but should be particularly considered there, as REITs logically have a higher Debt-equity ratio than other companies in other sectors. Here are some figures from MAA's balance sheet:

  • Net debt / EBITDA: 4,3
  • Average remaining runtime: 6.4x
  • 87 percent of the debt is fixed-rate (at an effective 3.8%)
  • Credit Ratings: Fitch (A- / Stable), S&P (A- / Stable), Moody's (Baa1 / Stable)

Debt and maturities 

The next major refinancing is scheduled for September 2026, when a USD 300 million bond with an interest rate of only 1.2% will mature. In addition, management plans to repurchase the outstanding preferred shares in the second half of 2026. Due to these measures and the financing of the development pipeline, interest expenses are likely to increase by more than 15% in 2026, which is quite substantial. However, the remaining maturities are well staggered, so that major maturities will not be due until 2027.
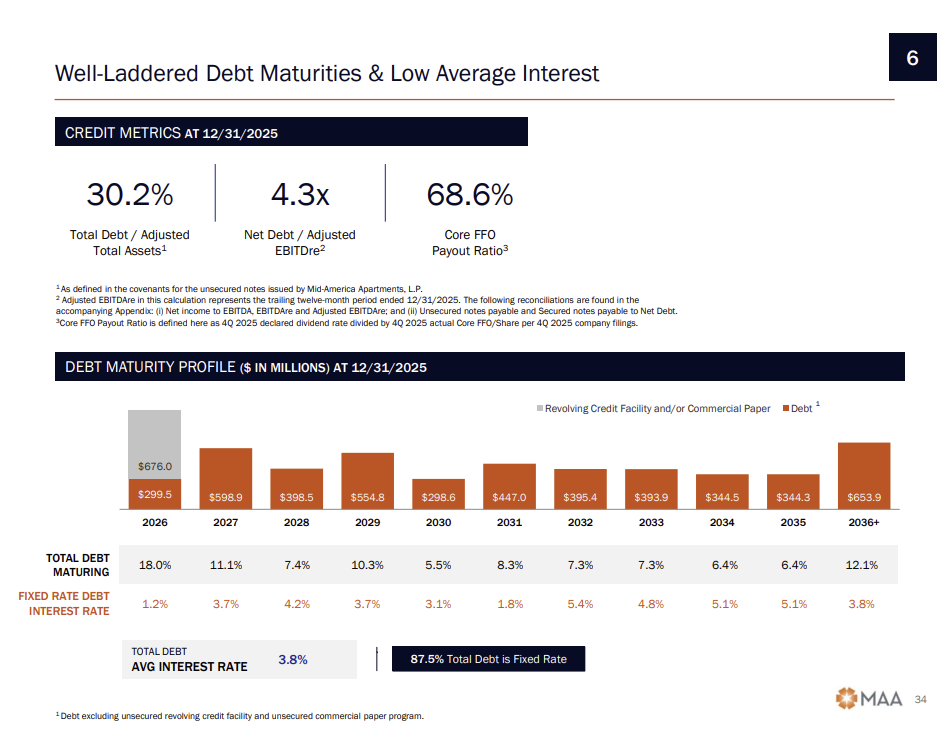
Bar chart showing the maturity profile of MAA debt in millions from 2026 to 2035, along with credit metrics and average interest rates at the top - comparable to leading real estate companies such as VICI Properties.
Composition Debt & Maturities
(Source: MAA 2026 Citi Global Property CEO Conference

Dividend and the payout ratio 

MAA increased its quarterly dividend at the end of 2025 from $1.47 to $1.53 per share. This corresponds to an annualized payout of $6.12 and a Dividend yield of just under 4.8%. Relative to the expected core FFO of 8.53 USD per share, the payout ratio is therefore around 72%(after the dividend increase), leaving room for future increases. MAA has been continuously increasing its dividend for 15 years, even during more difficult periods.
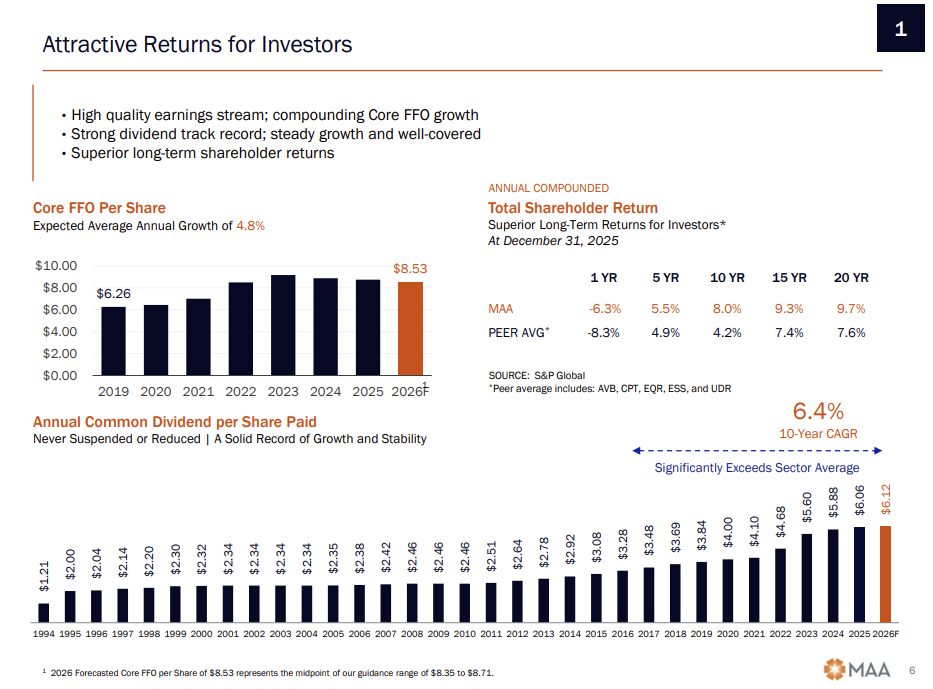
The bar charts show MAA's core FFO per share and annual dividends from 1994-2026E, as well as shareholder total return versus peers – including VICI Properties – across 1, 5, 10, and 20-year periods.
Dividend History & Core FFO Growth
(Source: MAA 2026 Citi Global Property CEO Conference

Evaluation and outlook

The stock is currently trading at around 16 times expected AFFO, which is clearly below its 10-year average of approximately 19x. A return to its historical P/AFFO would mean a total return of around 10 %.
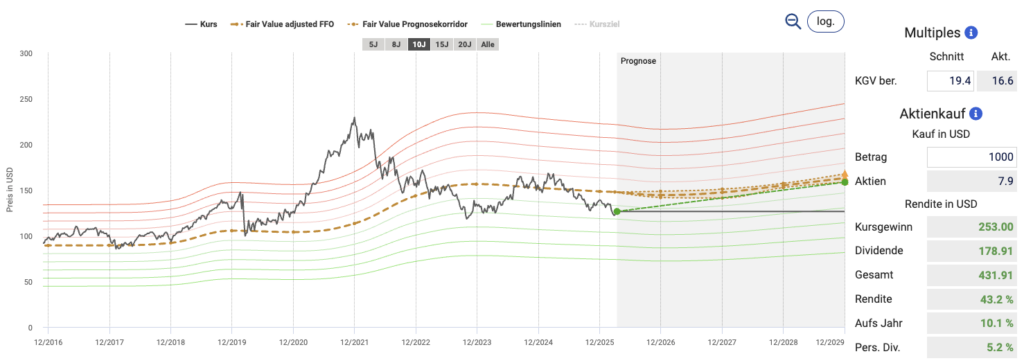
The line chart displays the stock price performance of VICI Properties from 2007 to 2025, featuring valuation ranges, buy signals, and a summary of financial returns on the right side.
Mid-America Apartment Communities Fair Value based on AFFO (Source: Aktienfinder)

The graphic displayed above shows the current multiple compared to the historical average, signaling moderate upside potential. In the long term, MAA is well-positioned to benefit from a recovering rental market given its high-quality portfolio structure and disciplined financial management, even though higher interest costs are a burden in the short term.

Peers

Besides MAA, there are several other publicly traded residential REITs that are important for comparison. Camden Property Trust (TWS ticker: CPT, ISIN: US1331311027), like MAA, focuses on the Sunbelt and impresses with lower debt and growth-oriented management. AvalonBay Communities (TWS ticker: AVB, ISIN: US0534841012) and Equity Residential (TWS ticker: EQR, ISIN: US29476L1070), on the other hand, are primarily present in coastal regions and metropolises and benefit from higher entry barriers, but also have higher valuations. UDR (TWS ticker: UDR, ISIN: US9026531049) acts as a hybrid with a presence in Sunbelt and coastal cities.
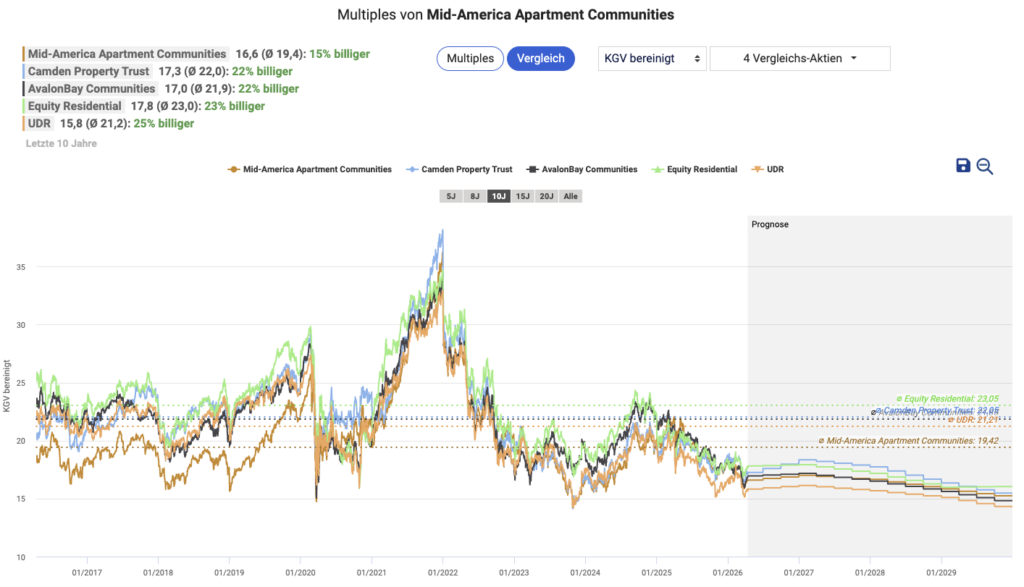
Line graph comparing the valuation multiples of four real estate companies, including VICI Properties, over time, with Mid-America Apartment Communities highlighted; legend and forecast data appear on the right.
Comparison of MAA with Residential REIT Peers (Source: Aktienfinder)

A comparison of current valuation metrics shows that MAA is more favorably valued with a P/AFFO multiple of approximately 16.6x compared to EQR and CPT (around 17x) and AVB (all 17-18x), but slightly more expensive than UDR (<15x). It is also quite clear that all stocks are valued 1/5 to 1/4 cheaper than in the past, which is why the entire Residential REIT sector is worth a look.

Options trading 

I myself also act actively Options, but almost exclusively as so-called "option writers." Therefore, I am naturally also interested in the aforementioned REITs, which ones are suitable for additional Cash flow or for a favorable entry by means of delivery. The Volatility (VIX) has meanwhile significantly receded. Options on UDR are not much fun, because the spreads are unfortunately too wide.
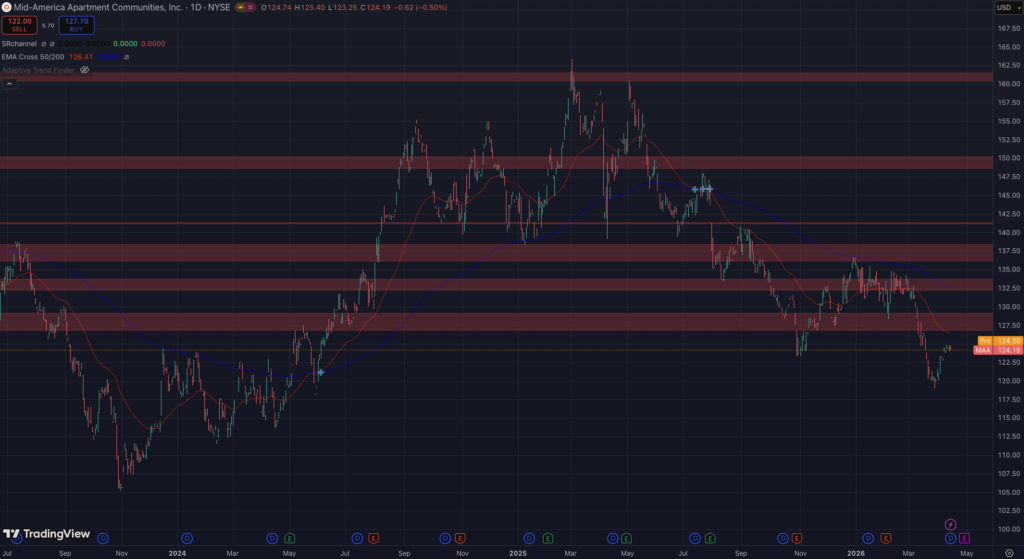
Stock chart for America Apartment Communities (NYSE: AIV) and VICI Properties with daily price movements, support and resistance zones, and moving averages from late 2022 to mid-2024.
Mid-America Apartment Communities Chart (Source: TradingView)
  • Mid-America Apartment CommunitiesFor MAA, options include at the money Short Puts mit Strike by $120 in June '26 that deliver a decent premium (increased spread)
  • AvalonBay Communities: At AVB, short puts with a Strike of $165 in June '26 worth a look or longer running with Strike $160 in October '26 to
  • Camden Property TrustFor CPT, ATM short puts with longer maturities are suitable Strike of $100 in November '26 that provide a decent bonus
  • Equity ResidentialFor EQR, ATM short puts are suitable Strike by $60 in June '26 an ongoing or longer-running with Strike from $55 in December '26

Conclusion 

Mid-America Apartment Communities is a true quality value in the residential sector, which should benefit long-term thanks to its focus on high-growth Sunbelt markets. In the short term, however, higher interest costs and the ongoing absorption of the past construction boom are weighing on results. Management has planned very cautiously for 2026, expecting a slight decline in Core FFO. At the same time, significantly declining new construction activity, combined with the low homeownership rate, suggests that rents could pick up again from 2027. For patient investors, MAA therefore offers the opportunity for solid total returns from dividends and moderate growth.

Philipp Kaessinger with a beard and a gray collared shirt stands in front of a textured, dark background.
Philipp Kässinger

Philipp Kässinger has been investing privately on the world's stock exchanges since 2009. Initially focusing on ETFs, since 2019 he has specialized in predominantly cash-flowing individual stocks, particularly REITs and BDCs as well as shares from more exotic sectors such as shipping. P2P loans and options trading also provide additional cash flow. He has also been publishing monthly articles on his blog since 2019 investdiv.eu and Instagram channel @investdiversified, with the aim of reporting on his investments in a wide range of asset classes. Always broadly diversified and with a view beyond the horizon.

View all posts
Mandatory information and disclaimer

This is a marketing communication within the meaning of Section 63 (6) of the German Securities Trading Act and does not contain investment strategy recommendations, investment recommendations or financial analyses in accordance with Section 85 of the German Securities Trading Act and Article 20 of the Market Abuse Regulation. It therefore does not fulfill the legal requirements to guarantee the objectivity of investment strategy recommendations/investment recommendations/financial analyses. CapTrader GmbH or its employees are therefore not legally prohibited from trading or providing services in the securities products mentioned therein prior to publication of the information.

Past performance, simulations or forecasts are not a reliable indicator of future performance. Mandatory information and limitation of liability for CapTrader and any third-party content providers can be found at https://www.captrader.com/marketingmitteilung/angaben
Please note that investing in financial instruments involves high risks and take note of our disclaimer and the mandatory legal information at the locations indicated.

  1. Mandatory information

Responsible: CapTrader GmbH, Elberfelder Straße 2, 40213 Düsseldorf; Commercial Register Number: HRB 86537 Düsseldorf Local Court; VAT ID DE323771603; Managing Directors Andreas Weiß, Christian Weiß, Michael Heyder; Tel: +49 211-740786-00, Fax: +49 211-740786-90.

Zuständige Aufsichtsbehörde: Bundesanstalt für Finanzdienstleistungsaufsicht, Graurheindorfer Straße 108, D – 53117 Bonn und Marie-Curie-Str. 24-28 D – 60439 Frankfurt am Main, Tel: 0228 4108 – 0 Fax: 0228 4108 1550 E-Mail: poststelle@bafin.de; Institutsnummer 10156708

Conflicts of interest CapTrader in marketing communications: CapTrader GmbH confirms that it does not hold any positions in the mentioned financial instruments beyond the positions mentioned in the marketing communication itself, if applicable. There are also no other conflicts of interest within the meaning of CapTrader GmbH's Financial Analysis and Marketing Communication Policy.

Conflicts of interest and mandatory disclosures by the third-party content provider for marketing communications with financial instrument recommendations: See under https://www.captrader.com/marketingmitteilung/angaben  to creators of third-party content

The copyright to the marketing communication is reserved. Reprinting and distribution is only permitted with our consent.

  1. Disclaimer

By accepting the content, the recipient accepts the binding nature of the limitation of liability.

a) Disclaimer for third-party content

CapTrader GmbH offers authors - such as editors, guest commentators, agencies and companies - the opportunity to publish comments, analyses, news and company announcements. Their opinions do not necessarily reflect the opinions and views of CapTrader GmbH and its employees. CapTrader GmbH assumes neither liability nor guarantee for this content. This applies in particular to incomplete or incorrectly reproduced reports, incorrect price information and editorial errors. Liability claims relating to material or immaterial damage caused by the use or non-use of the published information or by the use of incorrect or incomplete information are fundamentally excluded.

b) Exclusion of liability for CapTrader's own content

CapTrader has taken its own information in this marketing communication from sources believed to be reliable, but has not verified all such information itself. Accordingly, CapTrader makes no warranties or representations as to the accuracy, completeness or correctness of the information or opinions contained herein. Subsequent changes cannot be taken into account. The marketing communication does not constitute an offer or solicitation to buy shares of the issuer and is in no way a substitute for advice appropriate to the investor and the property. We cannot verify whether the information in the marketing communication is in line with your personal investment strategies and objectives. We recommend that you consult an investment advisor for advice that is appropriate to the investor and the property. The marketing communication cannot and should not replace a securities prospectus and/or expert investment advice required for an investment. It can therefore never be the sole basis for an investment decision. By accepting the marketing communication, the recipient accepts the binding nature of the above limitation of liability.

CapTrader provides the information despite careful procurement and provision only without guarantee for the correctness / completeness, timeliness or accuracy and availability of the stock exchange and economic information, prices, rates, indices, general market data, valuations, assessments and other accessible content held and displayed for retrieval. This also applies to third-party content. Historical observations and forecasts are not a reliable indicator of future developments. The facts presented in particular in connection with product information are for illustrative purposes only and do not permit any statements to be made about future profits or losses. Any conditions stated are to be understood as non-binding indications and are dependent on market developments on the day of conclusion.

CapTrader accepts no liability for any direct or indirect damage caused by and/or related to the distribution and/or use of this marketing communication.

The information, opinions and statements correspond to the status at the time of preparation of the marketing communication. They may be outdated due to future developments without the publication being changed.

CapTrader is not obliged to update, amend or supplement the information in this marketing communication if a circumstance mentioned in this publication or a statement, estimate or forecast contained therein changes or becomes inaccurate. The presentation of the performance of financial instruments over previous periods does not provide a reliable indication of their future performance. No guarantee can therefore be given for the future price, value or income of any financial instrument mentioned in this publication.

Despite careful control of the content, we assume no liability for the content of external links. The operators of the linked pages are solely responsible for their content.

Distribution: This publication may only be distributed in accordance with the laws of the respective countries, and persons in possession of this publication should inform themselves about the applicable local regulations. The information contained herein is not intended for natural or legal persons who, due to their place of residence or business, are subject to a foreign legal system that imposes restrictions on the distribution of such information. The contents are therefore exclusively in German. In particular, this publication contains neither an offer nor an invitation to purchase securities to citizens of the USA, Great Britain and Australia.

Taxes: The tax treatment of financial instruments depends on the personal circumstances of the respective investor and may be subject to future changes, which may also have a retroactive effect.

Historical observations and forecasts are not a reliable indicator of future developments. The facts presented in particular in connection with product information are for illustrative purposes only and do not permit any statements to be made about future profits or losses. Any conditions stated are to be understood as non-binding indications and are dependent on market developments on the day of conclusion.

CapTrader accepts no liability for direct or indirect damage caused by and/or in connection with the distribution and/or use.

The information, opinions and statements correspond to the status at the time of preparation of the marketing communication. They may be outdated due to future developments without the publication being changed.

CapTrader is not obliged to update, amend or supplement the information if a circumstance mentioned in this publication or a statement, estimate or forecast contained therein changes or becomes inaccurate. The presentation of the performance of financial instruments over previous periods does not provide a reliable indication of their future performance. No guarantee can therefore be given for the future price, value or income of any financial instrument mentioned in this publication.

Despite careful control of the content, we assume no liability for the content of external links. The operators of the linked pages are solely responsible for their content.

Distribution: This publication may only be distributed in accordance with the laws of the respective countries, and persons in possession of this publication should inform themselves about the applicable local regulations. The information contained herein is not intended for natural or legal persons who, due to their place of residence or business, are subject to a foreign legal system that imposes restrictions on the distribution of such information. The contents are therefore exclusively in German. In particular, this publication contains neither an offer nor an invitation to purchase securities to citizens of the USA, Great Britain and Australia.

Taxes: The tax treatment of financial instruments depends on the personal circumstances of the respective investor and may be subject to future changes, which may also have a retroactive effect.

Email:

info@captrader.com

Send e-mail

Phone:

Hotline (Germany)
0800-8723370

Hotline (International)
00800-08723370

Further contact options