Your Broker for worldwide trading

REIT Q4 Sector Overview

In my last blog post on BDCs and the so-called „Software Crash 2026“ I described how the price losses in the software sector are also spreading to other asset classes and why dividend cover and portfolio quality play a central role in credit-like investment vehicles. But now it's time for the traditional REIT Q4 sector overview. I would therefore like to take another look at the various real estate sectors.

The macro situation remains rather mixed. While Net Lease REITs are benefiting from the turnaround in interest rates (is it really coming?) and favourable or more favourable financing conditions, while the supply overhang in the retail and industrial sectors is slowly abating and demand appears to be stabilizing.

As usual, the following article summarizes the most important developments in some sectors and highlights 2-3 representative REITs each and classifies the latest Q4 and FY2025 results.

Net Lease REITs 

Net lease REITs are something like the bonds of the real estate universe. Their long-term triple-net leases offer a high degree of predictability. At the same time, their valuations are heavily dependent on the interest rate markets, particularly interest rates at the long end. An environment of disinflation, falling capital market interest rates and solid economic growth is ideal for net lease REITs. This is because falling corporate bond yields reduce financing costs and at the same time increase the intrinsic value of future cash flows. As a result, net lease REITs clearly outperformed the broad real estate market in 2025 and also in 2026. The question is whether this will continue or whether the economic and geopolitical situation could lead to a renewed rise in inflation (the bullwhip effect), which could result in interest rate hikes instead of cuts.

NNN REIT

NNN REIT (TWS ticker: NNN, ISIN: US6374171063) sold around USD 100m of vacant properties in 2025 and bought USD 931m of new properties, increasing the occupancy rate to 98.3 %.
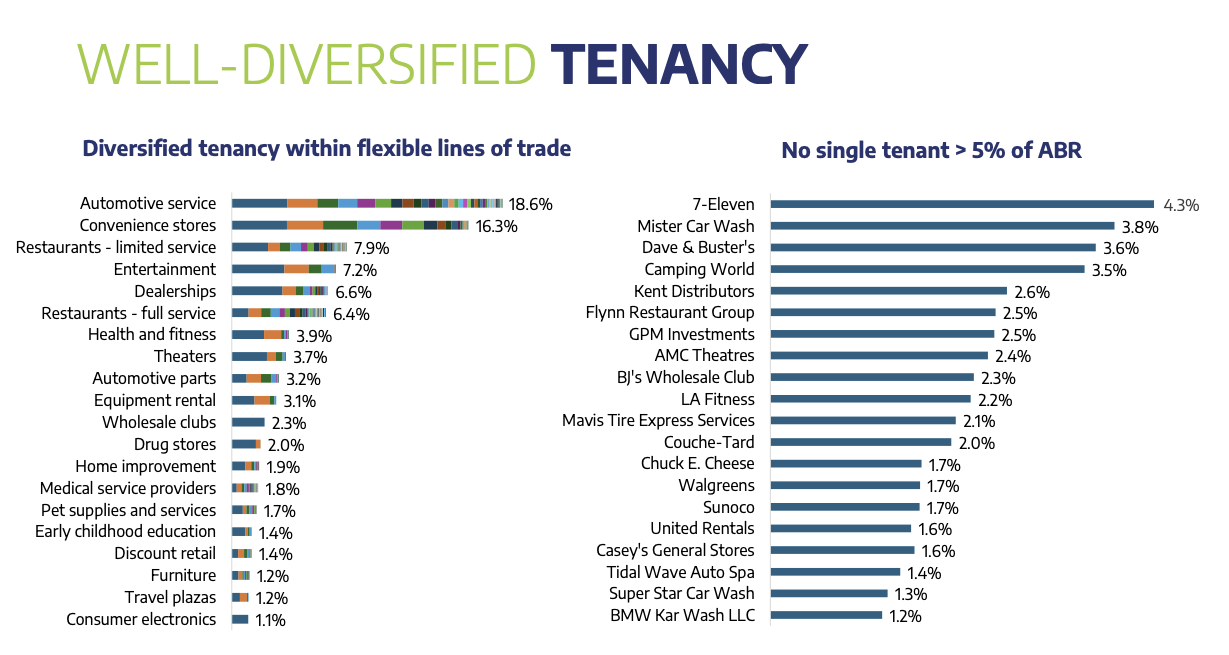
Bar chart showing diversified leasing by sector and top tenants, with no single tenant accounting for more than 5% of ABR; automotive services leads with 18.6%, 7-Eleven is the largest tenant with 4.3%. REIT Q3 Sector Overview - Between interest rate turnaround and supply pressure.

Tenant and sector diversification (source: NNN REIT Investor Update March 2026)

The average remaining term of the leases (10.2 years) is well aligned with the average term of the debt (10.8 years). AFFO per share have grown by 2.7 % and growth is expected to increase to 3.2 % in 2026.

With a dividend yield of 5.3 %, a moderate Debt-equity ratio (Net Debt/EBITDA 5.6×) and a price/AFFO multiple of only 12.6×, there is also a lot of upside possible in comparison with historical multiples. In return for the wait, the dividend has been rising for 36 years.
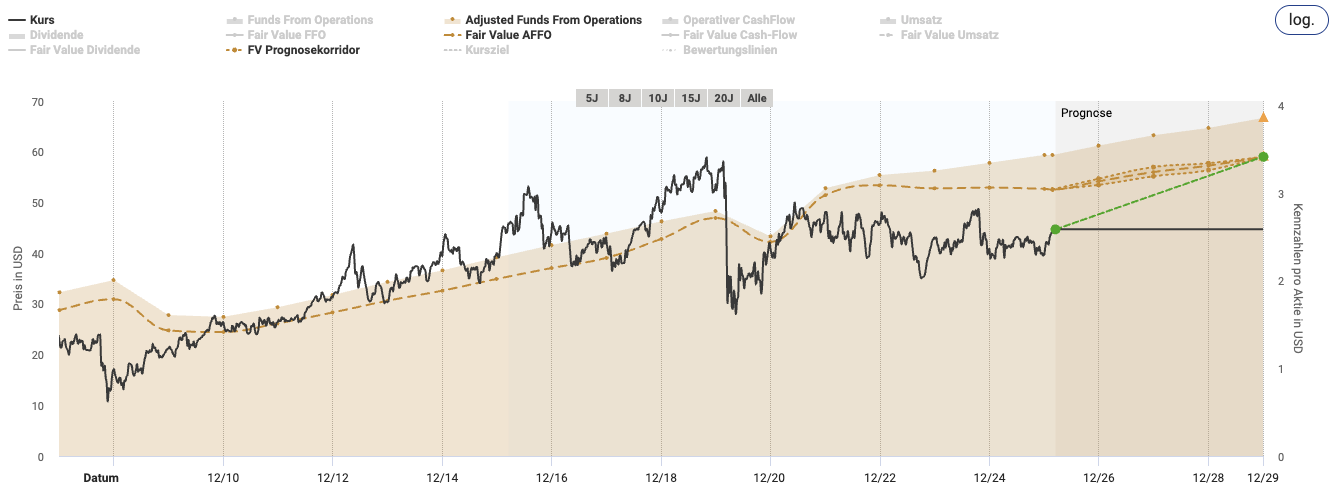
Line chart showing share price, fair value and projected fair value per share in USD from 2010 to 2028, highlighting trends relevant to the REIT Q3 Sector Overview - Between Interest Rate Turnaround and Supply Pressure, with data and forecast lines.

Fair value NNN REIT (source: aktienfinder.net)

W.P. Carey

W.P. Carey (TWS ticker: WPC, ISIN: US92936U1097) is one of the REITs that is much more globally positioned than some of its peers. Around 1/3 of the properties in the portfolio are in Europe. WPC was able to achieve AFFO growth of 5.7 % in 2025 and the Dividend by around 4 %. Due to the sale of a total of 63 self-storage properties and hotels, the non-net lease share has now shrunk to a few percent. The office segment of the portfolio had already been divested in 2023 and released into the open via the spin-off Net Lease Office Propertiers (TWS ticker: NLOP, ISIN: US64110Y1082). NLOP was (in retrospect) a very interesting asset play.
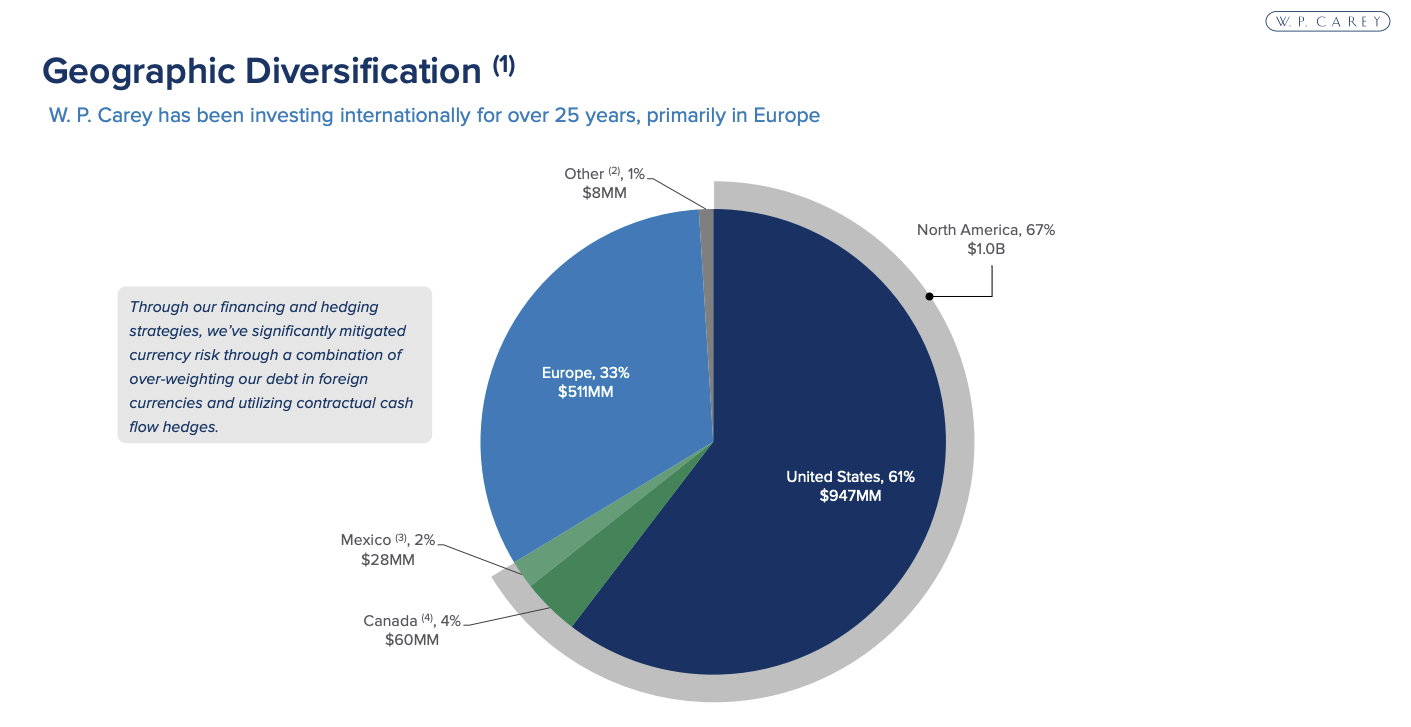
W. P. Carey geographic diversification pie chart: 61% United States, 33% Europe, 4% Canada, 2% Mexico and 1% Other - an insightful REIT Q3 sector overview - Between interest rate reversal and supply pressure.

Geographical Diversification (Source: W. P. Carey Inc. investor presentation 4Q25)

For 2026, management expects around USD 1.5 billion in acquisitions and USD 500 million in further disposals. The portfolio turnover is therefore not over yet.

AFFO per share is expected to increase by 4.2 % in 2026. The dividend yield is around 5.2 %, i.e. still in the focus of income investors. With a P/AFFO multiple of 13.9×, there is still a discount compared to sector peers. The market does not yet seem to be fully rewarding the transformation into a pure net lease player.

VICI Properties

VICI Properties (TWS ticker: VICI, ISIN: US9256521090), the specialist for adventure and casino real estate, has reported AFFO growth of 5.1 % for the full year 2025. I already wrote about the very special net lease REIT and its challenges in the first article 2026 written in detail.
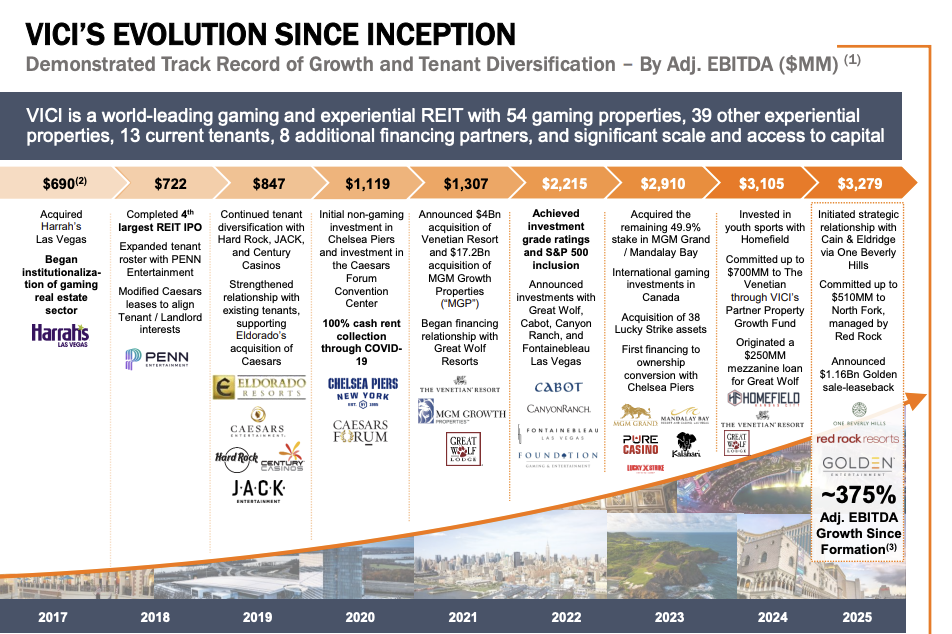
Timeline chart showing VICI's business growth from 2017 to 2025, highlighting key acquisitions, expansions and financial metrics such as adjusted EBITDA and number of properties - a REIT Q3 sector overview amid interest rate turnaround and supply pressure.

VICI growth story (Source: VICI Investor Presentation)

The main investments included a USD 1.16 billion portfolio of seven casinos (7.5 % initial yield) and structured financing. This year there is also a stronger focus on debt, as VICI has to refinance USD 1.75bn of bonds and redeem around USD 250m of preferred shares, which is why management is forecasting weaker AFFO growth of only 2-3 %.
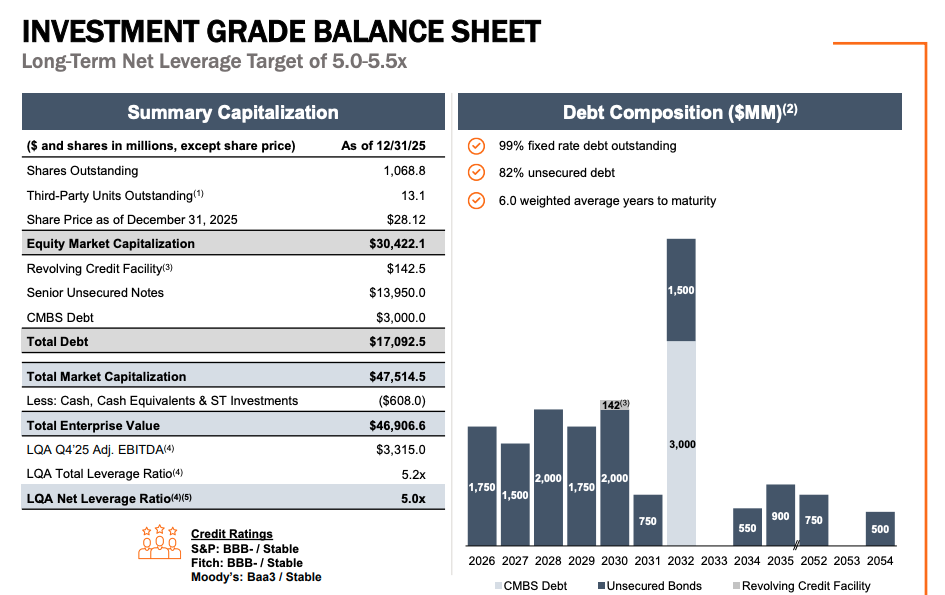
A balance sheet summary with capitalization tables and a debt composition bar chart by year highlighting unsecured bonds with a peak in 2027 - ideal for your REIT Q3 Sector Overview - Between Interest Rate Turnaround and Supply Pressure.

Balance sheet, debt and maturities (Source: VICI Investor Presentation)

The share is currently trading at 11.7× AFFO and a historically high Dividend yield of ~6.3 %, which should continue to grow at 2-5 % p.a.

Retail REITs

Brick-and-mortar retail has left the „retail apocalypse“ narrative behind. E-commerce and omni-channel remain important growth drivers, but supply is scarce due to the low level of construction activity in the retail segment. The world's largest commercial real estate services and investment firm CBRE Group expects the low supply to keep vacancy below 6 % for the foreseeable future and that rental growth of 2 to 2.5 % per year will lead to a new equilibrium in the retail market. After a slight decline in net absorption in 2025, CBRE expects net absorption to outpace low completions again in 2026. In short, demand is solid, but low construction activity is creating pricing power.

Whitestone REIT 

Whitestone REIT (TWS ticker: WSR, ISIN: US9660842041) is a REIT with a smaller Market capitalization, which, however, has proven in the current year that a small-scale portfolio focused on the Sunbelt can generate high growth. Net operating income (NOI) increased by 4 % in 2025 and management expects a range of 3-4.75 % for 2026.
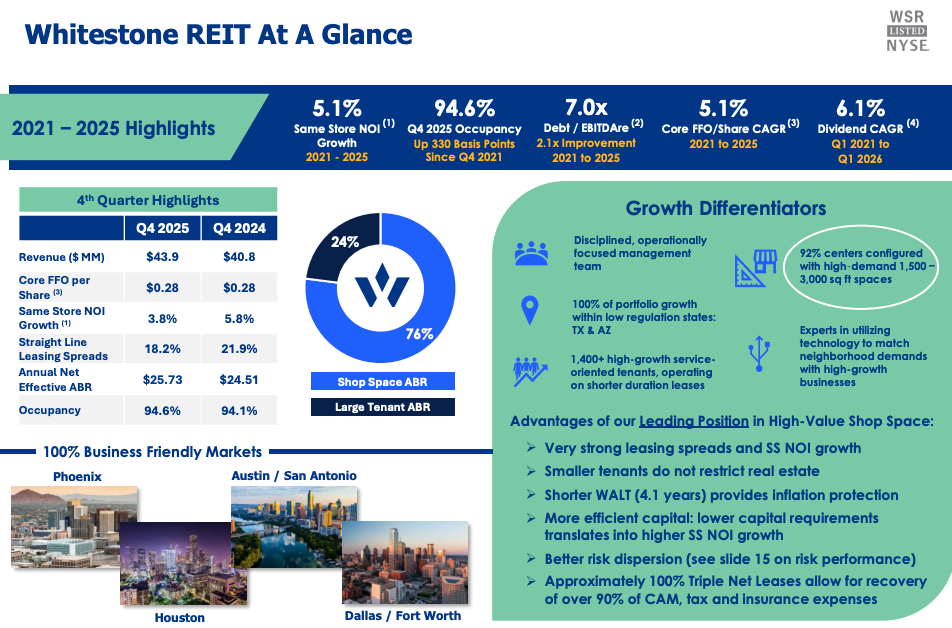
Infographic summarizing Whitestone REIT's financial highlights for 2021-2025, Q4 2024 data, market locations, growth strategies and a REIT Q3 sector overview - Between interest rate reversal and supply pressure in retail real estate.

Whitestone REIT at a glance (Source: Whitestone REIT Q4 2025 Earnings Presentation)

At the same time, legal proceedings against the former CEO have been settled and the balance sheet has been strengthened through targeted sales.

FFO growth is expected to accelerate to 6.5-7 % in 2026, which is why the monthly dividend paid (dividend yield ~3.4 %) is well covered. At around 14.7× core FFO, there is certainly still some upside potential, especially as very concrete takeover rumors keep circulating. For example, two offers have already been rejected by MCB Real Estate.

Kite Realty Group Trust 

Kite Realty Group (TWS ticker: KRG, ISIN: US49803T3005), which focuses primarily on grocery stores, recorded same-property NOI (SPNOI) growth of 2.9 % in 2025 and thus remained at the forefront of the industry and sector. Cash leasing spreads of over 20 % for new and renewal contracts have signaled strong rent increases. In Q4, growth fell slightly to 1.7 %, but was still well above the historical average.
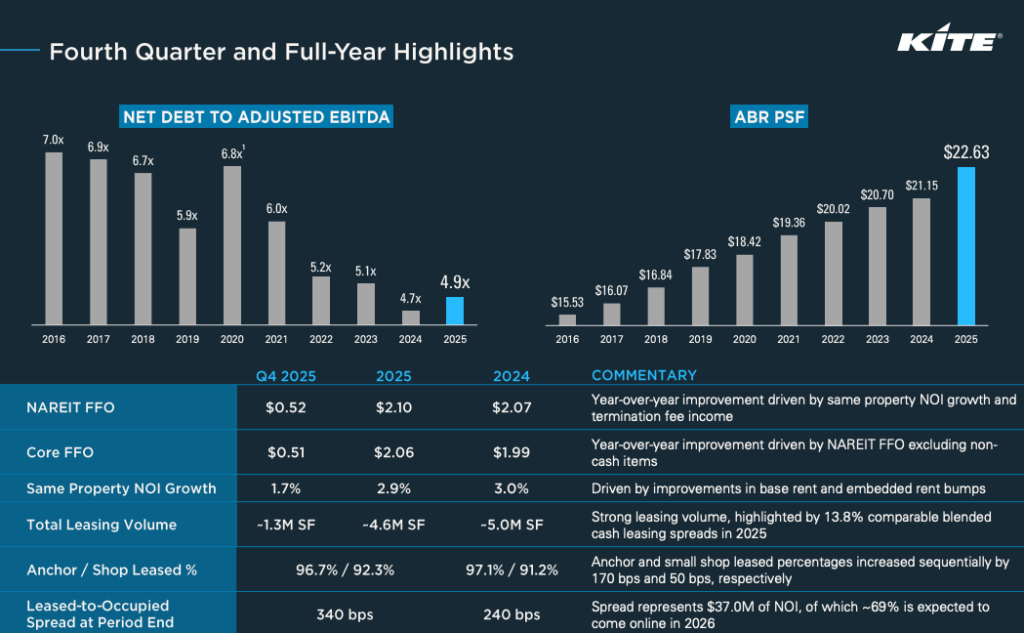
A financial overview table and chart showing Kite Realty's REIT Q3 Sector Overview - Between Interest Rate Turnaround and Supply Pressure, with fourth quarter and full year highlights such as Net Debt, EBITDA, ABR PSF and Lease Growth from 2018 to 2025.

KRG Q4 and FY2025 highlights (Source: Kite Investor Update Q4 2025)

The balance sheet is rather conservative with a net debt/EBITDA of 4.9×, and KRG has used some of the capital surplus to buy back shares worth around USD 230m, at a return of just over 9 % on invested capital. Not bad!

For 2026, management expects a slight decline in SPNOI growth to 2.75 % and FFO growth of around 1.5 %, primarily due to refinancing. The share is trading at around 12.3× core FFO and a dividend yield of 4.5 %.

Kimco Realty 

Kimco, with its national, also predominantly grocery-anchored portfolio, has reported SPNOI growth of 3 % and FFO growth of 6.7 % in 2025. The portfolio utilization is 96.4 %. The backlog of unutilized rental space has reached a record USD 73 million.
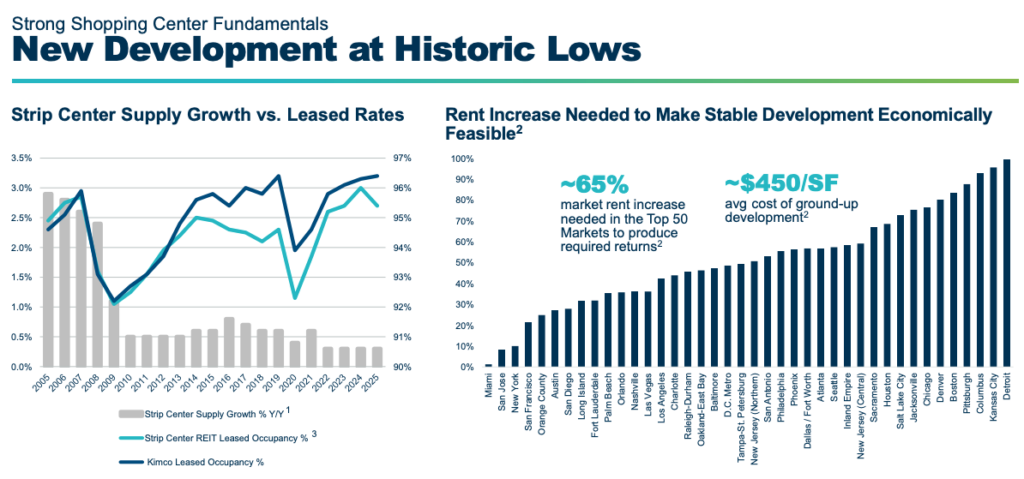
Line and bar charts illustrate strip center supply growth and leased occupancy, as well as a bar chart showing rent growth by market for stable development (average 450 $/SF), providing a REIT Q3 Sector Overview - Between Interest Rate Turnaround and Supply Pressure.

Growth with New developments in the sector (Source: KIM - Investor Presentation Fourth Quarter 2025)

KIM has used the low share prices to buy back around USD 121m of its own shares in 2025 and has also received a (further) rating upgrade. For 2026, management is targeting SPNOI growth of 3 % and FFO growth of 3.5 %.

In view of an FFO multiple of 12.8× and a dividend yield of 4.5 %, further potential is conceivable, especially as the valuation looks favorable by historical standards.

Industrial REITs

Following the pandemic boom, the industrial sector recorded the strongest wave of new builds of all real estate classes. Nevertheless, demand remains robust as e-commerce sales continue to rise and tenants' investment freeze of recent months and years is slowly dissipating. In 2025, overall leasing activity remained at the 2019 level, which is why the simultaneous increase in the construction of new warehouses ec. led to an increase in the vacancy rate. The pipeline is shrinking, as new buildings amounting to around 2 % of the existing stock are currently under development. This is the lowest figure for a decade! Avison Young expects a gradual recovery in 2026 as fewer speculative properties come onto the market and the additional demand stimulus from fiscal incentives (e.g. bonus depreciation for manufacturing plants) appears to be having an effect.

First Industrial Realty Trust

First Industrial Realty (TWS ticker: FR, ISIN: US32054K1034) increased FFO per share by 11.7 % and SPNOI by 7.1 % in 2025. In Q4, SPNOI growth declined to 3.7 %, while utilization fell from 96.2 % to 94.4 %, which is remarkably robust given the strong supply.
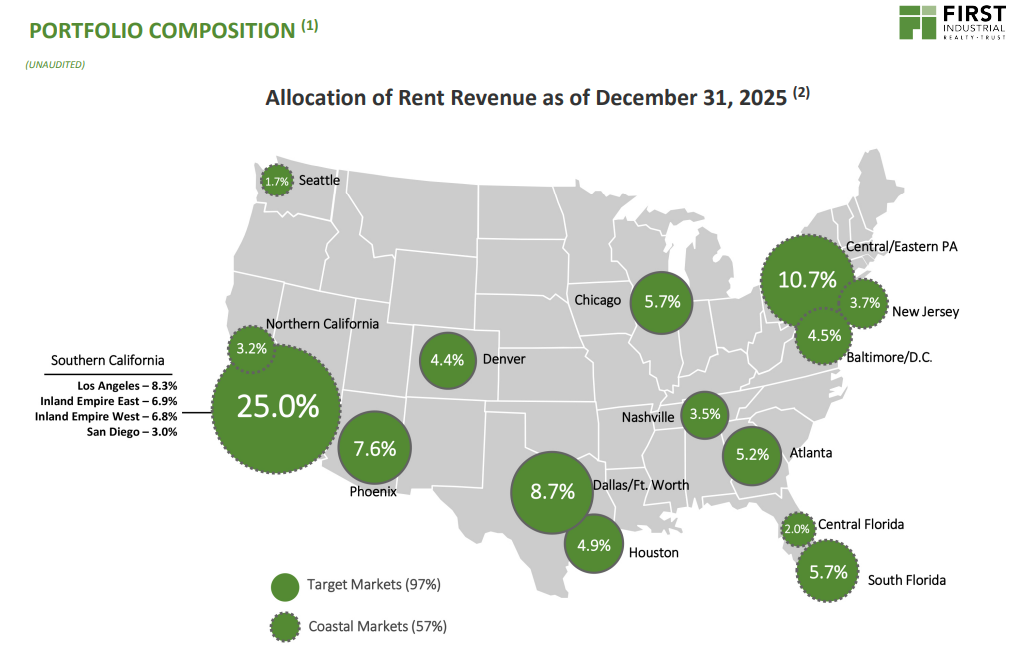
Map of the U.S. showing the breakdown of rental income by region as of December 31, 2025, with Southern California highlighted at 25%. Includes insights from the REIT Q3 Sector Overview - Between Interest Rate Turnaround and Supply Pressure, with regions highlighted in green circles.

Portfolio FR (Source: First Industrial Realty Trust - Fourth Quarter 2025 Supplemental)

The management has increased the dividend by 12.4 % and secured more favorable credit terms by adjusting the spreads on variable loans. FFO and SPNOI to grow by 6 % each in 2026. Analysts expect a return to ~8 % in 2027.
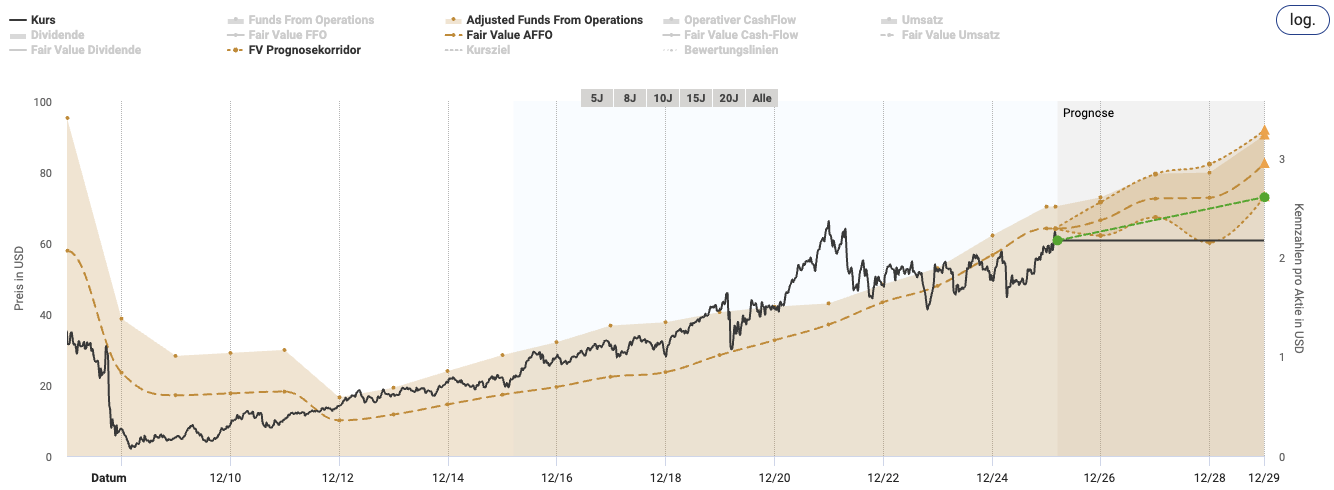
Line chart showing the price in USD, working capital, fair value and forecast for a financial asset from 2010 to 2028 - including dividend indicators and forecasts for the REIT Q3 Sector Overview - Between interest rate turnaround and supply pressure.

Fair value First Industrial Realty Trust (source: aktienfinder.net)

At 19.3× FFO and a dividend yield of 3.3 %, First Industrial Realty Trust still looks slightly undervalued.

Rexford Industrial

Rexford Industrial (TWS ticker: REXR, ISIN: US76169C1009), the logistics REIT with a pure focus on Southern California, disappointed in 2025 as core FFO only grew by 2.6 % and even declined slightly in the fourth quarter. Although SPNOI increased by 4.3 %, high sales for debt repayment and a low occupancy rate of 90 % (including redevelopment properties) weighed on the figures.
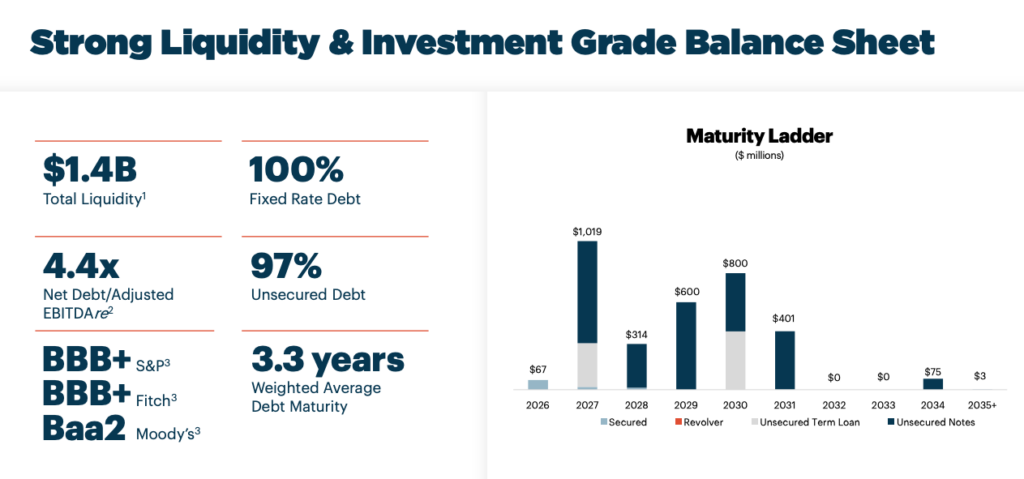
REIT Q3 Sector Overview infographic - Between interest rate turnaround and supply pressure: liquidity, debt metrics, credit ratings and a bar chart of maturities (2026-2031) of secured, revolving, term and unsecured debt.

REXR Balance Sheet (Source: Rexford Industrial Realty Earnings Presentation 4Q 2026)

For 2026, management expects SPNOI to decline by 1-2 % and FFO to stagnate. Nevertheless, the structural advantage of the Southern California market with high barriers to entry and long-term e-commerce demand remains. Another advantage is REXR's strong balance sheet (net debt/EBITDA 4.4×) and ongoing share buyback programs.
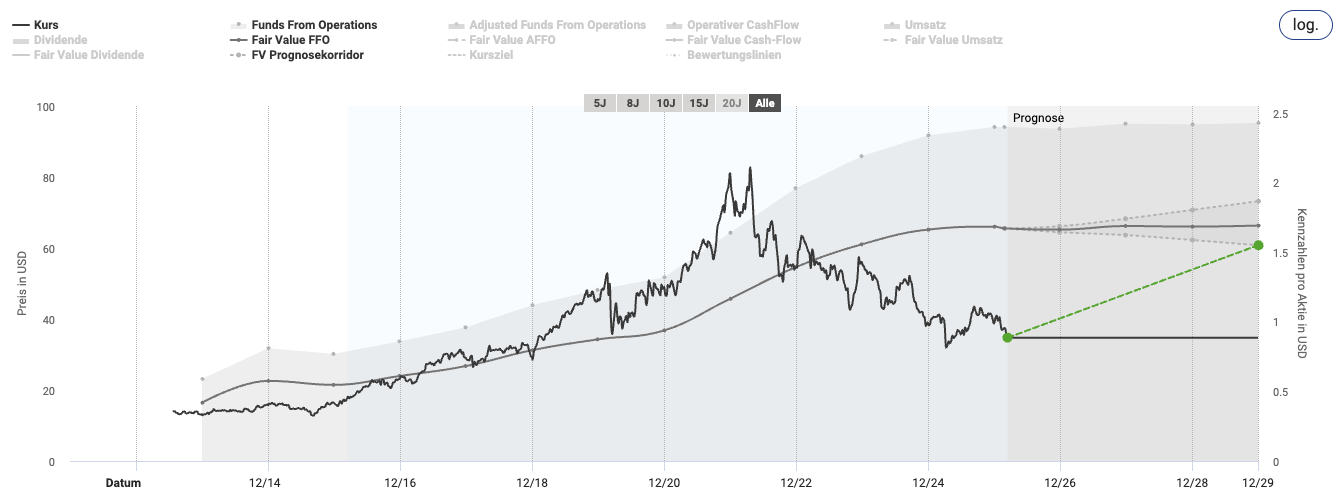
Line chart of share price in USD from 2014 to 2025, with REIT Q3 sector overview - Between interest rate turnaround and supply pressure, with a shaded forecast area and a green upward arrow highlighting the forecast share price development.

Fair value Rexford Industrial (source: aktienfinder.net)

As REXR is trading at around 14.7× FFO and there are signs of a recovery in 2027, the current valuation is quite attractive, also in view of the historically average multiples.

Options trading 

I myself also act actively Optionsbut almost exclusively as a so-called "writer". I am therefore naturally also interested in the REITs mentioned above, which are suitable for additional Cash flow or for a favorable entry by means of delivery. The Volatility (VIX) is back at a level below the 20 mark after a spike. Unfortunately, the spreads at NTST are too high.

  • Kimco Realty: For KIM there are at the money Short Puts longer running with Strike of $22.5 in December '26 which deliver a decent premium (slightly higher spread).
  • W.P. Carey: In the case of WPC, short puts with a Strike from $65 in May '26 worth a look or longer running with Strike from $65 in January '27 (increased spread)
  • VICI Properties: For VICI, ATM Short Puts offer a longer duration with Strike of $27.5 in January '27 that deliver a decent premium.
  • NNN REIT: For NNN, short puts with a longer duration with Strike of $40 in September '26 that offer a reasonably interesting premium.
  • Rexford Industrial: For REXR, short puts with longer maturities with Strike from $30 in December '26 that deliver a decent premium.

Conclusion

In the fourth quarter of 2025, the most important REIT sectors revealed different dynamics. Shopping centers (retail) remain robust thanks to scarce space and (still) stable consumer demand. Net-lease REITs are benefiting from falling interest rates (this could change) and offer attractive yields. The worst is probably over in the industrial sector. Those with patience could be rewarded over the next few years with REXR, for example.

Ultimately, it remains important to carefully examine the balance sheets (especially debt and maturities), valuation and growth prospects of all REITs. However, with a well-diversified selection from the REITs mentioned, both current income and long-term value appreciation can still be realized.

Philipp Kaessinger with a beard and a gray collared shirt stands in front of a textured, dark background.
Philipp Kässinger

Philipp Kässinger has been investing privately on the world's stock exchanges since 2009. Initially focusing on ETFs, since 2019 he has specialized in predominantly cash-flowing individual stocks, particularly REITs and BDCs as well as shares from more exotic sectors such as shipping. P2P loans and options trading also provide additional cash flow. He has also been publishing monthly articles on his blog since 2019 investdiv.eu and Instagram channel @investdiversified, with the aim of reporting on his investments in a wide range of asset classes. Always broadly diversified and with a view beyond the horizon.

View all posts
Mandatory information and disclaimer

This is a marketing communication within the meaning of Section 63 (6) of the German Securities Trading Act and does not contain investment strategy recommendations, investment recommendations or financial analyses in accordance with Section 85 of the German Securities Trading Act and Article 20 of the Market Abuse Regulation. It therefore does not fulfill the legal requirements to guarantee the objectivity of investment strategy recommendations/investment recommendations/financial analyses. CapTrader GmbH or its employees are therefore not legally prohibited from trading or providing services in the securities products mentioned therein prior to publication of the information.

Past performance, simulations or forecasts are not a reliable indicator of future performance. Mandatory information and limitation of liability for CapTrader and any third-party content providers can be found at https://www.captrader.com/marketingmitteilung/angaben
Please note that investing in financial instruments involves high risks and take note of our disclaimer and the mandatory legal information at the locations indicated.

  1. Mandatory information

Responsible: CapTrader GmbH, Elberfelder Straße 2, 40213 Düsseldorf; Commercial Register Number: HRB 86537 Düsseldorf Local Court; VAT ID DE323771603; Managing Directors Andreas Weiß, Christian Weiß, Michael Heyder; Tel: +49 211-740786-00, Fax: +49 211-740786-90.

Zuständige Aufsichtsbehörde: Bundesanstalt für Finanzdienstleistungsaufsicht, Graurheindorfer Straße 108, D – 53117 Bonn und Marie-Curie-Str. 24-28 D – 60439 Frankfurt am Main, Tel: 0228 4108 – 0 Fax: 0228 4108 1550 E-Mail: poststelle@bafin.de; Institutsnummer 10156708

Conflicts of interest CapTrader in marketing communications: CapTrader GmbH confirms that it does not hold any positions in the mentioned financial instruments beyond the positions mentioned in the marketing communication itself, if applicable. There are also no other conflicts of interest within the meaning of CapTrader GmbH's Financial Analysis and Marketing Communication Policy.

Conflicts of interest and mandatory disclosures by the third-party content provider for marketing communications with financial instrument recommendations: See under https://www.captrader.com/marketingmitteilung/angaben  to creators of third-party content

The copyright to the marketing communication is reserved. Reprinting and distribution is only permitted with our consent.

  1. Disclaimer

By accepting the content, the recipient accepts the binding nature of the limitation of liability.

a) Disclaimer for third-party content

CapTrader GmbH offers authors - such as editors, guest commentators, agencies and companies - the opportunity to publish comments, analyses, news and company announcements. Their opinions do not necessarily reflect the opinions and views of CapTrader GmbH and its employees. CapTrader GmbH assumes neither liability nor guarantee for this content. This applies in particular to incomplete or incorrectly reproduced reports, incorrect price information and editorial errors. Liability claims relating to material or immaterial damage caused by the use or non-use of the published information or by the use of incorrect or incomplete information are fundamentally excluded.

b) Exclusion of liability for CapTrader's own content

CapTrader has taken its own information in this marketing communication from sources believed to be reliable, but has not verified all such information itself. Accordingly, CapTrader makes no warranties or representations as to the accuracy, completeness or correctness of the information or opinions contained herein. Subsequent changes cannot be taken into account. The marketing communication does not constitute an offer or solicitation to buy shares of the issuer and is in no way a substitute for advice appropriate to the investor and the property. We cannot verify whether the information in the marketing communication is in line with your personal investment strategies and objectives. We recommend that you consult an investment advisor for advice that is appropriate to the investor and the property. The marketing communication cannot and should not replace a securities prospectus and/or expert investment advice required for an investment. It can therefore never be the sole basis for an investment decision. By accepting the marketing communication, the recipient accepts the binding nature of the above limitation of liability.

CapTrader provides the information despite careful procurement and provision only without guarantee for the correctness / completeness, timeliness or accuracy and availability of the stock exchange and economic information, prices, rates, indices, general market data, valuations, assessments and other accessible content held and displayed for retrieval. This also applies to third-party content. Historical observations and forecasts are not a reliable indicator of future developments. The facts presented in particular in connection with product information are for illustrative purposes only and do not permit any statements to be made about future profits or losses. Any conditions stated are to be understood as non-binding indications and are dependent on market developments on the day of conclusion.

CapTrader accepts no liability for any direct or indirect damage caused by and/or related to the distribution and/or use of this marketing communication.

The information, opinions and statements correspond to the status at the time of preparation of the marketing communication. They may be outdated due to future developments without the publication being changed.

CapTrader is not obliged to update, amend or supplement the information in this marketing communication if a circumstance mentioned in this publication or a statement, estimate or forecast contained therein changes or becomes inaccurate. The presentation of the performance of financial instruments over previous periods does not provide a reliable indication of their future performance. No guarantee can therefore be given for the future price, value or income of any financial instrument mentioned in this publication.

Despite careful control of the content, we assume no liability for the content of external links. The operators of the linked pages are solely responsible for their content.

Distribution: This publication may only be distributed in accordance with the laws of the respective countries, and persons in possession of this publication should inform themselves about the applicable local regulations. The information contained herein is not intended for natural or legal persons who, due to their place of residence or business, are subject to a foreign legal system that imposes restrictions on the distribution of such information. The contents are therefore exclusively in German. In particular, this publication contains neither an offer nor an invitation to purchase securities to citizens of the USA, Great Britain and Australia.

Taxes: The tax treatment of financial instruments depends on the personal circumstances of the respective investor and may be subject to future changes, which may also have a retroactive effect.

Historical observations and forecasts are not a reliable indicator of future developments. The facts presented in particular in connection with product information are for illustrative purposes only and do not permit any statements to be made about future profits or losses. Any conditions stated are to be understood as non-binding indications and are dependent on market developments on the day of conclusion.

CapTrader accepts no liability for direct or indirect damage caused by and/or in connection with the distribution and/or use.

The information, opinions and statements correspond to the status at the time of preparation of the marketing communication. They may be outdated due to future developments without the publication being changed.

CapTrader is not obliged to update, amend or supplement the information if a circumstance mentioned in this publication or a statement, estimate or forecast contained therein changes or becomes inaccurate. The presentation of the performance of financial instruments over previous periods does not provide a reliable indication of their future performance. No guarantee can therefore be given for the future price, value or income of any financial instrument mentioned in this publication.

Despite careful control of the content, we assume no liability for the content of external links. The operators of the linked pages are solely responsible for their content.

Distribution: This publication may only be distributed in accordance with the laws of the respective countries, and persons in possession of this publication should inform themselves about the applicable local regulations. The information contained herein is not intended for natural or legal persons who, due to their place of residence or business, are subject to a foreign legal system that imposes restrictions on the distribution of such information. The contents are therefore exclusively in German. In particular, this publication contains neither an offer nor an invitation to purchase securities to citizens of the USA, Great Britain and Australia.

Taxes: The tax treatment of financial instruments depends on the personal circumstances of the respective investor and may be subject to future changes, which may also have a retroactive effect.

Email:

info@captrader.com

Send e-mail

Phone:

Hotline (Germany)
0800-8723370

Hotline (International)
00800-08723370

Further contact options