The reporting season for the third quarter of 2026 is largely complete, and with that it is time to take a look at the various REIT sectors. As in previous quarters, I do not simply want to reproduce individual figures here; instead, I want to look at what has changed within the respective real estate markets.
In the last REIT Q2'26 Sector Overview Residential, Net Lease and Industrial REITs were the focus of attention this time. Therefore, we are taking a closer look at Healthcare REITs and, for the first time in a while, Data Center REITs.
In senior housing, an aging population is encountering years of low new construction numbers. In data centers, by contrast, the enormous demand for computing power for AI and cloud applications is causing electricity to become almost more scarce in some markets than the actual real estate itself.
Before we get to the REIT Q3'26 sector overview, however, we need to briefly discuss the interest rates again.
The Fed is taking a break for now, right?
In the Q2 contribution I had written in more detail about the impact that rising long-term interest rates have on REITs. Since then, the situation has not necessarily become more relaxed.
In September, the US Federal Reserve raised the target range for the federal funds rate by 25 basis points to 3.75 to 4.00%. At the end of October, the Fed left this range unchanged. Interestingly, two members of the FOMC even voted for another 25 basis point increase. Inflation thus remains a concern and quick interest rate cuts are currently unlikely.
Even more important for many REITs is the long-term end of the yield curve. The yield of the ten-year US government bond is currently around 2%. 5,09 % These are still levels at which real estate companies must pay very close attention to their capital costs both in refinancing and in new projects. At the same time, Treasuries remain a direct competitor for investor capital.
However, after the break, there are already several Fed voices publicly speaking out in favor of further interest rate hikes of up to 50 basis points in December.
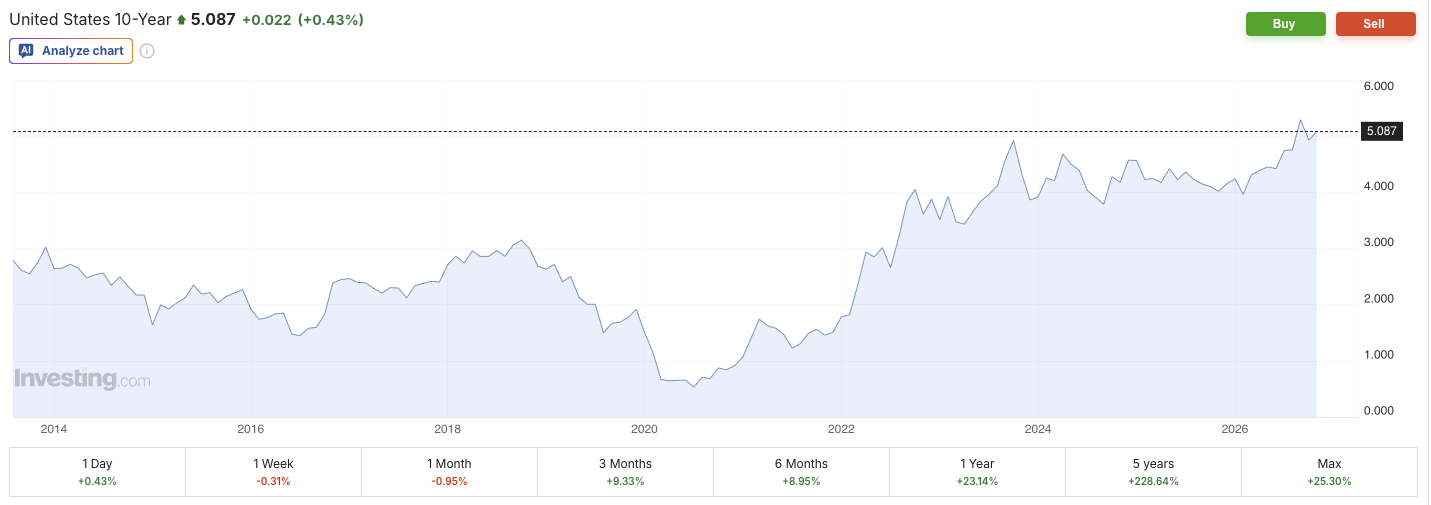
Yield on ten-year US Treasury bonds (source: investing.com)
The interesting thing is that some real estate sectors are surprisingly good at managing these high interest rates. And in healthcare and data centers, we are currently seeing growth rates that are rarely seen in REITs.
Healthcare REITs
For Healthcare REITs, a closer look at senior housing is worthwhile. The US population is getting older, and in 2026 the first baby boomers will reach the age of 80. At the same time, relatively little has been built in recent years. This combination is now starting to become clearly visible in the numbers.
The average occupancy rate (occupancy rate) of senior housing properties was 83% in the third quarter. 90,4 % This was already the 21st consecutive quarter with increasing occupancy. However, what is even more interesting is the supply side. According to NIC, current construction activity corresponds to only about ten percent of the additional supply needed annually. In the medium term, more than 100,000 new units are needed per year, while currently only about 10,000 are being completed.
This provides existing operators with a fairly comfortable starting position. Increasing occupancy not only leads to higher revenues. Since a significant portion of the costs of a senior housing facility are fixed or at least not proportional to the number of residents, additional occupancy can disproportionately impact net operating income (NOI).
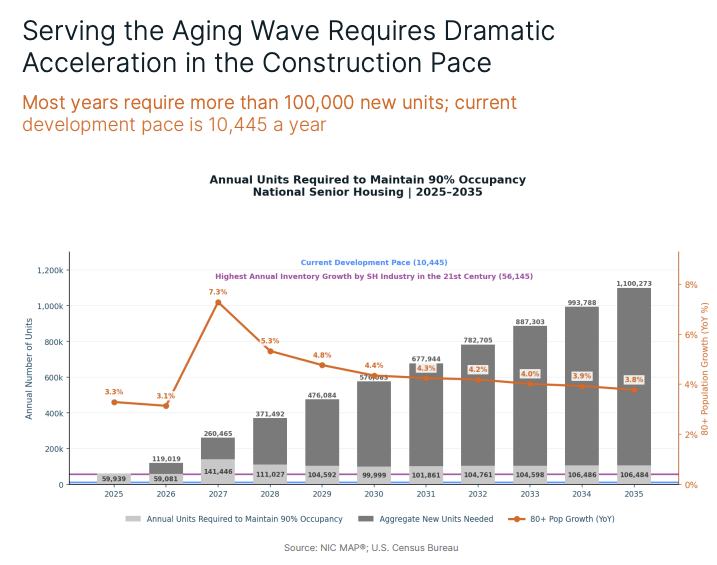
Senior housing occupancy and supply gap (Source: NIC Senior Housing Market Outlook 2026)
Welltower
Welltower (TWS ticker: WELL, ISIN: US95040Q1040) is now one of the largest publicly traded REITs ever and is probably currently the best example of what the combination of increasing occupancy and tight supply can achieve.
Normalized FFO per share increased by 24.6% to 1.67 USD increased. The same-store NOI of the entire portfolio increased by 15.8%, in the particularly important Seniors Housing Operating Portfolio it was even 21,0 %.
This is not simply a result of strong rental growth. The average occupancy rate in the senior housing portfolio has increased by 320 basis points compared to the previous year. At the same time, revenue per occupied room has increased by 5.3%. Welltower is therefore receiving more units occupied and more revenue per occupied unit at the same time. This combination has led to a significant increase in margins.
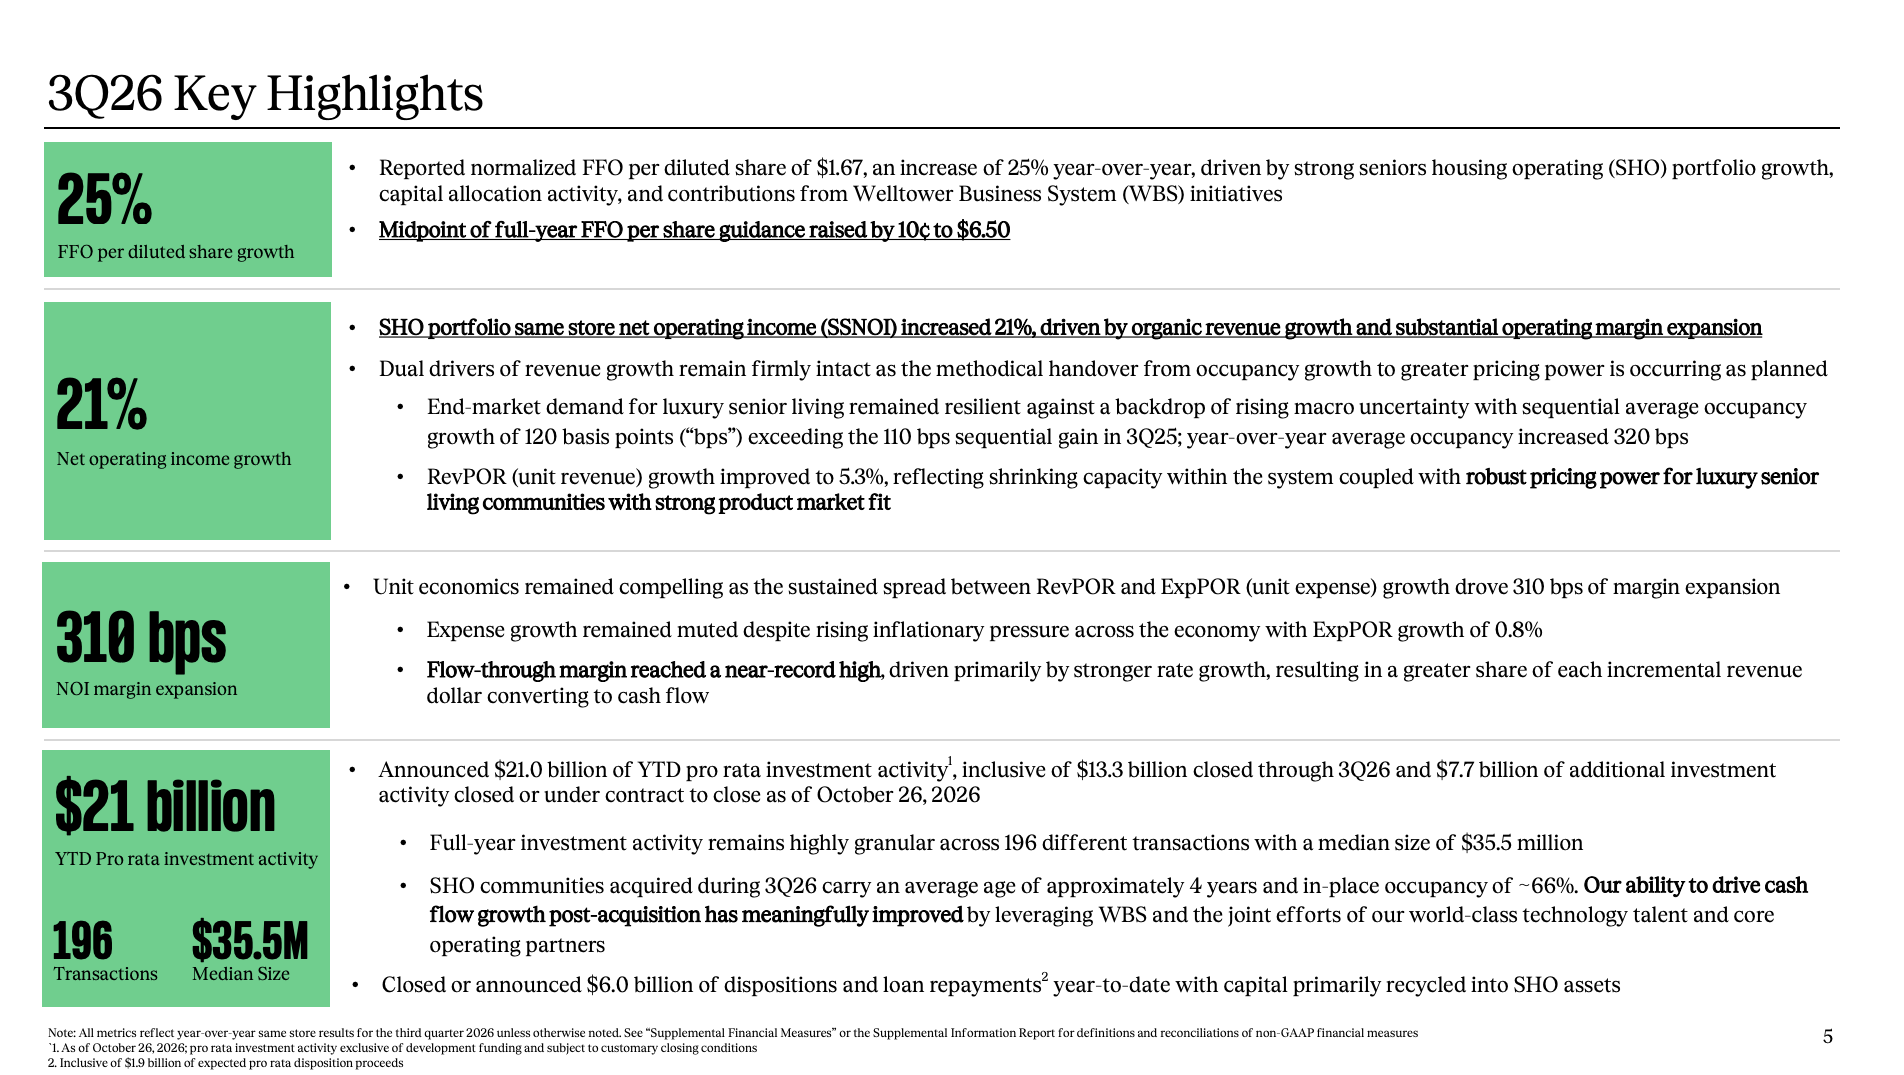
Portfolio diversification (Source: Welltower Q326 Business Update)
Welltower is also stepping up its external growth efforts. By the end of September, 13.3 billion USD in pro-rata investments had already been completed. Another 7.7 billion USD were completed or agreed upon after the end of the quarter. Overall, the company thus reports that 21 billion USD of completed or announced investments.
Normally, such growth with simultaneously high interest rates would make me a bit nervous. However, the balance sheet continues to look unusually strong. Net Debt/Adjusted EBITDA ended Q3 at only 3,02× And Welltower had around $9.5 billion in liquidity.
For example, in July the company issued Canadian bonds with a weighted coupon of only 3.95%. With a strong balance sheet and access to various international capital markets, this is a pretty significant competitive advantage in the current environment.
Following all the positive news, the annual forecast has been raised again. For 2026, Welltower now expects Normalized FFO per share to be between $6.47 and $6.53.
And that brings us to the problem for interested but not invested private investors. At a price of around 245 USD The average of the guidance of 6.50 USD corresponds roughly to 38-fold Normalized FFO. This is a sporting valuation even for a very high-quality REIT.
Operationally, Welltower is probably one of the most impressive REITs out there right now. The question is rather how much of this development is already baked into the price.
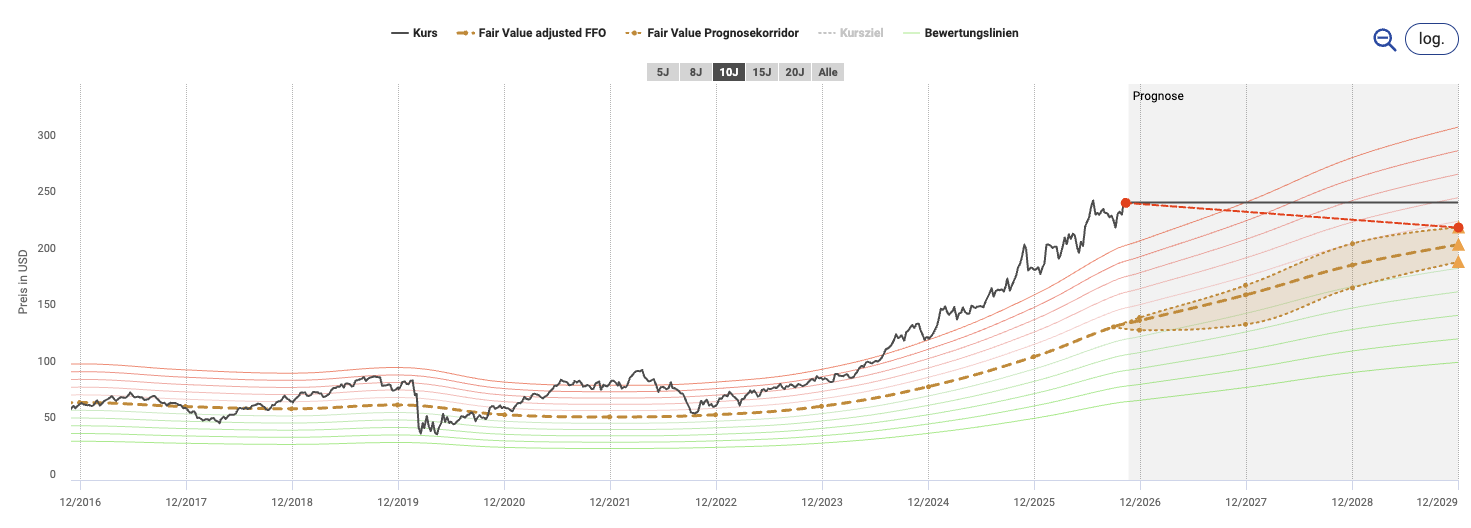
Fairer Wert Welltower (Source: aktienfinder.net)
Sales
Ventas (TWS ticker: VTR, ISIN: US92276F1003) benefits from exactly the same demographic trends as Welltower, but currently has a significantly lower valuation. Here too, senior housing was the clear growth driver.
Normalized FFO per share increased by 10% off at $0.99 The company’s total Same Store Cash NOI increased by 11%, and the Senior Housing Operating Portfolio, or SHOP, grew by approximately 10%. 16 %. In the USA it was even around 17%.
The average occupancy of the SHOP portfolio has increased by 290 basis points compared to the previous year. At the same time, RevPOR has increased by 5%, and the same-store cash NOI margin has increased by 190 basis points to 30.7%.
Here we can clearly see the operational leverage that I described at the beginning. The more fully the facilities are equipped, the greater the share of additional revenue that remains attached to the NOI.
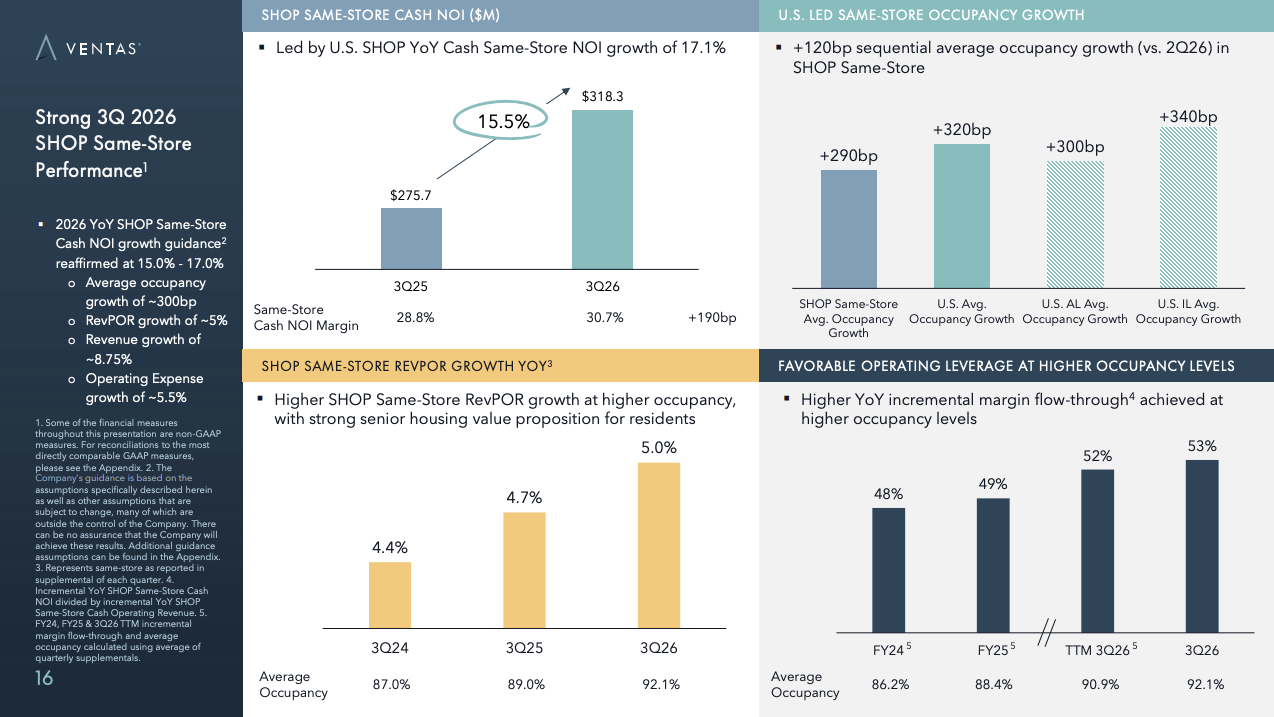
Growth in Net Operating Income / Occupancy (Source: Ventas Earnings Presentation Third Quarter 2026)
At the same time, Ventas is investing heavily in further growth. By the end of Q3, 2026 had already been reached. 5.2 billion USD Invested predominantly in senior housing. The funds were raised primarily through the sale of equity securities worth $3.9 billion that had already been completed. Another $0.8 billion was not yet completed at the end of the quarter.
This is a significant difference compared to many smaller REITs. When a company’s own stock is highly valued, new equity capital, despite dilution per share, can be a very attractive source of financing, as long as the properties purchased with it generate higher returns.
The annual forecast has also been raised. Ventas now expects Normalized FFO of $3.87 to $3.90 per share.
At the course of about 88 USD This roughly corresponds to P/FFO from 23x. With that, Ventas is anything but cheap, but is clearly priced much lower than Welltower.
For me, the healthcare sector is currently a good example of how high interest rates do not necessarily have to mean weak REIT results. If a company achieves double-digit internal growth rates while at the same time having access to equity capital, the interest rate environment can be partially compensated for.
Data Center REITs
The second sector is even more extreme! Data centers currently benefit directly from the expansion of cloud infrastructure and artificial intelligence. The actual problem is no longer, in many places, building a building, but getting enough electrical power.
In the eight largest data center markets in North America, the available capacity is extremely tight despite record construction activity. More than 80% of the capacity currently under construction is already pre-leased. The average vacancy rate in the first half of the year was only 1.4%. In Northern Virginia it was even only 0.2%.
Prices are also rising. For larger installations between three and ten megawatts, the average asking rents in the first half of the year rose by 8.3%.
At first, this sounds like a dream for landlords. However, data centers require enormous amounts of capital. Land, buildings, power supply, network connections, cooling, etc. all require billions of investments before the corresponding cash flows can even be generated.
That is precisely why financing plays a particularly important role here.
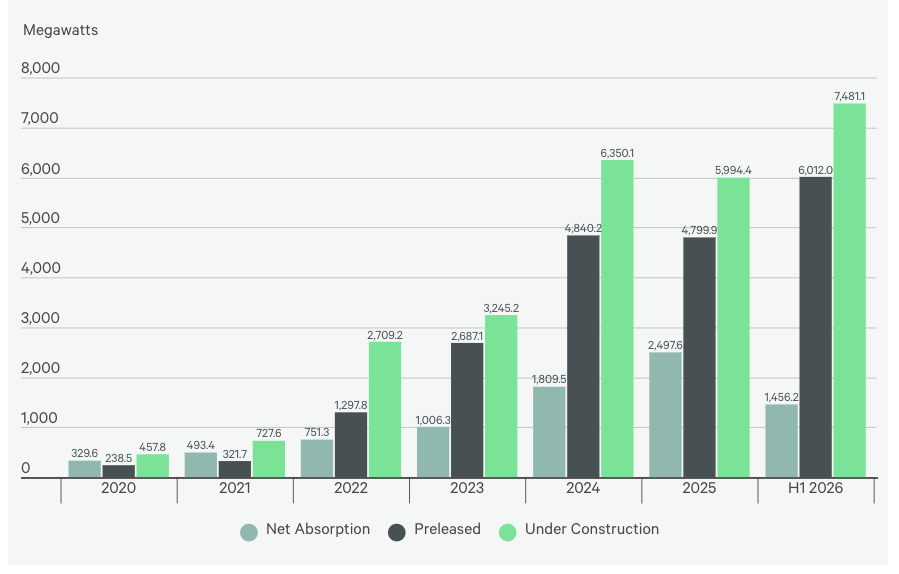
Net absorption in the primary market, pre-leasing and data centers under construction
(Source: CBRE North America Data Center Trends H1 2026)
Digital Realty Trust
Digital Realty (TWS ticker: DLR, ISIN: US2538681030) operates more than 300 data centers in over 55 metropolitan regions, covering a fairly wide part of the market from the classic colocation business to large hyperscale installations.
The third quarter was exceptionally strong for DLR. Core FFO per share increased from 1.89 to 2.10 USD Digital Realty has achieved record bookings at the same time. New contracts signed correspond to annualized GAAP rents of $855 million on an overall basis. Of this, approximately $627 million came from Digital Realty's share.
Even more important is the backlog that has already been signed but has not yet been started. This backlog has now grown to 2.5 billion USD annualized base rent on a total basis, or $1.8 billion on DLR share.
Of course, this does not mean that these 1.8 billion will appear fully in sales tomorrow. There can be months or even years between the conclusion of the contract and the start of operations of a large data center. However, it does mean that a significant portion of future growth is already contractually secured.
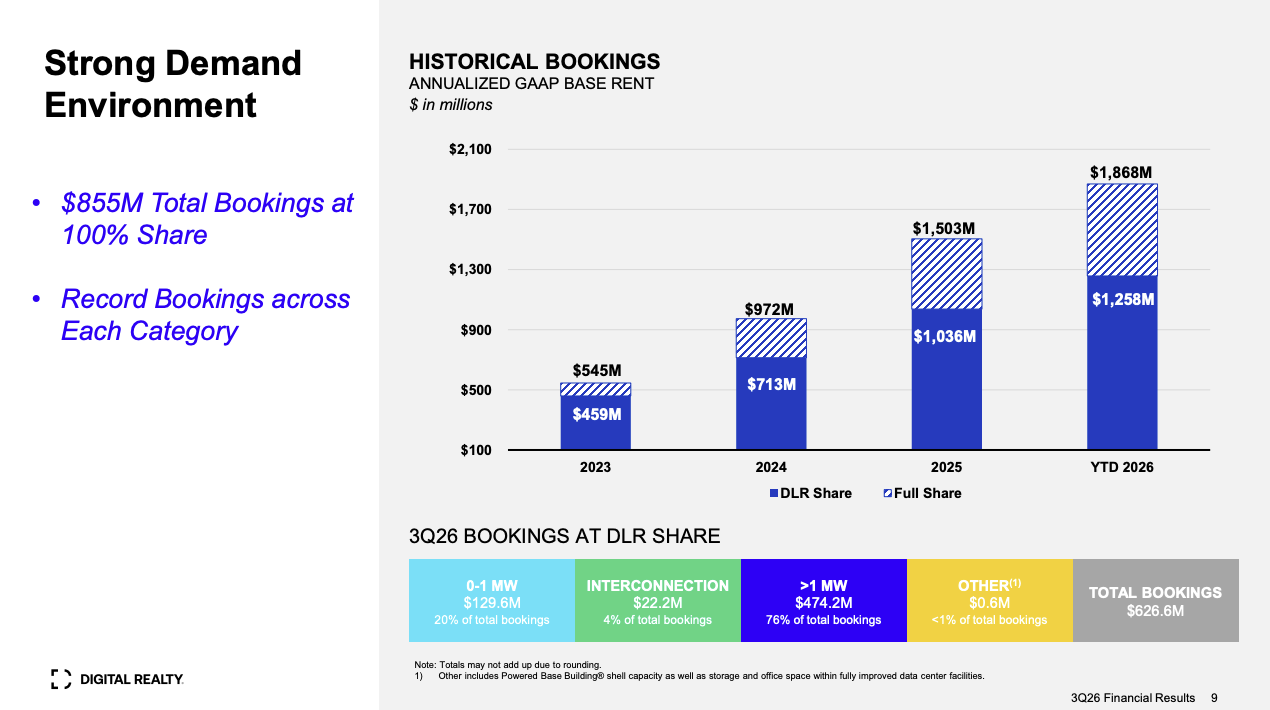
Development of Bookings (Source: DLR 3Q26 Financial Results)
In existing contracts as well, pricing power has now returned. Cash rental rates on renewals were up by 10% in the third quarter. 11,8 % has increased. A few years ago, Digital Realty still had some negative spreads when extending contracts.
The flip side is the enormous capital requirement! Digital Realty has approximately $19.5 billion in balance sheet debt. Net Debt/Adjusted EBITDA was 5.2x at the end of Q3. Taking into account already leased Northern Virginia projects that are expected to provide additional EBITDA contributions after stabilization, the company has a pro forma ratio of 4.9x.
My focus therefore shifts to the increasing use of private capital and joint ventures. Digital Realty, like many other very large REITs, is trying to no longer finance every dollar of growth exclusively from its own balance sheet.
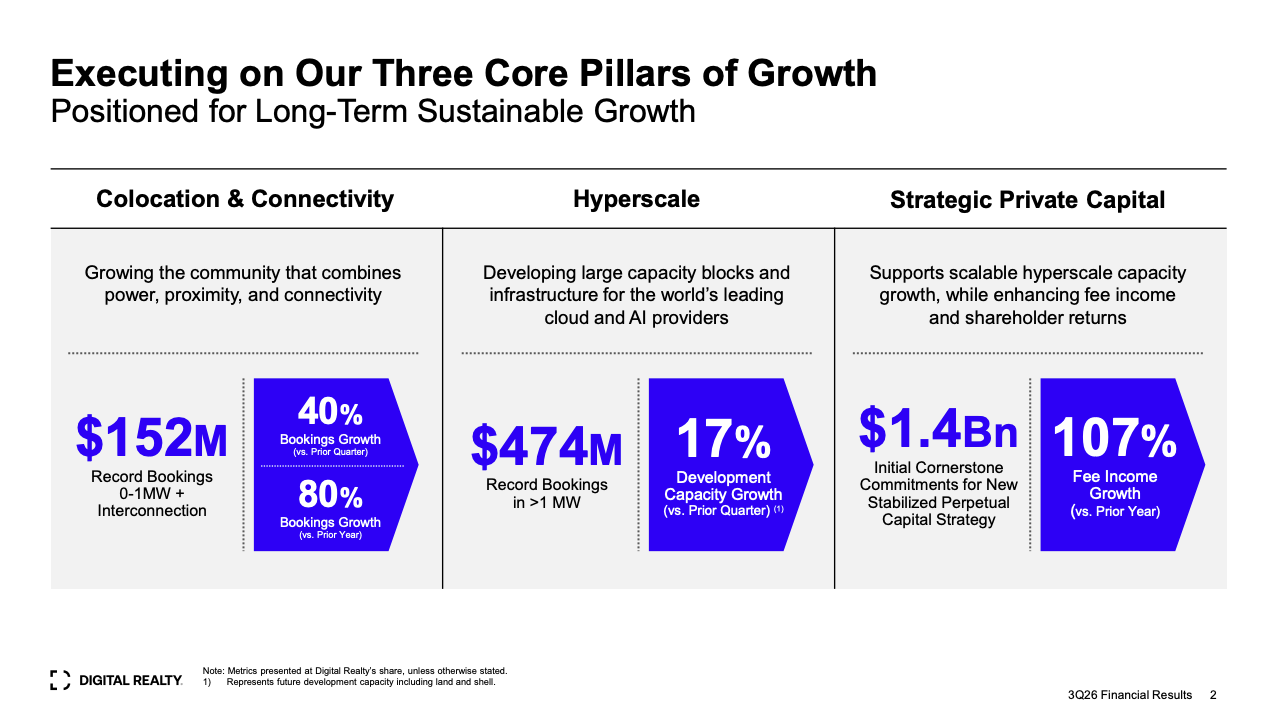
The three growth pillars of DLR (Source: DLR 3Q26 Financial Results)
The guidance for 2026 was set at Core FFO of 8.30 to 8.35 USD per share raised.
At about 180 USD, the average corresponds roughly to 21-fold Core FFO. That’s not cheap, but given the current growth rate, it’s significantly less extreme than, for example, the valuation of Welltower.
Equinix
Equinix (TWS ticker: EQIX, ISIN: US29444U7000) takes a slightly different approach within the data center industry than Digital Realty.
The company focuses heavily on colocation and interconnection. Customers are not simply renting data center space; they are using Equinix as a hub to connect with cloud providers, networks, business partners, and other companies.
This creates a certain network effect. The more companies and networks that are already connected to each other in a given location, the more interesting that location becomes for additional customers.
The Q3 figures currently show quite impressively how well this works. Sales are up 11% compared to the previous year. 2.57 billion USD The AFFO share has risen by 18% 11.64 USD Adjusted for a one-time effect from the atNorth transaction, growth on a constant currency basis still stood at around 12%.
The annualized gross bookings have increased by 533 million USD achieved a new record and increased by 35% compared to the previous year. At the same time, Equinix added 6,900 additional interconnections.
The price development is also interesting. The prices of new deals increased by around 12% compared to the previous year in the third quarter, while churn remained low at 1.7%.
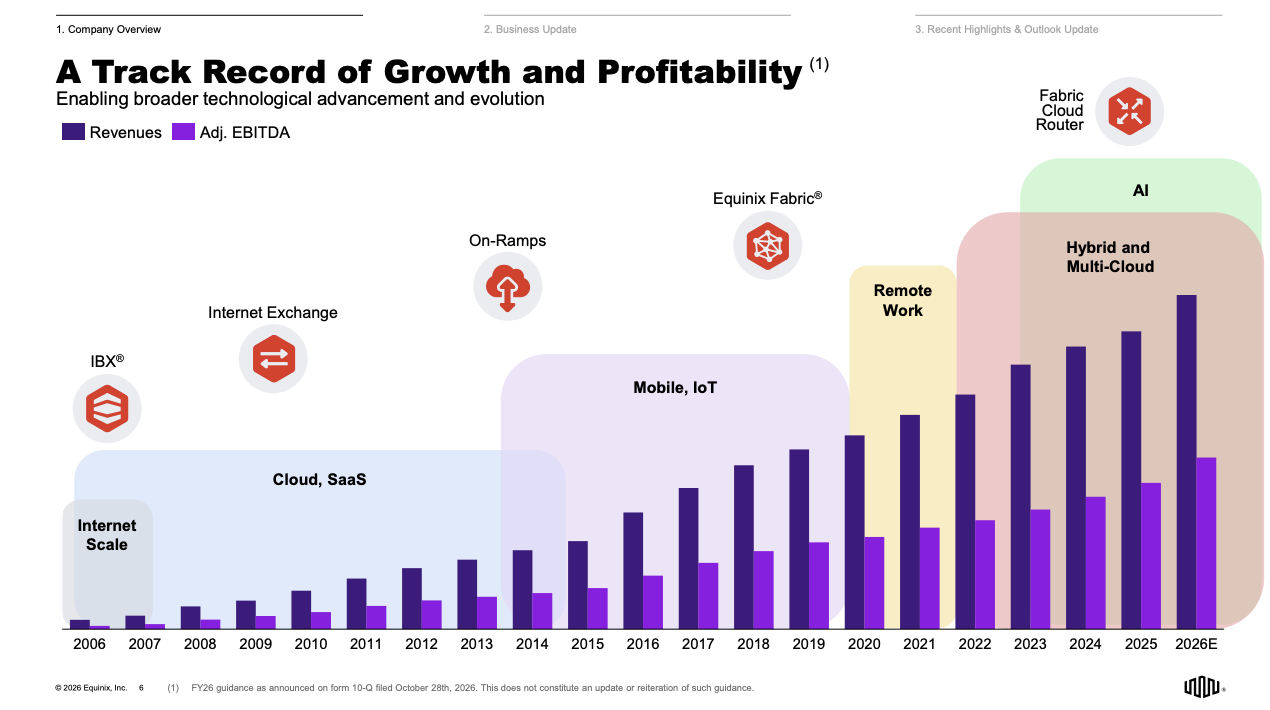
Equinix growth over the past 20 years (Source: Equinix Q3 Earnings Presentation)
Equinix is investing with considerable aggressiveness. For the full year, it is now Capex of 5 to 6 billion USD expected. A large part of it will flow into new capacities.
The balance is still reasonably well-positioned. In the Q3 presentation, Equinix lists a blended borrowing rate of around 3.2% and a weighted remaining maturity of the debt of 6.1 years.
For 2026, management now expects AFFO per share between 43.71 and 44.11 USD. At a price of around 1,041 USD, this corresponds to approximately 24-fold AFFO.
Both Digital Realty and Equinix are therefore well valued. However, unlike many traditional REITs, both are currently delivering double-digit growth rates. That is exactly where the big difference lies.
With a Net Lease REIT with one or two percent rental increases, a Treasury yield of five percent is a fairly immediate competitor. With a Data Center REIT whose AFFO grows in the double digits, this comparison plays a much smaller role.
Industrial REITs
We already discussed industrial REITs in our Q2 report. Back then, EastGroup and Rexford were two quite different companies.
I would nevertheless like to take up the topic again, because the recovery that became apparent in the summer has now become much more concrete.
Net absorption in the US industrial market was up in the third quarter. 104.6 million square feet increased. This was the highest quarterly value since the end of 2022. At the same time, the national vacancy rate fell to 6.4%. Leasing activity increased by 27.1% compared to the previous year.
What I find particularly interesting is where part of the additional demand comes from. In addition to e-commerce and traditional logistics, advanced manufacturing and the supply chains surrounding data centers and energy infrastructure are playing an increasingly important role. In this context, the two previous topics actually overlap with industrial real estate.
The supply side, however, is starting to react again. The development pipeline has increased again compared to the previous year. Therefore, the current advantage from low new construction is unlikely to last indefinitely.
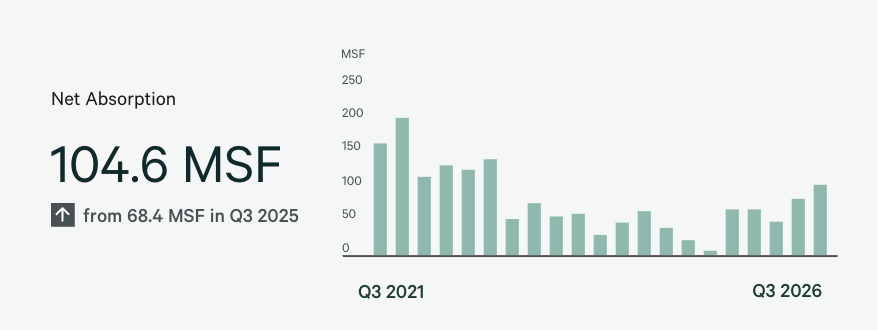
Net absorption in industrial space (source: CBRE Q3 2026 U.S. Industrial & Logistics Market Report)
Prologis
Prologis (TWS ticker: PLD, ISIN: US74340W1036) is by far one of the largest industrial REITs worldwide and, due to its size, a good gauge for the entire logistics market.
The Core FFO per share increased from 1.49 in the third quarter to 1.60 USD The average occupancy rate was 95.1%, and at the end of the quarter it was 95.6%.
Even more interesting are the leasing spreads. The cash rents are lower on newly launched contracts. 23,4 % This has increased, even by 38% in net-effective terms. This shows that many older contracts still contain significant mark-to-market reserves.
At the same time, Prologis signed nearly 60 million square feet of new leases in the quarter.
The company now sees demand significantly more positively. In addition to e-commerce and advanced manufacturing, Prologis explicitly mentions the expansion of data center supply chains as an additional factor of demand.
Prologis itself is increasingly developing data center infrastructure and energy projects as well. This blurs the line between a traditional logistics REIT and an infrastructure company, at least to some extent.
The balance sheet remains strong as well. Debt/Adjusted EBITDA was 4,5×, With an average interest rate on debt of only 3.3% and an average remaining maturity of 7.6 years, a total of 1.3 billion USD was raised in new debt in the third quarter, together with co-investment vehicles, with an average interest rate of four percent.
This again shows how large the difference between individual REITs can be in the current interest rate environment.
The Core FFO guidance for 2026 now stands between USD 6.25 and 6.29 per share. At a price of around 125 USD This roughly corresponds to 20-fold Core FFO.
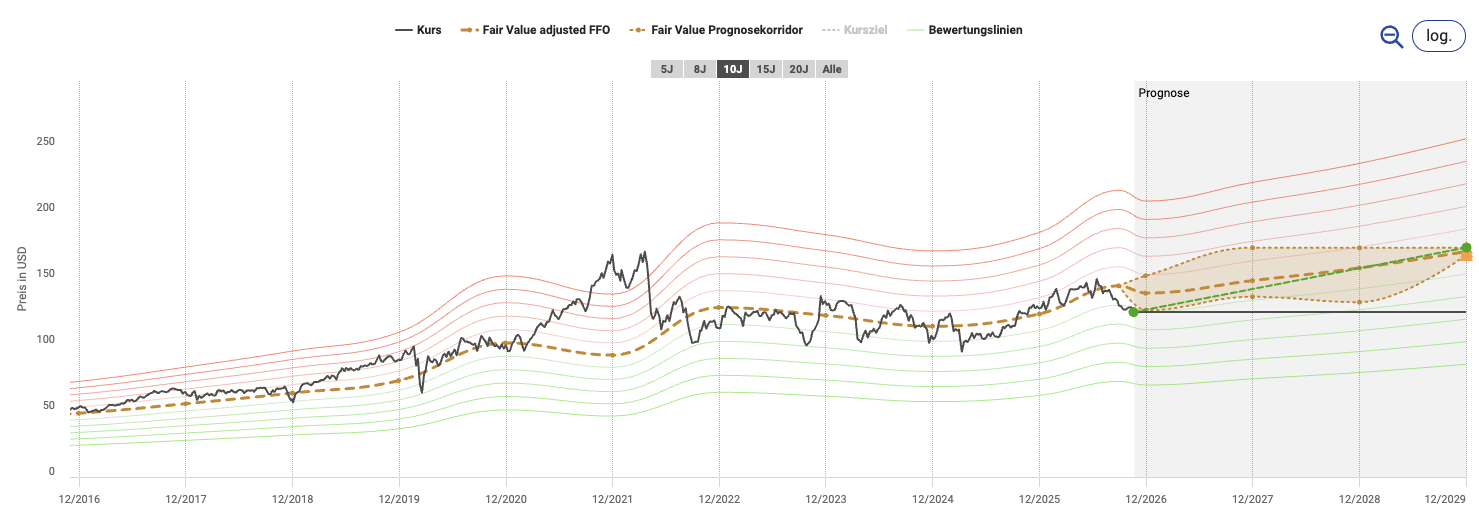
Fairer Wert Prologis (Source: aktienfinder.net)
First Industrial Realty Trust
First Industrial Realty Trust (TWS ticker: FR, ISIN: US32054K1034) is significantly smaller than Prologis, but it also focuses on US logistics real estate.
And here we can see particularly clearly how much mark-to-market potential still lies in existing lease agreements.
The FFO per share increased from 0.76 in the third quarter to 0.81 USD increased. Cash Same-Store NOI increased by 5.6%. However, the occupancy rate decreased from 94.9% in Q2 to 94.1%.
The highlight here were the leasing spreads as well. For all new and extended contracts launched in the quarter, the cash rents are on average up by 52,3 % increased. For Renewals alone, it was even 59.1%. On a straight-line basis, the average increase across all contracts was 76.1%.
These are of course not rent increases that can be repeated every year. They rather show how significantly some old contracts now fall below the current market rents.
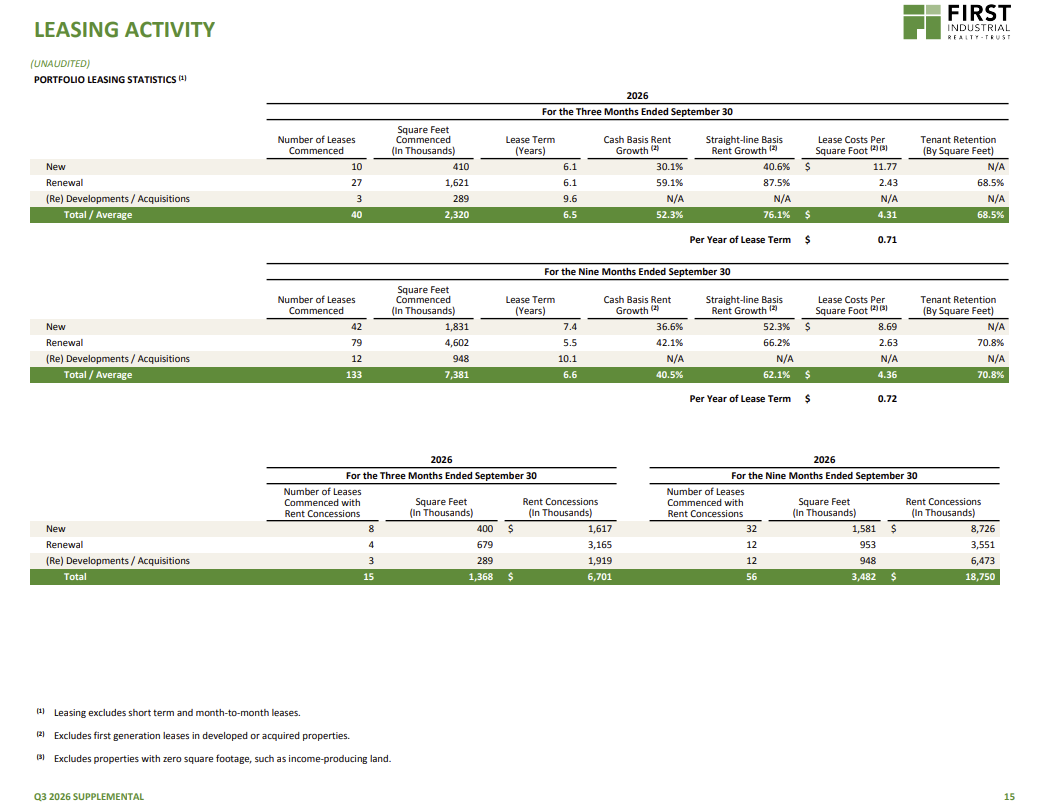
Rental growth in new leases (Source: Third Quarter 2026 Supplemental - First Industrial Realty Trust)
The balance sheet also looks reasonable. Net Debt/Adjusted EBITDA is 4.7× and 4.5× on a pro-forma basis, respectively. 99.5% of the real estate assets are unencumbered.
The guidance for 2026 has been slightly revised and now stands at FFO of $3.11 to $3.15 per share.
At the course of ~54 USD That roughly corresponds to 17.5-fold FFO. This makes First Industrial currently valued more cheaply than Prologis, even though the operating rental increases currently are even higher.
The difference lies primarily in size, balance sheet quality, diversification, and Prologis’ global platform.
FR is therefore the slightly more favorable option within this comparison, whereas Prologis is on a different level in terms of quality and capital market opportunities.
Options trading
As is well known, I myself also actively trade options, mostly as a short seller. However, the absolute share prices for several of the REITs presented today are significantly higher than for classic Net Lease or Residential REITs. This makes a short put position that is not covered quickly capital-intensive. The Volatility (VIX) has recently gained some weight again.
- Welltower: At a price of $245, I would rather go with WELL. Bull Put Spread Look at a naked short put. For example, strikes near $220 with a maturity of several months would be interesting.
- Sales: In VTR, there are actually only long-distance short putts with Strike of $80 in May '27 (increased spread)
- Digital Realty: At DLR I find long-lasting short putters with Strike of $175 in September or December '27 interesting
- Equinix: Given the share price of more than 1,000 USD, I would trade EQIX exclusively via spreads. A single short put would otherwise simply tie up too much capital. For example, one could Strikes of $1,030 and $1,020 in January '27 choose
- Prologis: PLD usually has a relatively liquid options chain. Long-running short puts with Strike of $120 in December '27 to
- First Industrial: At FR, there are also long-lasting short putters with Strike of $50 in June '27 (increased spread)
Conclusion
The third quarter shows me quite clearly why the analysis of individual REIT sectors is so interesting in the current interest rate environment.
The ten-year US government bond is now again delivering more than five percent yield, and the Fed has not yet given any warning after the interest rate hike in September. For slowly growing real estate companies, this remains a significant problem.
At the same time, there are also sectors where the operating growth is significantly stronger than the interest rate headwinds.
Healthcare REITs combine a rapidly aging population with very low new construction activity for years. Welltower and Ventas are already benefiting from increasing occupancy rates, higher prices, and strong operational leverage. However, in Welltower this development has now been appropriately evaluated as ambitious.
The situation is even more extreme for Data Center REITs. AI, cloud, and the increasing digitalization are driving enormous demand, while the availability of electricity and network connections limits the supply. As a result, Digital Realty and Equinix are currently achieving double-digit growth rates and at the same time already have large backlogs or record bookings.
Industrial REITs, on the other hand, are in a cyclical recovery. Net absorption reached the highest quarterly value since 2022, and vacancies are starting to decline again. At the same time, Prologis and First Industrial continue to see significant mark-to-market potential in old leases.
And that brings us back to a point that appears in almost every one of my REIT articles.
The balance remains decisive!
Companies like Welltower with around 3x net debt/EBITDA or Prologis with long-term financed debt at an average of only 3.3% can also continue investing in an environment with five percent Treasury yield. A more heavily indebted REIT with large short-term refinancing needs, on the other hand, has significantly less leeway.
High interest rates therefore do not automatically make REITs less attractive. However, they do increase the requirements for growth, balance sheet, and capital allocation.
And right now, there is a world of difference between a slowly growing classic real estate portfolio and a Data Center REIT with double-digit AFFO growth.